

Abstract
Monocytes are actively recruited from the circulation into developing atherosclerotic plaques. In the plaque, monocytes differentiate into macrophages and eventually form foam cells. Continued accumulation of foam cells can lead to plaque rupture and subsequent myocardial infarction. X-ray computed tomography (CT) is the best modality to image the coronary arteries non-invasively, therefore we have sought to track the accumulation of monocytes into atherosclerotic plaques using CT. Gold nanoparticles were synthesized and stabilized with a variety of ligands. Select formulations were incubated with an immortalized monocyte cell line in vitro and evaluated for cytotoxicity, effects on cytokine release, and cell uptake. These data identified a lead formulation, 11-MUDA capped gold nanoparticles, to test for labeling primary monocytes. The formulation did not the affect the viability or cytokine release of primary monocytes and was highly taken up by these cells. Gold labeled primary monocytes were injected into apolipoprotein E deficient mice kept on Western diet for 10 weeks. Imaging was done with a microCT scanner. A significant increase in attenuation was measured in the aorta of mice receiving the gold labeled cells as compared to control animals. Following the experiment, the biodistribution of gold was evaluated in major organs. Additionally, plaques were sectioned and examined with electron microscopy. The results showed that gold nanoparticles were present inside monocytes located within plaques. This study demonstrates the feasibility of using gold nanoparticles as effective cell labeling contrast agents for non-invasive imaging of monocyte accumulation within plaques with CT.
Keywords: monocytes, atherosclerosis, gold nanoparticles, computed tomography, cell tracking
Introduction
Cardiovascular disease is the leading cause of death in the United States, accounting for 1 in every 3 deaths.1 The majority of these deaths arise from the development of atherosclerosis in the coronary arteries, where rupture of vulnerable plaques can potentially lead to thrombus formation and myocardial infarction. Over the last decade, the role of inflammation in atherosclerosis has become a prominent point of study in progression of the disease.2
After the initial development of inflammation in the arterial wall, monocytes are actively recruited from the circulation into the arterial wall. In the intima, monocytes differentiate into macrophages and eventually foam cells after engulfing low density lipoproteins (LDL).3 These foam cells release cytokines and enzymes that lead to growth and destabilization of the plaque over time.4 Continued recruitment of monocytes and subsequent accumulation of foam cells increase the likelihood of plaque rupture and clinical manifestations of atherosclerosis. Monocyte recruitment is a possible drug target for atherosclerosis regulation.5 Studies have found that targeting the chemokine receptors on monocytes reduces overall plaque progression.6–8 The accumulation of monocytes has been found to correlate to the progression and severity of atherosclerosis.9 These studies typically involve destructive processes to analyze monocyte population in plaques preventing the study of multiple time points in the same animal. With non-invasive detection, monocyte accumulation can be rapidly assessed, informing the direction of the study before its end. This information can be revealing in clinical trials, where imaging may demonstrate the effectiveness or lack of effectiveness of drug therapies without invasive measures or waiting for patient mortality outcomes.10
CT is one of the best and most frequently used modalities to image the coronary arteries non-invasively in patients.11 Modern CT scanners allow for fast, high resolution image acquisition, reducing common cardiac and respiratory motion artifacts when imaging the coronary arteries.12 With increasing interest in cell imaging, the use of x-ray CT is an emerging modality in cell tracking applications. Astolfo et al. and Menk et al. performed detailed analysis of gold nanoparticle uptake in cells, as well in vivo detection and proliferation of gold labeled tumor cells in rat brain tumor models.13–14 Moreover, recent studies utilizing synchrotron radiation sources for x-rays, have been able image gold nanoparticle labeled cells with single cell resolution in ex vivo and in vitro samples.15–16 Of the few studies regarding monocyte tracking, SPECT and MRI modalities were used.17–18 SPECT and MRI face challenges due to chest and heart motion when imaging the coronary arteries.19 Therefore, we sought to develop a technique to monitor the monocyte accumulation in atherosclerotic plaques non-invasively through computed tomography.
Gold nanoparticles (AuNP) have been explored for biomedical applications due to the synthetic control over size, shape and coating, their high biocompatibility and their unique physical properties.20 This allows the development of AuNP that have specific properties tailored for given biomedical applications. For instance, the addition of poly(ethylene glycol) (PEG) coatings to particles can be used to increase in vivo circulation time by avoiding uptake by cells of the reticuloendothelial system.21 AuNP are popular as experimental CT contrast agents, as they attenuate x-rays strongly, as well as the afore-mentioned characteristics of biocompatibility and control over size and surface functionality.22–24 AuNP have been shown to be effective as both blood pool and targeted contrast agents for CT.25–28
In this study, we demonstrate the use of AuNP to label monocytes and track their migration into atherosclerotic plaques non-invasively using CT. We synthesized AuNP 15 nm in diameter and performed ligand exchange with a variety of ligands to create a library of AuNP. These particles were characterized with dynamic light scattering (DLS), zeta potential, and transmission electron microscopy (TEM). After characterization, AuNP were evaluated in vitro for the effects on cytotoxicity, cytokine production, and cell uptake with monocytes. A lead formulation was then evaluated in vitro with primary monocytes isolated from spleens. Lastly, atherosclerotic mice were injected with AuNP labeled monocytes and scanned with CT before injection and days 3, 4, and 5 post injection. The CT scans were analyzed for intensity. Aortic plaques were excised and examined with TEM for the presence of gold labeled monocytes.
Results
Gold nanoparticle synthesis and characterization
The Turkevich method of synthesizing gold nanoparticles was used to produce citrate coated gold nanospheres (Figure 1A).29 For additional stability in biological media, a library of thiol-ligands was used to displace the citrate ligands of the AuNP (Supporting Figure 1). Stability for each AuNP formulation was evaluated with Dulbecco’s Phosphate Buffered Saline (DPBS). When suspended in a salt based solution, stable gold nanoparticles of this size appear as a deep red solution while non-stable gold particles aggregate causing the solution to change to a blue-black color. We identified the following 5 stable coatings which we tested further: 11-mercaptoundecanoic acid (11-MUDA), 16-mecaptohexadecanoic acid (16-MHDA), poly(ethyleneimine) (PEI), 4-mercapto-1-butanol (4-MB), and 11-mercaptoundecyl-tetra(ethylene gycol) (MTEG). These ligands give the nanoparticles several different surface functionalities, which could influence cellular interactions including cell uptake and cytotoxicity.
Figure 1.

(A) Schematic of ligand exchange for citrate capped gold nanoparticles. (B) Chemical structures of 5 formulations further used in experiments. (C) TEM image of 11-MUDA capped AuNP.
TEM was used to observe the particle size and shape (Figure 1B). TEM revealed monodispersed spheres of 14.6 ± 1.5 nm in average diameter. DLS and zeta potential were performed to characterize hydrodynamic diameters and surface charges (Table 1). The hydrodynamic diameter of the particles seemed to relate to the size of the ligand used to stabilize the particle, i.e the shortest ligand 4-MB displayed the smallest hydrodynamic diameter, although it seems likely that for the PEI and MTEG coated AuNP that there is some degree of aggregation of cores. The zeta potential results showed that carboxylic acid ligands (11-MUDA, 16-MHDA) and alcohol ligands (4-MB) had negative surface potentials, as expected. Additionally, AuNP coated with PEI, which has many amine groups, had a positive surface potential. AuNP that were coated with MTEG, which has a methoxy group at the distal end, had a nearly neutral charge.
Table 1.
Characterization of selected AuNP formulations
| Surface Formulation | DLS Diameter (nm) | Surface Charge (eV) |
|---|---|---|
| 11-MUDA | 31.5 | −36.8 |
| 16-MHDA | 52.2 | −36.2 |
| 4-MB | 25.9 | −35 |
| PEI | 91.83 | +45.4 |
| MTEG | 111.9 | −2.1 |
In vitro evaluation of selected AuNP formulations
Following selection of AuNP formulations, we examined the interaction of these particles with a monocyte cell line, RAW 264.7. The viability of the cells after the treatment with AuNP formulations was examined using the LIVE/DEAD assay. Each formulation was assessed at several concentrations (0.025, 0.05, 0.1, 0.5, and 1.0 mg/ml of Au) for 24 hours. The ratio of living cells to total cells was determined via automatic counting by a custom MATLAB program. The results shown in Figure 2A demonstrate high biocompatibility for each formulation at the concentrations examined except for PEI. Due to being a polycation, PEI has been widely used as a transfection agent in gene therapy applications, but it is known that PEI can cause toxicity.30
Figure 2.
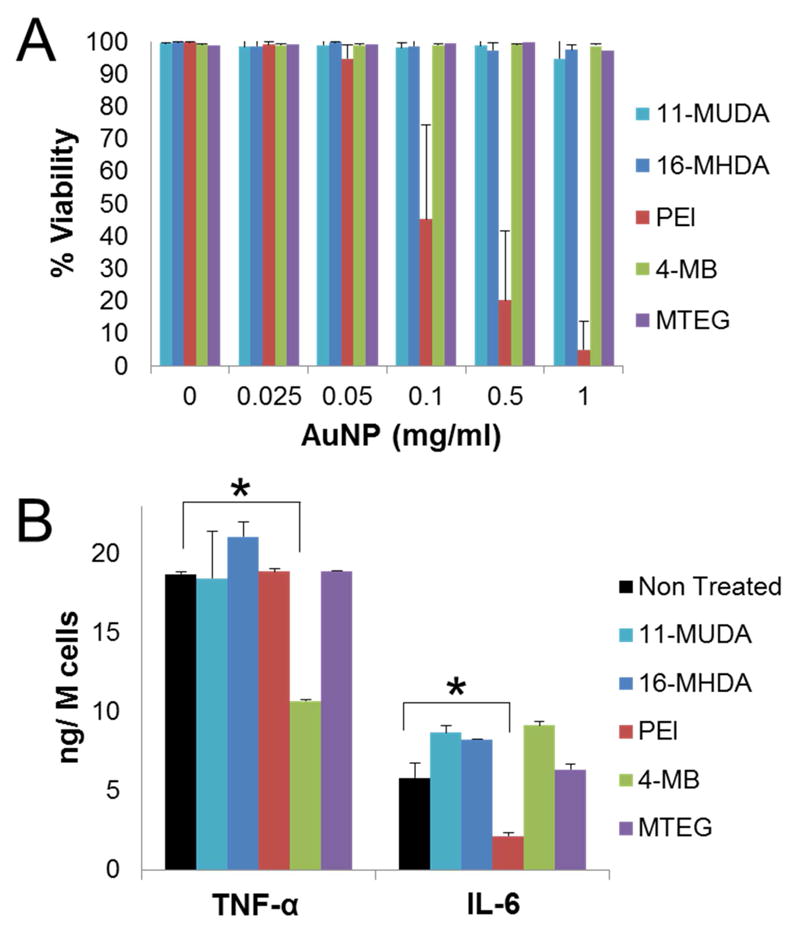
(A) Viability of monocytes after treatment with different AuNP formulations at increasing concentrations. Viability % expressed as the ratio of living cells to total cells in the well. (B) Results from ELISA for TNF-α and IL-6 release after treatment (0.5 mg/ml) with different AuNP formulations. * P<0.05 compared to samples not treated with AuNP. (Student’s t-test)
We next assessed if the uptake of AuNP would affect monocyte function in an inflammatory role. Circulating monocytes produce pro-inflammatory cytokines such as TNF-α, and IL-6 after activation.31 We therefore evaluated the cytokine release of TNF-α and IL-6 from monocytes after 0.5 mg/ml treatment of each AuNP formulation and activation with lipopolysaccharides (LPS). The AuNP formulations did not appear to disrupt cytokine release for 11-MUDA, 16-MHDA, and MTEG. However, the 4-MB formulation was found to decrease the cytokine release of TNF-α, but not IL-6. PEI coated AuNP, on the other hand, were found to decrease the release of IL-6, but not TNF-α.
Previous studies have demonstrated that size, shape, and surface functionality of the AuNP can significantly affect the amount of uptake into the cells.32–33 While each of our formulations are spherical in shape, the different surface ligands resulted in altered hydrodynamic sizes and surface properties of the particle. After treating with AuNP, monocytes were found to take up the AuNP into vesicles, likely to be lysosomes. Figure 3A shows TEM images of sections of monocytes that had been incubated with 11-MUDA. The uptake of these gold particles may be via phagocytosis as found in other gold cell labeling studies.34
Figure 3.

(A) TEM image of a RAW 264.7 monocyte cell after 24 hr incubation with 11-MUDA AuNP. (B) CT images of pellets of 11-MUDA and 4-MB AuNP treated monocytes at increasing concentrations. (C) Quantification of intensities from CT scans for each formulation.
We studied the amount of AuNP uptake by monocytes for each formulation by examining CT contrast generation. Each formulation was incubated at three concentrations (0.1, 0.25, 0.5 mg/ml) for 24 hours. After treatment, cells were collected and scanned using a clinical CT scanner. The scans show an observable increase in CT attenuation dependent on the treatment concentration for our formulations (Figure 3B). The attenuation was quantified by measuring the intensity of the pellets. The attenuation was quantified by measuring the intensity of the pellets. The attenuation of 11-MUDA, 16-MHDA, and 4-MB increased proportionally with treatment concentration of AuNP. It is important to note that the images seen in Fig. 3B are not saturated, but some pixels are very bright due to the CT windowing scale used. All attenuation values in these experiments were well below the maximum CT attenuation values handled by this clinical system (3000 HU).22 The attenuation for the PEI formulation was not dependent on the concentration of gold, likely due to the toxicity seen in Figure 2A. Interestingly, 11-MUDA displayed significantly higher attenuation than 16-MHDA despite both ligands having carboxylic acid functional groups. The size difference in hydrodynamic diameter (Table 1) may account for the difference in gold uptake between the formulations. The MTEG formulation was found to have the lowest uptake, which was not surprising since ethylene glycol based ligands are known to reduce nanoparticle uptake by the mononuclear phagocytosis system.35 The results show that formulations of 11-MUDA and 4-MB displayed the highest CT attenuation and therefore AuNP uptake (Figure 3C). From the DLS and zeta potential results, both formulations 4-MB and 11-MUDA have relatively low hydrodynamic diameters and strong negative surface charge suggesting that these particle properties may encourage high AuNP uptake.36 Taking together all the results from these in vitro experiments, we chose to move forward with 11-MUDA as our lead formulation as it displayed low cytotoxicity, no disruption of cytokine release, and high uptake in monocytes.
In vitro evaluation of 11-MUDA coated AuNP with primary monocytes
We first isolated primary monocytes from donor C57BL/6 mice. Others have shown the spleen to be a large reservoir of monocytes that are nearly identical in subtype and behavior to circulating blood monocytes.37 Purified monocytes isolated from the spleen of donor mice were examined with flow cytometry. Cells were incubated with cocktail of antibodies consisting of CD11b-PE Cy7, Ter119-PE, CD3-APCeF780, and CD19-PerCP Cy5.5. The enriched monocyte population contained 99.3% of CD11b+ (monocyte marker), CD19-(B-cell marker), CD3-(T-cell marker) cells in the suspension (Supporting Figure 2).
We examined these primary monocytes in a method similar to the immortalized monocyte cell line. The primary monocytes were treated with 11-MUDA AuNP and evaluated for cytotoxicity and cytokine release of TNF-α. Additionally, the uptake of AuNP was directly quantified using ICP-OES and compared to the uptake of the immortalized cell line. The results show that 11-MUDA AuNP treatments up to 1.0 mg/ml did not decrease cell viability of cultured primary monocytes (Figure 4A). Similarly, the uptake of 11-MUDA AuNP did not significantly alter the release of TNF-α after activation with LPS as seen in Figure 4B. In much the same way, the uptake of 11-MUDA AuNP did not significantly alter the release of TNF-α after activation with LPS as seen in Figure 4B. The TNF-α release for monocytes without LPS activation was found to be at similar low levels for non-treated and 11-MUDA treated cells (Supporting Figure 3). These results confirm that the primary monocytes were not activated during the isolation, culturing, and gold labeling procedures. Comparable results were found with the monocyte cell line, RAW 264.7. The quantified cell uptake of AuNP was comparable between the primary monocytes and the cell line. The uptake of AuNP in primary monocytes after 24 hours of 0.5 mg/ml 11-MUDA AuNP incubation was found to be 127 pg/cell (Figure 4C). These data demonstrated that the uptake of 11-MUDA AuNP did not impact the behavior of the primary monocytes during the ex-vivo labeling process.
Figure 4.

Mouse monocytes from the spleen were cultured and evaluated in vitro for (A) viability using LIVE/DEAD assay, (B) TNF-α release using ELISA, and (C) AuNP cell uptake using ICP-OES for primary monocytes compared to the cell line.
In vivo detection of gold labeled monocytes
Having established a method for labeling monocytes with AuNP without affecting cell viability or cytokine production, we proceeded to track the recruitment of these labeled monocytes in a mouse model of atherosclerosis via CT imaging. ApoE deficient mice were kept on a Western diet for 10 weeks to promote the development of aortic plaques. To track the recruitment of monocytes, primary monocytes were cultured and labeled ex-vivo with 11-MUDA AuNP a day before intravenous injection of these cells. The timeline of the experiment is shown in Figure 5. The mice were scanned with CT (Imtek, Inc, 80kVp, 500 μA) before I.V. injection and on days 3, 4, and 5 post-injection. The groups consisted of atherosclerotic mice receiving gold labeled monocytes (AtT), atherosclerotic mice receiving non-labeled monocytes (AtN) and wild-type mice receiving gold labeled monocytes (WdT).
Figure 5.

Experimental timeline for CT scanning of ex-vivo labeled monocytes injected I.V. into atherosclerotic mice.
Figure 6AB shows images of an atherosclerotic mouse that received AuNP labeled monocytes for day 0 and day 5 scans; attenuation was seen to increase in the aorta over time as compared to the day 0 scan. The AtT group (atherosclerotic mice receiving AuNP labeled monocytes) showed a continual increase in attenuation over time resulting in a final 15.3 HU difference on day 5 as compared to the pre-injection scan (Figure 6C). The increase for the AtN group (atherosclerotic mice receiving non-labeled monocytes) animals was much less. The WdT group (wild type mice receiving gold AuNP monocytes) attenuation values varied across acquisitions with no significant increase. Due to the heterogeneity of developing atherosclerosis, a linear mixed effects statistical model was used to account for disease variation among animals over time. Accounting for the attenuation values obtained each day (day 1 through 5) and random effects, we found a statistically significant increase in attenuation for the AtT group (p=0.002) of 15.3 HU. In comparison, the WdT (p=0.305) and the AtN (p=0.251) models showed no significant change in attenuation over time. This increase in attenuation in our AtT animals suggests that the recruitment of AuNP labeled monocytes can be detected by CT imaging. While the change in attenuation in the AtN group was not statistically significant, there may be small increases in the attenuation of the plaque during the 5 days of the experiment due to disease progression.
Figure 6.

CT scans of an atherosclerotic mouse injected with gold labeled monocytes (AtT) for (A) day 0 and (B) day 5. White boxes indicated aortic region of interest. Attenuation increases in the aorta over 5 days as compared to the pre-injection scan. (C) Graph plotting the average intensities in the aorta of mice in CT scans over time.
For an estimation of the number of gold labeled cells in the plaque, a standard curve of attenuation versus gold labeled cells per unit volume was generated. Primary monocytes were treated with 0.5 mg/ml of 11-MUDA AuNP for 24 hours and resuspended in an agarose gel at increasing concentrations. The cell concentrations were scanned with microCT scanner (Imtek Inc., 80 kVp, 500 μA) and quantified (Supporting Figure 4). Using this standard curve, the change in attenuation of 15.3 HU in the AtT treated group correlated to be approximately 15 gold labeled cells/voxel in the plaque. The true number of gold labeled cells in the plaque would vary depending on plaque size but we believe this to be a reasonable estimation.
Biodistribution of AuNP
At the end of the experiment, animals were sacrificed and organs excised for biodistribution. The gold content in the tissue was analyzed using ICP-OES to measure the distribution after 5 days post injection. Figure 7 shows high gold uptake in the spleen and liver, which are organs that typically host large numbers of monocytes and monocyte derived cells. Swirski et al., showed similarly high uptake of labeled monocytes in the spleen 5 days after intravenous injection.9
Figure 7.
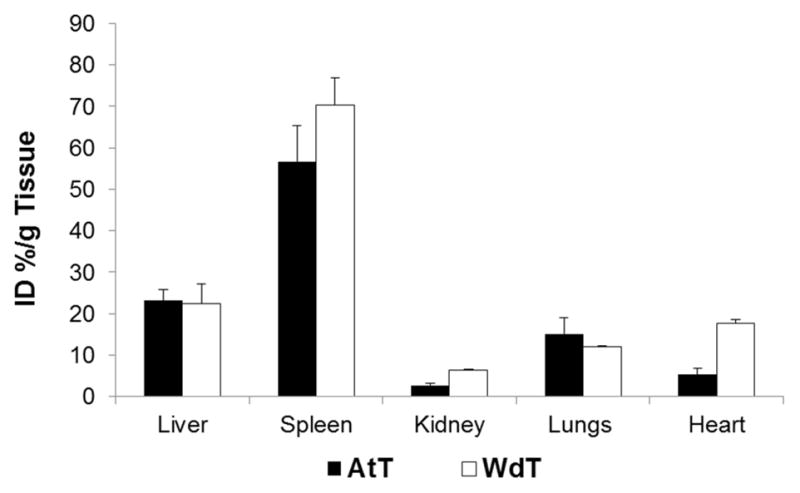
Gold content of tissue analyzed by ICP-OES at 5 days post injection of the atherosclerotic and wild type mice receiving AuNP labeled monocytes.
Ex-vivo analysis of atherosclerotic plaques
The aortas of AtT mice (received AuNP labeled monocytes) were sectioned through the atherosclerotic plaque and examined with TEM. AuNP were found in monocytes that were located in the atherosclerotic plaque (Figure 8). This indicates that the attenuation increase seen in the in vivo CT scans is due to recruitment of the AuNP labeled monocytes into the plaques.
Figure 8.

Excised aortas from atherosclerotic mice receiving AuNP labeled monocytes were sectioned through the plaque and examined with TEM for localization of gold nanoparticles.
Discussion
In this study, we demonstrate the successful labeling of monocytes with AuNP of varying formulations. Each ligand conferred a distinct combination of particle parameters including hydrodynamic diameter, surface potential and chemical functionality (Table 1). Formulations of 4-MB and 11-MUDA, which have similar diameters and negative surface potential, were found to have low cytotoxicity and the highest monocyte uptake.36 Previous reports have shown that anionic AuNP exhibit less toxicity as compared to cationic nanoparticles.38 The authors suggest that positively charged particles may directly diffuse through the plasma membrane, disrupting the lipid bilayer causing cytotoxicity. Additionally, our incubation of monocytes with AuNP occurs in media with serum. Studies have shown that the makeup of the protein corona surrounding the particle could be responsible for differences in cellular uptake.39–40 It is likely that 4-MB and 11-MUDA AuNP formulations form a protein corona preferential for cell uptake as compared to other our examined ligands. We found uptake of 127 pg Au/cell in our in vitro incubations performed with 0.5 mg Au/ml in the cell culture media. This is comparable to previous work since Menk et al. reported uptake of 33–36 pg Au/cell for incubations performed with 0.052 mg Au/ml, a ten-fold lower concentration than in our experiments, over a similar timeframe.14 Furthermore, others have loaded cells with iron oxide nanoparticles up to a weight of 39 pg Fe/cell. Adjusting for the differing densities of gold and iron oxide, this would be equivalent to 209.9 pg Au/cell.41–42
We found that the migration of these labeled monocytes to atherosclerotic plaques could be observed and measured with CT. We believe this is the first study to non-invasively track monocyte recruitment into atherosclerotic plaques using computed tomography. For plaque imaging, a number of targets have been previously studied with MRI, PET, SPECT, and NIRF. Researchers have successfully imaged cell-adhesion molecules, lipoproteins, ECM, proteases, and angiogenesis in plaques.43 Studies looking to image inflammatory cells primarily focus on macrophage presence in the plaque.44–46 Due to the insensitivity of contrast agents in CT, few imaging studies of plaque use x-ray computed tomography as the sole means of imaging. Researchers have previously demonstrated the in vivo detection of macrophages in atherosclerotic plaques with CT by using an iodinated agent,47 PEGylated nanoparticles48 and gold core lipoproteins.27–28 High macrophage content atherosclerotic plaque is a potential indicator of imminent risk of plaque rupture.49 In the present study, we sought to track the process of monocyte recruitment, which has been found to be informative of disease progression. A study by Robbins et al found that monocyte recruitment is a significant source of the macrophage population in early plaques while the macrophage populations in established are due to in-situ proliferation.50 Therefore, the detection of monocyte recruitment into the plaque could be an early marker for patients at risk of development of cardiovascular disease.
Our study presented here looks at the important process of monocyte recruitment in early stage atherosclerosis utilizing CT. This technique can improve the study of monocyte recruitment and help elucidate monocyte role in atherosclerosis progression and/or regression. Additionally, this technique may help assess new atherosclerotic interventions that target monocytes and plaque inflammation. However, CT sensitivity to contrast agents has been a significant obstacle in the further development of this method. The present study demonstrated increased intensity in the aorta (Δ 15.3 HU) as compared to pre-scan values. This attenuation change is on par with similar studies in the field. For instance, Hyafil et al. reported a change of 13.3 HU in the atherosclerotic plaques of rabbits intravenously injected with iodinated nanoparticles designed to target macrophages.47 Similarly, Eck et al., injected anti-CD4 gold nanoparticles intravenously to target lymph in-vivo and found an attenuation change of 20 HU at 1 hr and 25 HU at 48 hrs for 28 nm gold nanoparticles.51 However, for our study, an increase in sensitivity and overall attenuation change would be required to discern small reductions of monocyte uptake (e.g. <30%). A recent study by Betzer et al., presented the use of a “CT ruler” to approximate the number of gold labeled cells in a tissue non-invasively.52 However, the high attenuation required for this method was achieved by directly injecting the gold labeled cells at the site of interest. In our study, increasing the signal from our cells may be achieved by further optimizing the method. By increasing the number of injected gold label monocytes, we hypothesize a higher intensity in our scans is possible; however in this approach, injecting more monocytes than are physiologically present in the circulation may significantly alter the response of the animal to these cells. Instead, increasing the amount of gold per cell may be the ideal strategy to increase CT contrast in the images without increasing the number of injected cells. We are actively exploring larger gold nanoparticle sizes and additional ligands that may provide higher uptake in monocytes. Studies have suggested that 50 nm gold nanoparticles may be the optimal uptake size for HeLa cells, so we are currently investigating this whether this is true in monocytes.53–54 Additionally, translation of nanoparticle-facilitated cell tracking to clinical scanners would be beneficial, due to the lower image noise in clinical scanners as compared with preclinical scanners.55 Lower image noise improves signal-to-noise ratios and hence improves sensitivity.
An alternative solution to achieve higher intensities may be to purify the monocyte subtype further. In the current study, monocytes are isolated by the expression of CD11b marker, a conserved monocytes marker across many subtypes.56 In mice, the “inflammatory” Ly6CHi monocyte subtype has been described as the dominant subtype for migration in early atherosclerotic plaques as compared to the “resident” monocyte, Ly6CLo.57–58 Hence, we may improve the overall recruitment of our gold labeled monocytes by further purifying our isolated monocytes for CD11b+, Ly6CHi subtype in future studies.
In this cell tracking study, isolated monocytes are labeled ex-vivo before injection as opposed to labeling in-situ. The emergence of adoptive cell therapies as successful clinical therapies reinforces the need for methods of cell tracking ex-vivo cultured cells.59 Cell tracking using ex-vivo labeled cells with CT has been demonstrated with a number of applications including T-cell labeling for cancer, C6 glioma cells for brain tumor models, olfactory ensheathing cells for spinal compression injury models and pancreatic islets labeling for diabetes.14, 60–64 In-situ labeling, where nanoparticles are injected into animals and cells take up the nanoparticles in vivo, is more straightforward and simpler to implement clinically.65–66 However, in-situ labeling may result in labeling a variety of cells, such as macrophages and monocytes resident within the plaque, as well as circulating monocytes, confounding results from imaging. In the future, we will explore ways to adapt our current approach for in-situ labeling and compare the results.
Conclusion
In this study, we screened AuNP formulations for effective uptake in monocytes without disruption of viability or inflammatory function. We identified a lead formulation with these characteristics, which was confirmed with primary monocytes. These labeled monocytes were intravenously injected and monitored for recruitment into atherosclerotic plaques using x-ray computed tomography. We found an increase in the attenuation in the aorta, post injection of these labeled cells. We confirmed the presence of these labeled monocytes in the plaque through the use of TEM. This study demonstrates the feasibility of tracking labeled monocytes with CT. Further studies are required to optimize the detection of these cells for quantification of monocyte accumulation in the plaque. Increased sensitivity will allow for examination of monocyte recruitment in the presence of emerging atherosclerosis therapies.
Materials and Methods
Materials
All chemicals were of analytical grade and were purchased from Sigma Aldrich (St. Louis, MO). A monocyte cell line, RAW 264.7, was purchased from ATCC (Manassas, VA). Dubecco’s Modified Eagle Medium (DMEM) and RPMI-1640 supplemented with 10% fetal bovine serum and 1% penicillin/streptomycin (10000 units/Ml, 10000 μg/mL) were purchased from Cellgro, Corning (Manassas, VA). LIVE/DEAD assay and ELISA kits were purchased from Life Technologies Invitrogen (Grand Island, NY). All mice were acquired from Jackson Laboratory, Bar Harbor, ME.
Gold synthesis
Citrate capped gold nanoparticles were synthesized using the Turkevich method.29 Briefly, 85 mg of gold(III) chloride hydrate was dissolved in 250 mL of ultrapure water (Milli-Q, EMD Millipore, Billerica MA). The gold solution was heated to a boil. 25 mL of a 38.8 mM sodium citrate solution was then added, producing citrate coated gold nanoparticles. The solution was refluxed for 15 minutes and allowed to cool to room temperature. For ligand exchange, capping ligands were added to the solution for a final concentration of 0.047 mM in the gold solution. For instance, 2.6 mg of 11-mercaptoundecanoic acid (MW 218.36) was dissolved in 1 ml of ethanol and added into the gold solution to stir overnight. The full library of ligands examined can be found in Supporting Information Figure 1. After exchange, the particles were spun at 8.5 krcf for 3 hours to pellet the particles. The pellets were collected into 1.5 ml micro-centrifuge tubes and washed twice with ultrapure water by centrifuging at 8.5 krcf for 45 minutes. The AuNP were then filtered through a 0.45 μm syringe filter (EMD Millipore, Billerica MA) in a biosafety cabinet for sterilization.
Particle characterization
For electron microscopy, AuNP samples were drop casted onto Formvar carbon copper grids with 200 mesh (Electron Microscopy Sciences, Hatfield, PA). Samples were exposed to air for 30 mins and excess solution was blotted away with filter paper. The grids were viewed with an FEI Tecnai T12 electron microscope at 120 kV. Dynamic light scattering and zeta potential analysis was performed with a Nano ZS-90 Zetasizer. Stability was tested by diluting 10 μL sample of AuNP into 1 mL of DPBS and 1 mL of cell media.
In vitro viability assessment
The interaction of stable AuNP formulations with monocytes was evaluated using RAW 264.7 and isolated primary monocytes. The LIVE/DEAD assay was used to assess cytotoxicity. Briefly, RAW 264.7 cells were cultured in 20 mm diameter glass bottom dishes at 7.0 × 10⁵ cells per well with DMEM supplemented with 10% FBS and 1% streptomycin/penicillin (PS). After 24 hours of incubation, monocytes were treated with AuNP formulations for an additional 24 hours. After treatment, cells were washed 2x with DPBS and incubated with 400 μL of LIVE/DEAD cocktail (2 ml DPBS, 2 μL stock Ethidium-1 homodimer, 0.5 μL stock Calcein AM and 0.5 μL 3.2 mM Hoechst 33342). Primary isolated monocytes were prepared similarly but cultured using RPMI-1640 supplemented with 10% FBS and 1% PS. Cells were imaged with Nikon Eclipse Ti-U fluorescence microscope using DAPI (Ex: 359, Em: 461 nm), FITC (Ex: 495, Em: 519 nm), and Texas Red (Ex: 595, Em: 613 nm) filters. Four images were taken per well for each channel. A custom MATLAB (MathWorks, Natick, MA) program was used to count the number of cells for the Hoechst, Ethidium-1 homodimer, and Calcein AM stain for each sample. The ratio of living cells to total number of cells was used to determine the viability percentage.
In vitro cytokine expression
Monocyte cytokine expression of TNF-α and IL-6 was evaluated using an ELISA kit from Life Technologies, (Frederick, MD). First, monocytes were cultured in 96 well plates at 1.0 × 10⁵ cells per well for 24 hours. Immortalized monocytes were then treated with 0.5 mg/ml of various AuNP formulations for 24 hours (note: all nanoparticle concentrations are given as mg/ml of gold). Primary monocytes were treated with concentrations of 0.1, 0.25, and 0.5 mg/ml of 11-MUDA AuNP. The cells were then washed twice with DPBS to remove remaining free AuNP. Afterwards cell media in each well was replaced with 100 μL of cell media containing 100 ng/mL of lipopolysaccharides (LPS) for 3 hours or replaced with new media for non-activated samples. The media was then collected for use in the ELISA, which was performed according to kit instructions.
Cell uptake evaluation
The uptake of AuNP was measured using both a direct method (analytical determination of gold content) and an indirect method (CT imaging of cell pellets). For both methods, cells were cultured onto 6-well plates at 2.0 × 10⁶ cells per well for 24 hours. The cells were treated with varying concentrations of AuNP formulations for 24 hours. The cells were then washed twice with DPBS and collected. For direct measurements, the cells were dissolved in aqua regia (3 parts hydrochloric acid, 1 part nitric acid) for 15 mins. The gold content of these samples were measured using inductively coupled plasma-optical emission spectroscopy (ICP-OES) on a Spectro Genesis ICP (SPECTRO Analytical Instruments GmbH, Boschstr, Germany). Gold content was normalized by the number of cells in each sample to express the value as gold per cell.
For CT measurements, after AuNP treatment, the cells were collected and fixed in 4% paraformaldehyde. The cells were allowed to loosely settle and then scanned using a clinical CT scanner (Siemens Definition DS 64-slice) at 100 kVp, 440 mA, 512×512 matrix, 37×37 cm FoV, a slice thickness of 0.6 cm and reconstructed using kernel B30f. Intensities in the scan were measured in 3 sequential sections using ROI measurements and averaged for an intensity measurement using OsiriX v.3.7.1 64-bit software.
Primary monocyte cell dispersion scans
Primary monocytes were cultured for 24 hours after isolation and then subsequently treated with 0.5 mg/ml of 11-MUDA AuNP. After 24 hours, the cells were washed x2 with DPBS and resuspended into increasing concentrations of 0, 100 k, 250 k, 500 k, 1.0 M, 2.5 M, and 5.0 M cells/ml in 100 μl of DPBS and then 100 μl of 1% agarose. The agarose was heated prior to addition and then cooled on ice for 15 minutes. The suspensions were then scanned with microCT scanner (Imtek Inc, 80 kVP, 500 μA). The scans were quantified using OsiriX v3.7.1 with 64-bit software.
Transmission electron microscopy of tissue
RAW 264.7 cells and aorta samples from treated ApoE−/− mice were prepared for TEM imaging using standard preparation techniques.67 Cells and tissue were fixed in 2% PFA and 2.5% glutaraldehyde before staining and embedding. Samples were cut into 60 nm thick sections and mounted onto grids before viewing with a JEOL 1010 Electron Microscope at 80 kV.
Primary monocyte isolation
Spleens from C57BL/6 donor mice were used as the source for primary monocytes. Mice were anesthetized with isoflurane and then euthanized. The chest cavity was opened and mice were perfused through the left ventricle with 10 mL of DPBS before removal of the spleen. After excision, the spleen was mechanically homogenized using the plunger of a 1 mL syringe in 1 mL of Hank’s balanced salt solution (HBSS). The resulting cell slurry was filtered through a 70 μm filter and spun at 250 rcf for 5 mins to pellet the cells. The pellet was then re-suspended in 250 μL of RBC lysis buffer for 1 min on ice. Afterwards, HBSS supplemented with 0.6% bovine serum albumin (BSA) and 0.3 mM EDTA was added to the cells for a total volume of 10 mL. The cell solution was centrifuged at 250 rcf for 5 mins and re-suspended with HBSS+ BSA. This step was repeated twice. The cell suspension was then incubated with anti-CD11b magnetic microbeads (Mitlenyi Biotech, 140-049-601) for 30 mins at 4°C. After incubation, the suspension was washed with eluting buffer (DPBS, 0.5% BSA, 2mM EDTA). The cell suspension was then passed through a LS separation column (Miltenyi Biotech, 130-042-401) in the presence of a strong magnet to retain only CD11b+ cells in the column. Afterwards, the column is removed from the magnet and 5 mL of eluting buffer is used to remove the cells from the column. The cells were eluted through two sequential LS columns for increased purity. The resulting solution was spun at 250 rcf for 5 mins and re-suspended with RPMI medium 1640 supplemented with 10% FBS and 1% penicillin/streptomycin for cell culture.
Flow cytometry
The purity of the resulting cell suspension was analyzed using flow cytometry. Cells were incubated with Fc blocking agent for 15 minutes. After blocking, cells were incubated with markers for CD11b-PE Cy7, Ter119-PE, CD3-APCeF780, CD19-PerCP Cy5.5 for 30 mins on ice. Flow cytometry were performed on a BD FACSCanto System (BD Sciences, San Jose, CA). Fluorescence minus one solutions and compensation beads for each fluorophore were used for controls.
Animals
Six week old male apolipoprotein E (ApoE) deficient mice (B6.129P2-ApoEtm1UnC/J) were fed western chow diet (Research Diets Inc, New Brunswick, NJ) for 10 weeks to establish early atherosclerosis before use. Age-matched male C57BL/6 were kept on regular chow diet for the duration of the experiment as controls. All experimental protocols were approved by University Laboratory Animal Resources in conjunction with the Institutional Animal Care and Use Committee at University of Pennsylvania.
In vivo monocyte imaging
The treated group (AtT, n=8) received AuNP labeled monocytes following the procedure below. Briefly, primary monocytes isolated through magnetic sorting as described above were cultured for 24 hours before gold labeling. The cells were then treated with 0.5 mg/ml of 11-MUDA AuNP for an additional 24 hours. The cells were washed twice with DPBS and collected. After resuspension in 250 μl of DPBS, 1.0 × 10⁶ cells were injected intravenously into the ApoE deficient mouse model. The animals were scanned with a microCT II scanner (Imtek Inc, 80 kVp, 500 μA, 512×512 matrix, 100 μm slice thickness) pre-injection and on day 3, 4, and 5 post-injection. Wild type mice receiving gold labeled monocytes following a similar procedure were used as controls (WdT, n=9). Additionally, atherosclerotic mice receiving non labeled monocytes were also used as a control group (AtN, n=8). CT scans were analyzed using OsiriX software. For aorta measurements, 3 sequential ROI were measured in the ascending aorta and averaged for a final attenuation value. The location of the aorta was identified by comparing the CT images with scans from a separate mouse experiment using a CT blood pool contrast agent. Identical ROI were used for each day for each mouse. The image sets from different days were matched for each animal using the spine and ribcage as markers.
Ex-vivo and biodistribution
After the final scan, mice were euthanized and dissected for biodistribution. Tissue including the heart, lungs, spleen, kidney, and liver were fixed in 4% PFA after excision. For biodistribution, tissue was dissolved in 500 μL of HNO3 for 18 hours at 60°C. Afterwards, 300 μL of HCl was added and incubated at 60°C for an addit ional hour. The resulting solution was spun at 300 rcf for 10 mins for remove cell debris. The samples were analyzed using ICP-OES for measurement of gold content.
Statistics
Statistical analysis was performed with guidance from the Center for Clinical Epidemiology and Biostatistics at the University of Pennsylvania. A linear mixed effect model was used to analyze intensities from in vivo scans. Each mouse was assumed to have a unique intercept and inputted into the model as a random effect to control for baseline differences between mice. Attenuation measurements were used as the dependent variable and each day as the independent variable in the model. Analysis was performed using Stata 13.1 (64-bit, College Station TX).
Supplementary Material
Acknowledgments
This work was supported by R00 EB012165 (D.P.C.), T32 HL007954 (P.C.) and the W. W. Smith Charitable Trust. The project described was supported in part by the Institute for Translational Medicine and Therapeutics (ITMAT) Transdisciplinary Program in Translational Medicine and Therapeutics (Grant Number UL1RR024134 from the National Center for Research Resources. The content is solely the responsibility of the authors and does not necessarily represent the official views of the National Center for Research Resources or the National Institutes of Health). We also thank the University of Pennsylvania for startup funding.
Footnotes
Publisher's Disclaimer: This is a PDF file of an unedited manuscript that has been accepted for publication. As a service to our customers we are providing this early version of the manuscript. The manuscript will undergo copyediting, typesetting, and review of the resulting proof before it is published in its final citable form. Please note that during the production process errors may be discovered which could affect the content, and all legal disclaimers that apply to the journal pertain.
References
- 1.Mozaffarian D, Benjamin EJ, Go AS, Arnett DK, Blaha MJ, Cushman M, de Ferranti S, Despres J, Fullerton HJ, Howard VJ, Huffman MD, Judd SE, Kissela BM, Lackland DT, Lichtman JH, Lisabeth LD, Liu S, Mackey RH, Matchar DB, McGuire DK, Mohler ER, 3rd, Moy CS, Muntner P, Mussolino ME, Nasir K, Neumar RW, Nichol G, Palaniappan L, Pandey DK, Reeves MJ, Rodriguez CJ, Sorlie PD, Stein J, Towfighi A, Turan TN, Virani SS, Willey JZ, Woo D, Yeh RW, Turner MB. Heart Disease and Stroke Statistics-2015 Update: A Report From the American Heart Association. Circulation. 2014 doi: 10.1161/CIR.0000000000000152. [DOI] [PubMed] [Google Scholar]
- 2.Libby P, Ridker PM, Maseri A. Inflammation and atherosclerosis. Circulation. 2002;105(9):1135–43. doi: 10.1161/hc0902.104353. [DOI] [PubMed] [Google Scholar]
- 3.Libby P. Inflammation in atherosclerosis. Nature. 2002;420(6917):868–74. doi: 10.1038/nature01323. [DOI] [PubMed] [Google Scholar]
- 4.Moreno PR, Falk E, Palacios IF, Newell JB, Fuster V, Fallon JT. Macrophage infiltration in acute coronary syndromes. Implications for plaque rupture. Circulation. 1994;90(2):775–8. doi: 10.1161/01.cir.90.2.775. [DOI] [PubMed] [Google Scholar]
- 5.Ley K, Miller YI, Hedrick CC. Monocyte and macrophage dynamics during atherogenesis. Arterioscler Thromb Vasc Biol. 2011;31(7):1506–16. doi: 10.1161/ATVBAHA.110.221127. [DOI] [PMC free article] [PubMed] [Google Scholar]
- 6.Boisvert WA, Rose DM, Johnson KA, Fuentes ME, Lira SA, Curtiss LK, Terkeltaub RA. Up-regulated expression of the CXCR2 ligand KC/GRO-alpha in atherosclerotic lesions plays a central role in macrophage accumulation and lesion progression. Am J Pathol. 2006;168(4):1385–95. doi: 10.2353/ajpath.2006.040748. [DOI] [PMC free article] [PubMed] [Google Scholar]
- 7.Boring L, Gosling J, Cleary M, Charo IF. Decreased lesion formation in CCR2−/− mice reveals a role for chemokines in the initiation of atherosclerosis. Nature. 1998;394(6696):894–7. doi: 10.1038/29788. [DOI] [PubMed] [Google Scholar]
- 8.Combadiere C, Potteaux S, Rodero M, Simon T, Pezard A, Esposito B, Merval R, Proudfoot A, Tedgui A, Mallat Z. Combined inhibition of CCL2, CX3CR1, and CCR5 abrogates Ly6C(hi) and Ly6C(lo) monocytosis and almost abolishes atherosclerosis in hypercholesterolemic mice. Circulation. 2008;117(13):1649–57. doi: 10.1161/CIRCULATIONAHA.107.745091. [DOI] [PubMed] [Google Scholar]
- 9.Swirski FK, Pittet MJ, Kircher MF, Aikawa E, Jaffer FA, Libby P, Weissleder R. Monocyte accumulation in mouse atherogenesis is progressive and proportional to extent of disease. Proc Natl Acad Sci U S A. 2006;103(27):10340–5. doi: 10.1073/pnas.0604260103. [DOI] [PMC free article] [PubMed] [Google Scholar]
- 10.Fayad ZA, Mani V, Woodward M, Kallend D, Abt M, Burgess T, Fuster V, Ballantyne CM, Stein EA, Tardif JC, Rudd JH, Farkouh ME, Tawakol A dal PI. Safety and efficacy of dalcetrapib on atherosclerotic disease using novel non-invasive multimodality imaging (dal-PLAQUE): a randomised clinical trial. Lancet. 2011;378(9802):1547–59. doi: 10.1016/S0140-6736(11)61383-4. [DOI] [PMC free article] [PubMed] [Google Scholar]
- 11.Mowatt G, Cummins E, Waugh N, Walker S, Cook J, Jia X, Hillis GS, Fraser C. Systematic review of the clinical effectiveness and cost-effectiveness of 64-slice or higher computed tomography angiography as an alternative to invasive coronary angiography in the investigation of coronary artery disease. Health Technol Assess. 2008;12(17):iii–iv. ix–143. doi: 10.3310/hta12170. [DOI] [PubMed] [Google Scholar]
- 12.Sandfort V, Lima JA, Bluemke DA. Noninvasive Imaging of Atherosclerotic Plaque Progression: Status of Coronary Computed Tomography Angiography. Circ Cardiovasc Imaging. 2015;8(7) doi: 10.1161/CIRCIMAGING.115.003316. [DOI] [PMC free article] [PubMed] [Google Scholar]
- 13.Astolfo A, Schultke E, Menk RH, Kirch RD, Juurlink BH, Hall C, Harsan LA, Stebel M, Barbetta D, Tromba G, Arfelli F. In vivo visualization of gold-loaded cells in mice using x-ray computed tomography. Nanomedicine. 2013;9(2):284–92. doi: 10.1016/j.nano.2012.06.004. [DOI] [PubMed] [Google Scholar]
- 14.Menk RH, Schultke E, Hall C, Arfelli F, Astolfo A, Rigon L, Round A, Ataelmannan K, MacDonald SR, Juurlink BH. Gold nanoparticle labeling of cells is a sensitive method to investigate cell distribution and migration in animal models of human disease. Nanomedicine. 2011;7(5):647–54. doi: 10.1016/j.nano.2011.01.010. [DOI] [PubMed] [Google Scholar]
- 15.Astolfo A, Arfelli F, Schultke E, James S, Mancini L, Menk RH. A detailed study of gold-nanoparticle loaded cells using X-ray based techniques for cell-tracking applications with single-cell sensitivity. Nanoscale. 2013;5(8):3337–45. doi: 10.1039/c3nr34089a. [DOI] [PubMed] [Google Scholar]
- 16.Schultke E, Menk R, Pinzer B, Astolfo A, Stampanoni M, Arfelli F, Harsan LA, Nikkhah G. Single-cell resolution in high-resolution synchrotron X-ray CT imaging with gold nanoparticles. Journal of synchrotron radiation. 2014;21(Pt 1):242–50. doi: 10.1107/S1600577513029007. [DOI] [PubMed] [Google Scholar]
- 17.Kircher MF, Grimm J, Swirski FK, Libby P, Gerszten RE, Allport JR, Weissleder R. Noninvasive in vivo imaging of monocyte trafficking to atherosclerotic lesions. Circulation. 2008;117(3):388–95. doi: 10.1161/CIRCULATIONAHA.107.719765. [DOI] [PMC free article] [PubMed] [Google Scholar]
- 18.Ye YX, Basse-Lusebrink TC, Arias-Loza PA, Kocoski V, Kampf T, Gan Q, Bauer E, Sparka S, Helluy X, Hu K, Hiller KH, Boivin-Jahns V, Jakob PM, Jahns R, Bauer WR. Monitoring of monocyte recruitment in reperfused myocardial infarction with intramyocardial hemorrhage and microvascular obstruction by combined fluorine 19 and proton cardiac magnetic resonance imaging. Circulation. 2013;128(17):1878–88. doi: 10.1161/CIRCULATIONAHA.113.000731. [DOI] [PubMed] [Google Scholar]
- 19.Ishida M, Sakuma H. Magnetic resonance of coronary arteries: assessment of luminal narrowing and blood flow in the coronary arteries. J Thorac Imaging. 2014;29(3):155–62. doi: 10.1097/RTI.0000000000000081. [DOI] [PubMed] [Google Scholar]
- 20.Mieszawska AJ, Mulder WJ, Fayad ZA, Cormode DP. Multifunctional gold nanoparticles for diagnosis and therapy of disease. Mol Pharm. 2013;10(3):831–47. doi: 10.1021/mp3005885. [DOI] [PMC free article] [PubMed] [Google Scholar]
- 21.Simpson CA, Agrawal AC, Balinski A, Harkness KM, Cliffel DE. Short-chain PEG mixed monolayer protected gold clusters increase clearance and red blood cell counts. ACS nano. 2011;5(5):3577–84. doi: 10.1021/nn103148x. [DOI] [PMC free article] [PubMed] [Google Scholar]
- 22.Galper MW, Saung MT, Fuster V, Roessl E, Thran A, Proksa R, Fayad ZA, Cormode DP. Effect of computed tomography scanning parameters on gold nanoparticle and iodine contrast. Invest Radiol. 2012;47(8):475–81. doi: 10.1097/RLI.0b013e3182562ab9. [DOI] [PMC free article] [PubMed] [Google Scholar]
- 23.Naha PC, Chhour P, Cormode DP. Systematic in vitro toxicological screening of gold nanoparticles designed for nanomedicine applications. Toxicol In Vitro. 2015;29(7):1445–1453. doi: 10.1016/j.tiv.2015.05.022. [DOI] [PMC free article] [PubMed] [Google Scholar]
- 24.Cormode DP, Naha PC, Fayad ZA. Nanoparticle contrast agents for computed tomography: a focus on micelles. Contrast Media Mol Imaging. 2014;9(1):37–52. doi: 10.1002/cmmi.1551. [DOI] [PMC free article] [PubMed] [Google Scholar]
- 25.Au JT, Craig G, Longo V, Zanzonico P, Mason M, Fong Y, Allen PJ. Gold nanoparticles provide bright long-lasting vascular contrast for CT imaging. AJR Am J Roentgenol. 2013;200(6):1347–51. doi: 10.2214/AJR.12.8933. [DOI] [PubMed] [Google Scholar]
- 26.Cai QY, Kim SH, Choi KS, Kim SY, Byun SJ, Kim KW, Park SH, Juhng SK, Yoon KH. Colloidal gold nanoparticles as a blood-pool contrast agent for X-ray computed tomography in mice. Invest Radiol. 2007;42(12):797–806. doi: 10.1097/RLI.0b013e31811ecdcd. [DOI] [PubMed] [Google Scholar]
- 27.Cormode DP, Roessl E, Thran A, Skajaa T, Gordon RE, Schlomka JP, Fuster V, Fisher EA, Mulder WJ, Proksa R, Fayad ZA. Atherosclerotic plaque composition: analysis with multicolor CT and targeted gold nanoparticles. Radiology. 2010;256(3):774–82. doi: 10.1148/radiol.10092473. [DOI] [PMC free article] [PubMed] [Google Scholar]
- 28.Cormode DP, Skajaa T, van Schooneveld MM, Koole R, Jarzyna P, Lobatto ME, Calcagno C, Barazza A, Gordon RE, Zanzonico P, Fisher EA, Fayad ZA, Mulder WJ. Nanocrystal core high-density lipoproteins: a multimodality contrast agent platform. Nano Lett. 2008;8(11):3715–23. doi: 10.1021/nl801958b. [DOI] [PMC free article] [PubMed] [Google Scholar]
- 29.Turkevich J, Stevenson P, Hillier J. A study of the nucleation and growth processes in the synthesis of colloidal gold. Discuss Faraday Soc. 1951;11:55–75. [Google Scholar]
- 30.Moghimi SM, Symonds P, Murray JC, Hunter AC, Debska G, Szewczyk A. A two-stage poly(ethylenimine)-mediated cytotoxicity: implications for gene transfer/therapy. Mol Ther. 2005;11(6):990–5. doi: 10.1016/j.ymthe.2005.02.010. [DOI] [PubMed] [Google Scholar]
- 31.Ghattas A, Griffiths HR, Devitt A, Lip GY, Shantsila E. Monocytes in coronary artery disease and atherosclerosis: where are we now? J Am Coll Cardiol. 2013;62(17):1541–51. doi: 10.1016/j.jacc.2013.07.043. [DOI] [PubMed] [Google Scholar]
- 32.Dreaden EC, Austin LA, Mackey MA, El-Sayed MA. Size matters: gold nanoparticles in targeted cancer drug delivery. Ther Deliv. 2012;3(4):457–78. doi: 10.4155/tde.12.21. [DOI] [PMC free article] [PubMed] [Google Scholar]
- 33.Ma X, Wu Y, Jin S, Tian Y, Zhang X, Zhao Y, Yu L, Liang XJ. Gold nanoparticles induce autophagosome accumulation through size-dependent nanoparticle uptake and lysosome impairment. ACS nano. 2011;5(11):8629–39. doi: 10.1021/nn202155y. [DOI] [PubMed] [Google Scholar]
- 34.Juurlink BH, Devon RM. Colloidal gold as a permanent marker of cells. Experientia. 1991;47(1):75–7. doi: 10.1007/BF02041258. [DOI] [PubMed] [Google Scholar]
- 35.Jokerst JV, Lobovkina T, Zare RN, Gambhir SS. Nanoparticle PEGylation for imaging and therapy. Nanomedicine (Lond) 2011;6(4):715–28. doi: 10.2217/nnm.11.19. [DOI] [PMC free article] [PubMed] [Google Scholar]
- 36.Giljohann DA, Seferos DS, Patel PC, Millstone JE, Rosi NL, Mirkin CA. Oligonucleotide loading determines cellular uptake of DNA-modified gold nanoparticles. Nano Lett. 2007;7(12):3818–21. doi: 10.1021/nl072471q. [DOI] [PMC free article] [PubMed] [Google Scholar]
- 37.Swirski FK, Nahrendorf M, Etzrodt M, Wildgruber M, Cortez-Retamozo V, Panizzi P, Figueiredo JL, Kohler RH, Chudnovskiy A, Waterman P, Aikawa E, Mempel TR, Libby P, Weissleder R, Pittet MJ. Identification of splenic reservoir monocytes and their deployment to inflammatory sites. Science. 2009;325(5940):612–6. doi: 10.1126/science.1175202. [DOI] [PMC free article] [PubMed] [Google Scholar]
- 38.Goodman CM, McCusker CD, Yilmaz T, Rotello VM. Toxicity of gold nanoparticles functionalized with cationic and anionic side chains. Bioconjug Chem. 2004;15(4):897–900. doi: 10.1021/bc049951i. [DOI] [PubMed] [Google Scholar]
- 39.Ritz S, Schottler S, Kotman N, Baier G, Musyanovych A, Kuharev J, Landfester K, Schild H, Jahn O, Tenzer S, Mailander V. Protein corona of nanoparticles: distinct proteins regulate the cellular uptake. Biomacromolecules. 2015;16(4):1311–21. doi: 10.1021/acs.biomac.5b00108. [DOI] [PubMed] [Google Scholar]
- 40.Chithrani BD, Chan WC. Elucidating the mechanism of cellular uptake and removal of protein-coated gold nanoparticles of different sizes and shapes. Nano Lett. 2007;7(6):1542–50. doi: 10.1021/nl070363y. [DOI] [PubMed] [Google Scholar]
- 41.Bohmer N, Jordan A. Caveolin-1 and CDC42 mediated endocytosis of silica-coated iron oxide nanoparticles in HeLa cells. Beilstein journal of nanotechnology. 2015;6:167–76. doi: 10.3762/bjnano.6.16. [DOI] [PMC free article] [PubMed] [Google Scholar]
- 42.Wuerfel E, Smyth M, Millward JM, Schellenberger E, Glumm J, Prozorovski T, Aktas O, Schulze-Topphoff U, Schnorr J, Wagner S, Taupitz M, Infante-Duarte C, Wuerfel J. Electrostatically Stabilized Magnetic Nanoparticles - An Optimized Protocol to Label Murine T Cells for in vivo MRI. Front Neurol. 2011;2:72. doi: 10.3389/fneur.2011.00072. [DOI] [PMC free article] [PubMed] [Google Scholar]
- 43.Choudhury RP, Fuster V, Fayad ZA. Molecular, cellular and functional imaging of atherothrombosis. Nature reviews Drug discovery. 2004;3(11):913–25. doi: 10.1038/nrd1548. [DOI] [PubMed] [Google Scholar]
- 44.Mulder WJM, Strijkers GJ, Briley-Saboe KC, Frias JC, Aguinaldo JGS, Vucic E, Amirbekian V, Tang C, Chin PTK, Nicolay K, Fayad ZA. Molecular imaging of macrophages in antherosclerotic plaques using bimodal PEG-micelles. Magn Reson Med. 2007;58(6):1164–1170. doi: 10.1002/mrm.21315. [DOI] [PubMed] [Google Scholar]
- 45.Amirbekian V, Lipinski MJ, Briley-Saebo KC, Amirbekian S, Aguinaldo JGS, Weinreb DB, Vucic E, Frias JC, Hyafil F, Mani V, Fisher EA, Fayad ZA. Detecting and assessing macrophages in vivo to evaluate atherosclerosis noninvasively using molecular MRI. Proc Natl Acad Sci U S A. 2007;104(3):961–966. doi: 10.1073/pnas.0606281104. [DOI] [PMC free article] [PubMed] [Google Scholar]
- 46.Hyafil F, Laissy JP, Mazighi M, Tchetche D, Louedec L, Adle-Biassette H, Chillon S, Henin D, Jacob MP, Letourneur D, Feldman LJ. Ferumoxtran-10-enhanced MRI of the hypercholesterolemic rabbit aorta: relationship between signal loss and macrophage infiltration. Arterioscler Thromb Vasc Biol. 2006;26(1):176–81. doi: 10.1161/01.ATV.0000194098.82677.57. [DOI] [PubMed] [Google Scholar]
- 47.Hyafil F, Cornily JC, Feig JE, Gordon R, Vucic E, Amirbekian V, Fisher EA, Fuster V, Feldman LJ, Fayad ZA. Noninvasive detection of macrophages using a nanoparticulate contrast agent for computed tomography. Nat Med. 2007;13(5):636–41. doi: 10.1038/nm1571. [DOI] [PubMed] [Google Scholar]
- 48.Qin J, Peng C, Zhao B, Ye K, Yuan F, Peng Z, Yang X, Huang L, Jiang M, Zhao Q, Tang G, Lu X. Noninvasive detection of macrophages in atherosclerotic lesions by computed tomography enhanced with PEGylated gold nanoparticles. International journal of nanomedicine. 2014;9:5575–90. doi: 10.2147/IJN.S72819. [DOI] [PMC free article] [PubMed] [Google Scholar]
- 49.Naghavi M, Libby P, Falk E, Casscells SW, Litovsky S, Rumberger J, Badimon JJ, Stefanadis C, Moreno P, Pasterkamp G, Fayad Z, Stone PH, Waxman S, Raggi P, Madjid M, Zarrabi A, Burke A, Yuan C, Fitzgerald PJ, Siscovick DS, de Korte CL, Aikawa M, Juhani Airaksinen KE, Assmann G, Becker CR, Chesebro JH, Farb A, Galis ZS, Jackson C, Jang IK, Koenig W, Lodder RA, March K, Demirovic J, Navab M, Priori SG, Rekhter MD, Bahr R, Grundy SM, Mehran R, Colombo A, Boerwinkle E, Ballantyne C, Insull W, Jr, Schwartz RS, Vogel R, Serruys PW, Hansson GK, Faxon DP, Kaul S, Drexler H, Greenland P, Muller JE, Virmani R, Ridker PM, Zipes DP, Shah PK, Willerson JT. From vulnerable plaque to vulnerable patient: a call for new definitions and risk assessment strategies: Part I. Circulation. 2003;108(14):1664–72. doi: 10.1161/01.CIR.0000087480.94275.97. [DOI] [PubMed] [Google Scholar]
- 50.Robbins CS, Hilgendorf I, Weber GF, Theurl I, Iwamoto Y, Figueiredo JL, Gorbatov R, Sukhova GK, Gerhardt LM, Smyth D, Zavitz CC, Shikatani EA, Parsons M, van Rooijen N, Lin HY, Husain M, Libby P, Nahrendorf M, Weissleder R, Swirski FK. Local proliferation dominates lesional macrophage accumulation in atherosclerosis. Nat Med. 2013;19(9):1166–72. doi: 10.1038/nm.3258. [DOI] [PMC free article] [PubMed] [Google Scholar]
- 51.Eck W, Nicholson AI, Zentgraf H, Semmler W, Bartling S. Anti-CD4-targeted gold nanoparticles induce specific contrast enhancement of peripheral lymph nodes in X-ray computed tomography of live mice. Nano Lett. 2010;10(7):2318–22. doi: 10.1021/nl101019s. [DOI] [PubMed] [Google Scholar]
- 52.Betzer O, Shwartz A, Motiei M, Kazimirsky G, Gispan I, Damti E, Brodie C, Yadid G, Popovtzer R. Nanoparticle-based CT imaging technique for longitudinal and quantitative stem cell tracking within the brain: application in neuropsychiatric disorders. ACS nano. 2014;8(9):9274–85. doi: 10.1021/nn503131h. [DOI] [PubMed] [Google Scholar]
- 53.Chithrani BD, Ghazani AA, Chan WC. Determining the size and shape dependence of gold nanoparticle uptake into mammalian cells. Nano Lett. 2006;6(4):662–8. doi: 10.1021/nl052396o. [DOI] [PubMed] [Google Scholar]
- 54.Pan Y, Neuss S, Leifert A, Fischler M, Wen F, Simon U, Schmid G, Brandau W, Jahnen-Dechent W. Size-dependent cytotoxicity of gold nanoparticles. Small. 2007;3(11):1941–9. doi: 10.1002/smll.200700378. [DOI] [PubMed] [Google Scholar]
- 55.Halpern EJ, Gingold EL, White H, Read K. Evaluation of coronary artery image quality with knowledge-based iterative model reconstruction. Acad Radiol. 2014;21(6):805–11. doi: 10.1016/j.acra.2014.02.017. [DOI] [PubMed] [Google Scholar]
- 56.Gordon S, Taylor PR. Monocyte and macrophage heterogeneity. Nat Rev Immunol. 2005;5(12):953–64. doi: 10.1038/nri1733. [DOI] [PubMed] [Google Scholar]
- 57.Swirski FK, Libby P, Aikawa E, Alcaide P, Luscinskas FW, Weissleder R, Pittet MJ. Ly-6Chi monocytes dominate hypercholesterolemia-associated monocytosis and give rise to macrophages in atheromata. J Clin Invest. 2007;117(1):195–205. doi: 10.1172/JCI29950. [DOI] [PMC free article] [PubMed] [Google Scholar]
- 58.Hilgendorf I, Swirski FK, Robbins CS. Monocyte fate in atherosclerosis. Arterioscler Thromb Vasc Biol. 2015;35(2):272–9. doi: 10.1161/ATVBAHA.114.303565. [DOI] [PubMed] [Google Scholar]
- 59.June CH, Riddell SR, Schumacher TN. Adoptive cellular therapy: a race to the finish line. Sci Transl Med. 2015;7(280):280ps7. doi: 10.1126/scitranslmed.aaa3643. [DOI] [PubMed] [Google Scholar]
- 60.Meir R, Shamalov K, Betzer O, Motiei M, Horovitz-Fried M, Yehuda R, Popovtzer A, Popovtzer R, Cohen CJ. Nanomedicine for Cancer Immunotherapy: Tracking Cancer-Specific T-Cells in Vivo with Gold Nanoparticles and CT Imaging. ACS nano. 2015;9(6):6363–72. doi: 10.1021/acsnano.5b01939. [DOI] [PubMed] [Google Scholar]
- 61.Arifin DR, Manek S, Call E, Arepally A, Bulte JW. Microcapsules with intrinsic barium radiopacity for immunoprotection and X-ray/CT imaging of pancreatic islet cells. Biomaterials. 2012;33(18):4681–9. doi: 10.1016/j.biomaterials.2012.03.008. [DOI] [PMC free article] [PubMed] [Google Scholar]
- 62.Hall C, Sturm E, Schultke E, Arfelli F, Menk RH, Astolfo A, Juurlink BHJ. Progress in Cell Marking for Synchrotron X-ray Computed Tomography. AIP Conference Proceedings. 2010;1266(1):51–56. [Google Scholar]
- 63.Hall CJ, Schultke E, Rigon L, Ataelmannan K, Rigley S, Menk R, Arfelli F, Tromba G, Pearson S, Wilkinson S, Round A, Crittell S, Griebel R, Juurlink BH. Synchrotron-based in vivo tracking of implanted mammalian cells. Eur J Radiol. 2008;68(3 Suppl):S156–9. doi: 10.1016/j.ejrad.2008.04.058. [DOI] [PubMed] [Google Scholar]
- 64.Rigley S, Rigon L, Ataelmannan K, Chapman D, Doucette R, Griebel R, Juurlink B, Arfelli F, Menk RH, Tromba G, Barroso RC, Beveridge T, Lewis R, Pavlov K, Siu K, Hall C, Schültke E. Absorption edge subtraction imaging for volumetric measurement in an animal model of malignant brain tumor. Nuclear Instruments and Methods in Physics Research Section A: Accelerators, Spectrometers, Detectors and Associated Equipment. 2005;548(1–2):88–93. [Google Scholar]
- 65.Khurana A, Nejadnik H, Gawande R, Lin G, Lee S, Messing S, Castaneda R, Derugin N, Pisani L, Lue TF, Daldrup-Link HE. Intravenous ferumoxytol allows noninvasive MR imaging monitoring of macrophage migration into stem cell transplants. Radiology. 2012;264(3):803–11. doi: 10.1148/radiol.12112393. [DOI] [PMC free article] [PubMed] [Google Scholar]
- 66.Naresh NK, Xu Y, Klibanov AL, Vandsburger MH, Meyer CH, Leor J, Kramer CM, French BA, Epstein FH. Monocyte and/or macrophage infiltration of heart after myocardial infarction: MR imaging by using T1-shortening liposomes. Radiology. 2012;264(2):428–35. doi: 10.1148/radiol.12111863. [DOI] [PMC free article] [PubMed] [Google Scholar]
- 67.Horak D, Babic M, Jendelova P, Herynek V, Trchova M, Pientka Z, Pollert E, Hajek M, Sykova E. D-mannose-modified iron oxide nanoparticles for stem cell labeling. Bioconjug Chem. 2007;18(3):635–44. doi: 10.1021/bc060186c. [DOI] [PubMed] [Google Scholar]
Associated Data
This section collects any data citations, data availability statements, or supplementary materials included in this article.