Abstract
Background. In order to understand the colocalization of genetic loci amongst species, synteny and collinearity analysis is a frequent task in comparative genomics research. However many analysis software packages are not effective in visualizing results. Problems include lack of graphic visualization, simple representation, or inextensible format of outputs. Moreover, higher throughput sequencing technology requires higher resolution image output. Implementation. To fill this gap, this paper publishes VGSC, the Vector Graph toolkit of genome Synteny and Collinearity, and its online service, to visualize the synteny and collinearity in the common graphical format, including both raster (JPEG, Bitmap, and PNG) and vector graphic (SVG, EPS, and PDF). Result. Users can upload sequence alignments from blast and collinearity relationship from the synteny analysis tools. The website can generate the vector or raster graphical results automatically. We also provide a java-based bytecode binary to enable the command-line execution.
1. Introduction
Synteny is the collection of contiguous genes located on the chromosome of different species. Collinearity is a particular kind of synteny in which the genes are conserved in the same order [1]. Understanding this colocalization of genetic loci amongst species is a frequent task in comparative genomics research, and it often relies on the accuracy of homology identification within or across genomes. During the evolution, eukaryotic genomes between different species reveal this synteny and collinearity in various levels [2]. There are many reasons for the structural variation of genes all over the long evolutionary history, such as whole-genome duplication (WGD), segmental duplication, inversions, and translocations [3, 4]. Genomes have been shaped and restructured dynamically. Related application includes [5] annotation of newly sequenced genomes [6], identification of conserved noncoding sequences [7], estimation of whole genome duplication events [1], prediction of chromosomal rearrangements, and the structure of ancestral genomes [8]. As a result, the procedure of synteny and collinearity analysis has become a hot topic in evolutionary biology as a standard step for elucidating the evolutionary histories of both genomes and gene families.
To meet the requirement of synteny and collinearity analysis, the majority of softwares focus on the detection and alignment of the original sequencing data. Using the traditional clustering of neighboring match of gene pairs, various softwares have been developed to match gene pairs, including ADHoRe [9], the Max-gap Clusters by Multiple Sequence Comparison (MCMuSeC) [10], and OrthoCluster [11, 12]. More recent methods apply dynamic algorithm to pairwise collinear genes chains, in which a matching system scores the adjacent collinear gene pairs, known as anchor genes, and penalizes the distance between anchor genes. This method has been implemented in software tools such as ColinearScan [13], MCScan [1], SyMAP [6], FISH [14], and CYNTENATOR [15]. Besides the pairwise collinear relationships among chromosomal regions, the multialignment (alignment of three or more regions) of collinear chromosomal regions (referred to as collinear blocks) is more important as it can reveal ancient WGD events [1] and complex chromosomal duplication/rearrangement relationships [16]. One of the early software packages providing analysis of collinearity within gene families is MicroSyn [17]. MCScan [1], Multiple Collinearity Scan, is another very popular algorithm in synteny and collinearity detection. It scans multiple genomes or subgenomes, identifies putative homologous chromosomal regions, and marks these gene regions with alignment anchors. The latest i-ADHoRe 3.0 [18] combines pairwise comparison with an iterative profile search, and it uses rigorous statistical tests to ensure that regions found are significant. All these software packages have focused on the process of data rather than downstream analysis. Many of them do not even provide visual graphic outputs.
Another class of synteny and collinearity tools works with the general-purpose genome browsers, which are softwares that allow the user to view genome annotations in the context of a reference sequence. Most of them use vector graphics to enable the scrolling and zooming through arbitrary regions of a genome. GBrowse-syn [19] is the plugin of GBrowse 2.0 [20, 21], one of the most powerful web-based applications to visualize genomic data. It allows the comparison of collinear regions of multiple genomes using the GBrowse-styled web page, in which the synteny and collinearity are displayed as traditional connection diagram. This kind of general-purpose software packages however only provides very basic drawings, as they are not designed to meet the advance visualization requirement of the synteny and collinearity representation.
As synteny and collinearity visualization becomes increasingly important, many specific software programs have been developed lately. Most of these software programs, such as SynChro [5], GSV [22], and Easyfig [23], however inherit the linear tradition in this area, which plots the synteny and collinearity relationship into lines and bars. A typical output style uses two bars for the chromosomes and lines for the colocational relationship. While it is easier and more convenient to use web based interface to generate the linear plot, it is difficult for research reporting, especially for paper pipelines. The extension package of MCScan named MCScanX [24] implements 15 utility programs for display and analyses. However, MCScanX provides a command-line based plotter with PNG output only. Another case in point is that the i-ADHoRe 3.0 [18] extends ADHoRe [9] and provides a package to draw dot plot in SVG vector graphics and PNG raster images.
Circos [25] is a well-known visualization tool using circular ideogram layout to facilitate the identification and analysis of similarities and differences found in comparisons of genomes. Raster or vector images can be created from GFF-style data inputs and hierarchical configuration files, which are popular in bioinformatics researches, making Circos suitable for rapid reporting pipelines. A typical case is C-Sibelia [26], which focuses on the synteny and collinearity analysis and outputs the Circos-formated file to plot. Many recent genetic research reports in Nature and Science have applied Circos-styled figures, but still it only provides circular plot.
There are many online platforms for genome evolution that are dedicated to synteny and collinearity analysis. Meanwhile, more and more researchers use their visualization services in their research procedures. Since the cost of calculation grows exponentially with the amount of data, particularly in the process of analysis, most of these platforms provide dotted or linear plot because it is much simpler and faster to accomplish. Examples of such platforms include Plant Genome Duplication DataBase [27], MIPS CrowsNest [28], and Yeast Gene Order Browser [29]. Only very few platforms can generate complex plots, such as circular plot and multialignment plot, for example, the famous Ensembl [30, 31]. In plant comparative genomics, PLAZA 3.0 is one of the most powerful all-in-one solutions in this area. It has collected a large quantity of data and developed the full utility sets to support research from analyses to visualizations [32]. And yet none of them provides full support of vector graphic outputs. The gap for multistyled vector-based plots in synteny and collinearity remains to be filled.
Generally, synteny and collinearity analysis is a frequent task in comparative genomics research. Many analysis software packages are available, but not effective in visualizing the result, shown in Table 1. The problems include lack of graphic visualization, simple representation, or inextensible output format. On the other hand, general-purpose visualization tools are powerful, but not specific for synteny and collinearity display. This requirement grows rapidly while higher throughput of datasets generates higher resolution outputs.
Table 1.
Software list for synteny and collinearity visualization.
| Software name | Publishing year | Graphical synteny | Visualization types | Vector graphics |
|---|---|---|---|---|
| MCMuSeC | 2009 | ✕ | ✕ | ✕ |
| OrthoCluster | 2009 | ✓ | Dual bar, linear | ✕ |
| i-ADHoRe 3 | 2011 | ✓ | Dotted hierarchy | ✓ |
| FISH | 2003 | ✕ | ✕ | ✕ |
| ColinearScan | 2006 | ✕ | ✕ | ✕ |
| MCScan | 2008 | ✕ | ✕ | ✕ |
| CYNTENATOR | 2010 | ✕ | ✕ | ✕ |
| SyMAP | 2011 | ✓ | Dual bar | ✕ |
| MCScanX | 2012 | ✓ | Dotted linear circular | ✕ |
| SynChro | 2014 | ✓ | Dual bar | ✕ |
| GSV | 2011 | ✓ | Dual bar | ✕ |
| EasyFig | 2011 | ✓ | Dual bar | ✓ |
| C-Sibelia | 2013 | ✕ | Circos-format | ✕ |
| Gbrowse-syn | 2010 | ✓ | Dual bar | ✕ |
| Kegg | 2000 | ✓ | Network | ✕ |
| Circos | 2009 | ✓ | Circular | ✓ |
| WebLogo | 2004 | ✕ | Textual | ✓ |
| VGSC | 2015 | ✓ | Dotted linear circular | ✓ |
In this paper, we introduce VGSC, a purpose-built toolkit in visualizing the synteny and collinearity into general graphical format, including both raster (JPEG, Bitmap, and PNG) and vector graphics (SVG, EPS, and PDF).
Vector graphics are a computational representation of graphical objects using vectors, a geometric object with a magnitude and a direction. In this way, vector graphics are normally combinations of geometrical primitives, such as points, lines, curves, shapes, and polygons. In contrast, raster images use dot matrix data to represent a generally rectangular grid of pixels or points of color. The advantages of vectors are scale-invariance, rotate-invariance, and transform-invariance. They enable the antialiasing feature, which means graphics can be magnified infinitely without loss of quality. Therefore, vector graphics are widely used in scientific research, especially in the bioinformatics research where a massive amount of data from the sequencing process generates various types of high-resolution graphs. A good case in point is WebLogo [33], which is a software package to generate sequence logos, the graphical representations of the patterns within a multiple sequence alignment. WebLogo is so popular that in some areas it becomes the gold standard. This tool is very effective and efficient because it provides both command line interface and web interface, as well as both raster and vector graphics as outputs.
2. Implementation and Result
2.1. Software Architecture
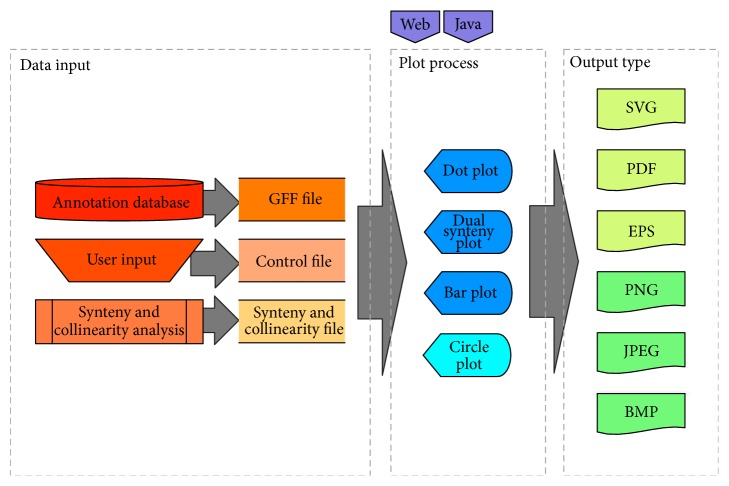
Vector Graphic toolkit of genome Synteny and Collinearity (VGSC) is a new web-based interface for synteny and collinearity representation. Its software architecture is shown in Figure 1, in which the command-line toolkits and web-based service are both illustrated. The workflow of plotting remains as simple as most visualization tools: the end user prepares the required datasets and configures the basic parameters; the software then plots accordingly. Many of these features have simplified the process of drawing, so that researches can focus more on the analysis and interpretation of the data.
Figure 1.
System architecture of VGSC.
2.2. Data Input and Configuration
In Figure 2, three inputs from end users are required: (1) synteny and collinearity file, (2) gene annotation file, and (3) control file. And they are explained as follows:
Synteny and collinearity file: VGSC operates on the preprocessed synteny and collinearity data. It is easy to convert results from all the common synteny and collinearity analysis software packages into the required format. The detailed requirement is available in the software manual.
Gene annotation file: this GFF3 annotation file (http://www.gmod.org/wiki/GFF3) provides the fundamental map for the plotting, which is widely used in gene assembling software and gene databases.
Control file: in this file, the detailed configuration sets the width, length, color, and so forth for the plot.
If end users run VGSC in the command line, these settings serve as inputs as textual parameters. A Java Runtime Environment 1.8 is mandatory, as the software is packaged as a Java executable. For users, synteny and collinearity file and annotation file should be uploaded, and the parameters in the control file can be configured directly in the web form. In addition, we have listed a set of data samples with preconfigured parameters in the “Example” section of the website to help end users carry out tests.
Figure 2.
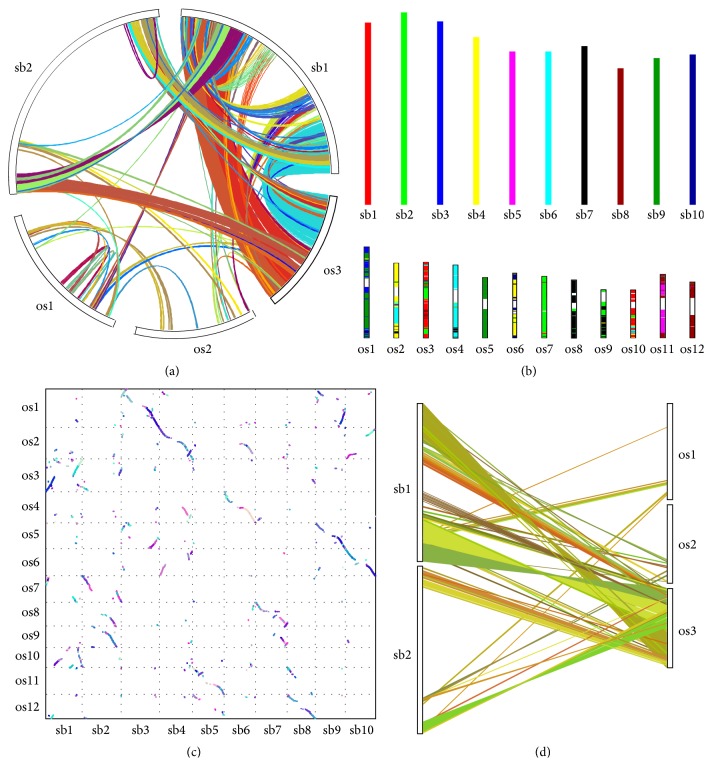
Four types of synteny and collinearity plot: (a) Circle Plot, (b) Bar Plot, (c) Dot Plot, and (d) Dual Synteny Plot. Chromosomes are labeled in species abbreviation plus chromosome ID. os, Oryza sativa; sb, Sorghum bicolor.
2.3. Output and Result
VGSC provides four different types of plots in six different file formats, with which the synteny and collinearity information can be drawn into circle, bars, dots, and dual synteny. Figure 2 demonstrates the four plots generated by a sample data set of the synteny and collinearity across Rice (Oryza sativa) and Sorghum (Sorghum bicolor) from MCScanX website (http://chibba.pgml.uga.edu/mcscan2).
In the command-line executable, we have implemented a plot manager to integrate all types of plots into one command, which has made the selection much easier. We have introduced a multiple file format adaptor, which enables both raster and vector graphics, so that the output file formats expend to SVG, EPS, PDF, JPEG, and BMP, in addition to the popular PNG format. This automatic configuration mechanism is also applied to all the parameter settings, and the detailed settings list is in the software manual, available at http://bio.njfu.edu.cn:8080/vgsc-web/static/downloads/vgsc-manual.pdf.
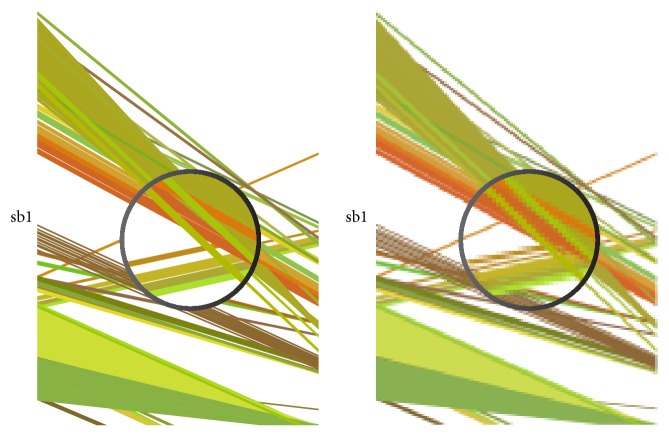
One of the most important features of VGSC is its ability to produce vector graphics. As Figure 3 demonstrates, compared with raster graphics (right), vector graphics (left) provide higher compatibility when the image is magnified. This is particularly noticeable when high-throughput datasets are concerned. High-quality images are often a requirement for scientific research reports and papers.
Figure 3.
Resolution comparison between vector graphics and raster graphics.
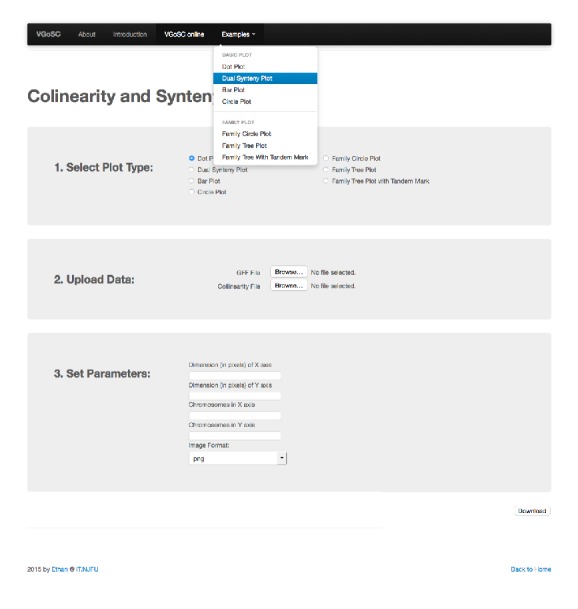
For web users, there is a list of options, where end users can specify the type of plot. A dropdown menu is also available, where end users can choose the output file format. Once the settings are confirmed, results can be downloaded as a separate file when the “Download” button is clicked. In the online service, both vector graphics and raster images are provided.
2.4. Online System
Parallel with command-line toolkit, we have published a web-based system, VGSC online, to provide the plotting service and to improve the experience in plotting. It is available at http://bio.njfu.edu.cn:8080/vgsc-web. The VGSC online uses Java Web Technology and is compatible with most of web containers including Tomcat and jetty. Figure 4 shows the screenshot from the example pages in VGSC online. It lists all types of plots with sample data, providing end users with a visual scaffold. We have also published the command line executable for downloading, along with some sample data and relevant documentation. All these resources are provided free.
Figure 4.

Screenshot of VGSC online.
3. Conclusion
While many synteny and collinearity tools have become available in recent years, their visual presentation has not been developed accordingly. For this reason, users often have to write additional programs or redraw the synteny and collinearity output files in order to plot a representative high-quality image. This incompleteness of visualization has reduced the efficiency of existing synteny and collinearity detection pipeline. VGSC has been created to fill this gap. A distinguishing feature of VGSC and its online service is that diverse tools for vector graphics of synteny and collinearity are incorporated, which enables rapid and convenient conversion of synteny and collinearity information into graphical insights. Additional plots for downstream analysis, such as plots for gene family, will be implemented in the coming version of VGSC. VGSC therefore will also be an effective tool for structural changes and evolution analysis, annotation for new genomes, and gene family history research.
Acknowledgments
The authors thank National Basic Research Program of China (973 Program) (2012CB114505), China National Funds for Distinguished Young Scientists (31125008), and National Natural Science Foundation of China (Grant no. 31570662 and Grant no. 31500533). They also acknowledge supports from Key Projects in the National Science & Technology Pillar Program during the Twelfth Five-year Plan Period (no. 2012BAD01B07) and the Fundamental Research Funds for the Central Non-profit Research Institution of CAF (CAFYBB2014QB015). This work is also enabled by the Innovative Research Team Program of the Educational Department of China, the Innovative Research Team Program in Universities of Jiangsu Province, and the PAPD (Priority Academic Program Development) program at Nanjing Forestry University.
Conflict of Interests
The authors declare that there is no conflict of interests regarding the publication of this paper.
Authors' Contribution
Yiqing Xu and Changwei Bi contributed equally to this work.
References
- 1.Tang H., Bowers J. E., Wang X., Ming R., Alam M., Paterson A. H. Synteny and collinearity in plant genomes. Science. 2008;320(5875):486–488. doi: 10.1126/science.1153917. [DOI] [PubMed] [Google Scholar]
- 2.Coghlan A., Eichler E. E., Oliver S. G., Paterson A. H., Stein L. Chromosome evolution in eukaryotes: a multi-kingdom perspective. Trends in Genetics. 2005;21(12):673–682. doi: 10.1016/j.tig.2005.09.009. [DOI] [PubMed] [Google Scholar]
- 3.Dujon B., Sherman D., Fischer G., et al. Genome evolution in yeasts. Nature. 2004;430(6995):35–44. doi: 10.1038/nature02579. [DOI] [PubMed] [Google Scholar]
- 4.Nakatani Y., Takeda H., Kohara Y., Morishita S. Reconstruction of the vertebrate ancestral genome reveals dynamic genome reorganization in early vertebrates. Genome Research. 2007;17(9):1254–1265. doi: 10.1101/gr.6316407. [DOI] [PMC free article] [PubMed] [Google Scholar]
- 5.Drillon G., Carbone A., Fischer G. SynChro: a fast and easy tool to reconstruct and visualize synteny blocks along eukaryotic chromosomes. PLoS ONE. 2014;9(3) doi: 10.1371/journal.pone.0092621.e92621 [DOI] [PMC free article] [PubMed] [Google Scholar]
- 6.Soderlund C., Bomhoff M., Nelson W. M. SyMAP v3.4: a turnkey synteny system with application to plant genomes. Nucleic Acids Research. 2011;39(10, article e68) doi: 10.1093/nar/gkr123. [DOI] [PMC free article] [PubMed] [Google Scholar]
- 7.Lyons E., Pedersen B., Kane J., et al. Finding and comparing syntenic regions among Arabidopsis and the outgroups papaya, poplar, and grape: CoGe with rosids. Plant Physiology. 2008;148(4):1772–1781. doi: 10.1104/pp.108.124867. [DOI] [PMC free article] [PubMed] [Google Scholar]
- 8.Ma J., Zhang L., Suh B. B., et al. Reconstructing contiguous regions of an ancestral genome. Genome Research. 2006;16(12):1557–1565. doi: 10.1101/gr.5383506. [DOI] [PMC free article] [PubMed] [Google Scholar]
- 9.Vandepoele K., Saeys Y., Simillion C., Raes J., Van de Peer Y. The automatic detection of homologous regions (ADHoRe) and its application to microcolinearity between Arabidopsis and rice. Genome Research. 2002;12(11):1792–1801. doi: 10.1101/gr.400202. [DOI] [PMC free article] [PubMed] [Google Scholar]
- 10.Ling X., He X., Xin D. Detecting gene clusters under evolutionary constraint in a large number of genomes. Bioinformatics. 2009;25(5):571–577. doi: 10.1093/bioinformatics/btp027. [DOI] [PubMed] [Google Scholar]
- 11.Vergara I. A., Chen N. Using OrthoCluster for the detection of synteny blocks among multiple genomes. Current Protocols in Bioinformatics. 2009;(chapter 6: unit 6.10) doi: 10.1002/0471250953.bi0610s27. [DOI] [PubMed] [Google Scholar]
- 12.Zeng X., Nesbitt M. J., Pei J., Wang K., Vergara I. A., Chen N. OrthoCluster: a new tool for mining synteny blocks and applications in comparative genomics. Proceedings of the 11th International Conference on Extending Database Technology: Advances in Database Technology (EDBT '08); March 2008; Nantes, France. ACM; pp. 656–667. [DOI] [Google Scholar]
- 13.Wang X., Shi X., Li Z., et al. Statistical inference of chromosomal homology based on gene colinearity and applications to Arabidopsis and rice. BMC Bioinformatics. 2006;7, article 447 doi: 10.1186/1471-2105-7-447. [DOI] [PMC free article] [PubMed] [Google Scholar]
- 14.Calabrese P. P., Chakravarty S., Vision T. J. Fast identification and statistical evaluation of segmental homologies in comparative maps. Bioinformatics. 2003;19(1):i74–i80. doi: 10.1093/bioinformatics/btg1008. [DOI] [PubMed] [Google Scholar]
- 15.Rödelsperger C., Dieterich C. CYNTENATOR: progressive gene order alignment of 17 vertebrate genomes. PLoS ONE. 2010;5(1) doi: 10.1371/journal.pone.0008861.e8861 [DOI] [PMC free article] [PubMed] [Google Scholar]
- 16.Abrouk M., Murat F., Pont C., et al. Palaeogenomics of plants: synteny-based modelling of extinct ancestors. Trends in Plant Science. 2010;15(9):479–487. doi: 10.1016/j.tplants.2010.06.001. [DOI] [PubMed] [Google Scholar]
- 17.Cai B., Yang X., Tuskan G. A., Cheng Z.-M. MicroSyn: a user friendly tool for detection of microsynteny in a gene family. BMC Bioinformatics. 2011;12, article 79 doi: 10.1186/1471-2105-12-79. [DOI] [PMC free article] [PubMed] [Google Scholar]
- 18.Proost S., Fostier J., De Witte D., et al. i-ADHoRe 3.0—fast and sensitive detection of genomic homology in extremely large data sets. Nucleic Acids Research. 2012;40(2, article e11) doi: 10.1093/nar/gkr955. [DOI] [PMC free article] [PubMed] [Google Scholar]
- 19.McKay S. J., Vergara I. A., Stajich J. E. Current Protocols in Bioinformatics. chapter 9. Hoboken, NJ, USA: John Wiley & Sons; 2010. UNIT 9.12 using the generic synteny browser (GBrowse_syn) [DOI] [PMC free article] [PubMed] [Google Scholar]
- 20.Stein L. D., Mungall C., Shu S., et al. The generic genome browser: a building block for a model organism system database. Genome Research. 2002;12(10):1599–1610. doi: 10.1101/gr.403602. [DOI] [PMC free article] [PubMed] [Google Scholar]
- 21.Stein L. D. Using GBrowse 2.0 to visualize and share next-generation sequence data. Briefings in Bioinformatics. 2013;14(2):162–171. doi: 10.1093/bib/bbt001. [DOI] [PMC free article] [PubMed] [Google Scholar]
- 22.Revanna K. V., Chiu C.-C., Bierschank E., Dong Q. GSV: a web-based genome synteny viewer for customized data. BMC Bioinformatics. 2011;12(1, article 316) doi: 10.1186/1471-2105-12-316. [DOI] [PMC free article] [PubMed] [Google Scholar]
- 23.Sullivan M. J., Petty N. K., Beatson S. A. Easyfig: a genome comparison visualizer. Bioinformatics. 2011;27(7):1009–1010. doi: 10.1093/bioinformatics/btr039. [DOI] [PMC free article] [PubMed] [Google Scholar]
- 24.Wang Y., Tang H., Debarry J. D., et al. MCScanX: a toolkit for detection and evolutionary analysis of gene synteny and collinearity. Nucleic Acids Research. 2012;40(7, article e49) doi: 10.1093/nar/gkr1293. [DOI] [PMC free article] [PubMed] [Google Scholar]
- 25.Krzywinski M., Schein J., Birol I., et al. Circos: an information aesthetic for comparative genomics. Genome Research. 2009;19(9):1639–1645. doi: 10.1101/gr.092759.109. [DOI] [PMC free article] [PubMed] [Google Scholar]
- 26.Minkin I., Pham H., Starostina E., Vyahhi N., Pham S. C-Sibelia: an easy-to-use and highly accurate tool for bacterial genome comparison. F1000Research, November 2013, http://f1000research.com/articles/2-258/v1. [DOI] [PMC free article] [PubMed]
- 27.Lee T.-H., Tang H., Wang X., Paterson A. H. PGDD: a database of gene and genome duplication in plants. Nucleic Acids Research. 2013;41(1):D1152–D1158. doi: 10.1093/nar/gks1104. [DOI] [PMC free article] [PubMed] [Google Scholar]
- 28.Nussbaumer T., Martis M. M., Roessner S. K., et al. MIPS PlantsDB: a database framework for comparative plant genome research. Nucleic Acids Research. 2013;41(1):D1144–D1151. doi: 10.1093/nar/gks1153. [DOI] [PMC free article] [PubMed] [Google Scholar]
- 29.Byrne K. P., Wolfe K. H. The Yeast Gene Order Browser: combining curated homology and syntenic context reveals gene fate in polyploid species. Genome Research. 2005;15(10):1456–1461. doi: 10.1101/gr.3672305. [DOI] [PMC free article] [PubMed] [Google Scholar]
- 30.Flicek P., Amode M. R., Barrell D., et al. Ensembl 2014. Nucleic Acids Research. 2014;42(1):D749–D755. doi: 10.1093/nar/gkt1196. [DOI] [PMC free article] [PubMed] [Google Scholar]
- 31.Cunningham F., Amode M. R., Barrell D., et al. Ensembl 2015. Nucleic Acids Research. 2015;43(1):D662–D669. doi: 10.1093/nar/gku1010. [DOI] [PMC free article] [PubMed] [Google Scholar]
- 32.Proost S., Van Bel M., Vaneechoutte D., et al. PLAZA 3.0: an access point for plant comparative genomics. Nucleic Acids Research. 2015;43(1):D974–D981. doi: 10.1093/nar/gku986. [DOI] [PMC free article] [PubMed] [Google Scholar]
- 33.Crooks G. E., Hon G., Chandonia J.-M., Brenner S. E. WebLogo: a sequence logo generator. Genome Research. 2004;14(6):1188–1190. doi: 10.1101/gr.849004. [DOI] [PMC free article] [PubMed] [Google Scholar]


