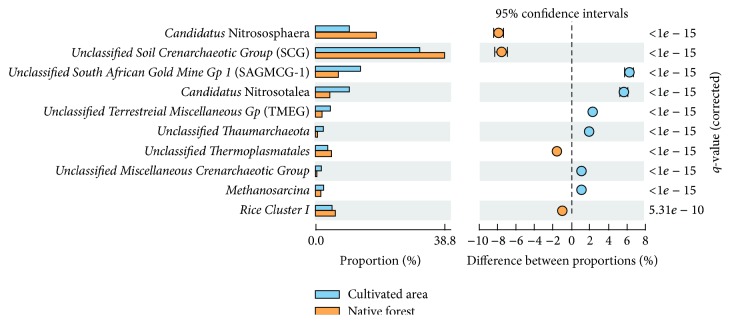
Figure 7.
Archaeal genera that differ significantly (q < 0.05) in relative abundance between native forest soil (orange) and soil under oil palm cultivation (blue). For the purpose of statistical analysis performed using STAMP software, the sum of the percentages of archaea classified at the genus level in both soils is 100%. Differences between proportions of each genus are shown with 95% confidence intervals. Unclassified sequences were used to calculate frequency profiles but are not displayed.

