

Abstract
Pancreatic islets of Langerhans contain several specialized endocrine cell types, which are commonly identified by the expression of single marker genes. However, the established marker genes cannot capture the complete spectrum of cellular heterogeneity in human pancreatic islets, and existing bulk transcriptome datasets provide averages across several cell populations. To dissect the cellular composition of the human pancreatic islet and to establish transcriptomes for all major cell types, we performed single‐cell RNA sequencing on 70 cells sorted from human primary tissue. We used this dataset to validate previously described marker genes at the single‐cell level and to identify specifically expressed transcription factors for all islet cell subtypes. All data are available for browsing and download, thus establishing a useful resource of single‐cell expression profiles for endocrine cells in human pancreatic islets.
Keywords: alpha cells, beta cells, diabetes, marker genes, single‐cell RNA‐seq
Subject Categories: Systems & Computational Biology
Introduction
Located within the pancreas, the islets of Langerhans are composed of endocrine cells expressing glucagon (alpha cells), insulin (beta cells), somatostatin (delta cells), pancreatic polypeptide (PP cells), and ghrelin (epsilon cells). Furthermore, they are heavily vascularized and innervated, and in contact with the surrounding acinar and ductal cells of the exocrine pancreas. Pancreatic islets function as highly specialized micro‐organs that monitor and maintain blood glucose homeostasis. While damage to beta cells causes diabetes, the other pancreatic cell types may also contribute to pathogenesis in ways that are not well understood. Recent studies showed that both alpha 1 and delta cells 2 have the potential to replenish beta cell mass in animal models.
Development of diabetes correlates with global changes in the transcriptome of pancreatic islets 3. These gene expression changes could reflect alterations in the cell subtype composition of the islet and/or changes in the transcriptomes of beta cells or other individual cell types. Analyzing islet cell‐specific gene expression changes has the potential to shed light on the etiology of diabetes. Recently, alpha and beta cell purification protocols from human 4, 5, 6 and mouse islets 7, 8 have yielded initial maps of cell type‐specific transcriptomes. The available transcriptome datasets further comprise primary mouse and human alpha cells, beta cells, and delta cells, a number of rodent alpha and beta cell lines, and one human beta cell line 4, 9, 10, 11, 12. Despite the rapid progress in this field, a comprehensive transcriptome database for individual human islet cell types is still missing, and no transcriptome data are currently available for PP cells.
Recent advances in next‐generation sequencing and library preparation enabled for the first time the transcriptome characterization of single cells from primary tissue. For example, this approach was successfully used to establish transcriptome profiles and dissect cell type heterogeneity for primary tissue obtained from the lung 13, the spleen, and the brain 14, 15.
Here, we used single‐cell RNA‐seq to establish a comprehensive transcriptome database for the cell types that are present in primary human pancreatic islets. Principal component analysis in combination with visualization as biplots identified alpha cells, beta cells, delta cells, PP cells, acinar cells, and pancreatic duct cells directly from the single‐cell transcriptome profiles. We illustrate the utility of this resource by discovering novel cell type‐specific marker genes, and we identified human‐specific expression patterns in alpha and beta cells. All data are readily available for user‐friendly online browsing and download to foster research on pancreatic islet biology and diabetes‐related mechanisms in human.
Results and Discussion
Single‐cell transcriptomes recapitulate pancreatic endocrine cell types
Primary human pancreatic islets of Langerhans were disassociated into single cells, and these cells were sorted into individual wells of a 96‐well plate by FACS 16. The Smart‐Seq2 protocol 17 was then applied to obtain single‐cell transcriptomes. Following the generation and amplification of cDNA, we determined the levels of beta‐actin expression by qRT–PCR and selected all cell‐containing wells for library preparation and next‐generation sequencing (Fig 1A). Seventy cells were sequenced in total, of which 64 cells passed quality control (see Materials and Methods) and were included in the analysis (Fig EV1A and B, and Dataset EV1). We obtained an average of 12.7 million high‐quality reads per single cell, of which 62.9% aligned to the human reference genome. RNA expression levels were calculated using the BitSeq software which uses RPKM normalization and corrects for non‐uniform read distribution along the transcripts (e.g., 3‐prime bias) 18. Data quality was validated by assessing the relation between expression level and transcript length in native RNA (Fig EV1C) as well as ERCC spike‐in controls (Fig EV1D). While transcript length and expression level were not correlated in the ERCC spike‐in controls, we detected a negative correlation (r = −0.405) in the native RNA which was in the range of what had been previously reported as biologically significant finding 19. However, a potential bias due to transcript length normalization cannot be completely excluded; therefore, comparing expression levels of different transcripts/genes should be performed with caution. To define global similarities among the single cells and the marker genes that drive these similarities, we performed principal component analysis (PCA) on the transcriptome dataset and displayed the results as biplots. PCA on the full dataset separates a group of 18 cells based on high glucagon (GCG) and transthyretin (TTR) expression and a group of 9 cells expressing pancreatic polypeptide (PPY) from a heterogeneous group of 37 cells (Fig 1B). In a second PCA on the 37 yet undefined cells, we identified a group of 12 cells with high insulin (INS) expression, a group of 11 cells characterized by PRSS2, CTRB2, REG3A, REG1A, and REG1B and a group of two somatostatin (SST)‐expressing cells. In a third PCA on the remaining 12 undefined cells, a group of 8 cells was characterized by keratin18 (KRT18) and keratin8 (KRT8). Based on the expression profiles of the identified marker genes, we were able to uniquely assign 60 out of 64 single‐cell transcriptomes to the alpha, beta, delta, PP, acinar, or ductal cell type (Fig 1C).
Figure 1. Single‐cell transcriptomes recapitulate the major pancreatic cell types.

- Workflow for obtaining and analyzing single‐cell RNA‐seq data from human pancreatic islets.
- Iterative PCA/biplot‐based approach for the identification of cell types and cell type‐defining transcripts from single‐cell RNA‐seq data.
- Expression (scaled RPKM values) of cell type‐defining genes as identified in (B) across all single cells. Transcripts and single cells are grouped by cell type as identified in (B).
- Display of transcriptional similarity between all single cells by MDS. The coloring scheme is based on the cell types as identified in (B).
- Relative expression (scaled RPKM value) of canonical marker genes for the 6 identified pancreatic islet cell populations represented by bubble size and projected onto the MDS profile.
Figure EV1. Statistical analysis of single‐cell RNA‐seq data.

- Number of detected transcripts and total aligned reads for each single cell. The red line denotes 500 transcripts, below which samples were excluded from the analysis.
- Scatter plots displaying the correlation between the number of input ERCC RNA molecules and measured RPKM values in four representative single cells. The Pearson correlation (r) is noted in the upper left corner.
- Scatter plots correlating raw read counts (left) and RPKM normalized expression values (right) with transcript length. All adequately covered transcripts (> 25 reads) of all 64 samples were included in this analysis. The observed negative correlation after RPKM normalization lies in the range of what had been reported previously 19.
- Raw counts and RPKM normalized expression values for 10 groups of ERCC spike‐in controls. The amount of molecules spiked into the sequencing reaction is constant within one group, whereas the length of the transcripts varies considerably. Within each group, equal expression values across different transcript lengths thereby confirm that RPKM normalization does not systematically penalize longer transcripts in the assessed ERCC transcript length range of ˜200 to 2,000 bp. ERCC spike‐in controls covered by more than 25 reads are indicated in blue and those with ≤ 25 reads in red.
- MDS displaying transcriptional similarity between corresponding cell types of a published dataset 20 (prefix: ext) and the current dataset.
As an additional validation of our cell type classification, we visualized the global transcriptional similarity of individual pancreatic cells by multidimensional scaling (MDS), where each single‐cell transcriptome was colored by the cell type derived from PCA (Fig 1D). When mapped upon the MDS plot, the known cell type‐specific marker genes INS, GCG, PPY, SST, REG1A, and KRT8 show the expected expression patterns, with different amounts of variability within the subgroups (Fig 1E). The validity of our single‐cell RNA‐seq dataset was further confirmed in direct comparison to an external dataset consisting of bulk RNA‐seq data for whole islet, beta, and acinar cells 20. Using MDS, we show high transcriptional similarity between the corresponding cell types of both datasets (Fig EV1E). The expression information of individual cells and merged expression values for each cell type is available in Dataset EV2.
To rule out technical reasons as a major source of gene expression variability, we identified presumably pure alpha and beta cells among the assessed single cells (Fig EV2A). Their transcription profiles were used to simulate transcriptomes with defined percentages of alpha and beta cell contribution (Fig EV2B). Individual alpha and beta cells were then compared to these virtual transcriptomes to estimate upper limits for potential cross‐contamination (Fig EV2C–E). All beta cell transcriptomes were found to be free from any alpha cell contribution, whereas beta cell profiles could explain a small proportion (< 3%) of the variance observed in 8 of the 18 alpha cells studied. However, given that these alpha cells further show higher unexplained variance, it is likely that they are characterized by high inherent variability rather than cross‐contamination from beta cells. We conclude that the differences between alpha and beta cell heterogeneity are in line with biological rather than technical effects which supports the hypothesis that alpha cells might be more plastic than beta cells 4.
Figure EV2. Assessing cross‐contamination between alpha and beta cells.

- Scatter plot displaying single alpha and beta cells, 500‐cell islet samples, as well as bulk islet and beta cell samples from published datasets according to their weighted mean of scaled expression values in alpha and beta cell‐specific profile genes. The three selected profile cells for each cell type are indicated by their sample ID.
- Pure and mixed expression profiles consisting of 233 alpha cell‐specific genes and 252 beta cell‐specific genes. Alpha and beta cell‐specific profiles are calculated based on the expression values of the three selected profile cells only, while profile genes were selected based on all single cells classified as alpha or beta cells, which is why the expression gradients in the mix profiles do not always follow the same direction.
- Profile correlation curves for each individual sample. The maximum of each curve defines the maximum variance that can be explained (y‐axis) by the corresponding mix profile (x‐axis) providing a measure for the composition of the respective sample.
- Diagram explaining the transition from profile correlation curves to sample composition estimates. The profile composition that explains most variance is linearly scaled to the maximum variance explained.
- Sample composition estimates for each assessed sample. The differences between the 500‐cell islet samples and bulk samples might be explained by technical effects that enrich for alpha cells during islet cultivation, disassociation, and FACS purification.
The heterogeneity within the different cell types was further explored by separate PCAs for each cell type (Appendix Fig S1). Particularly for endocrine cells, heterogeneity was mainly driven by expression differences of marker genes as identified in the initial cell type classification by PCA, suggesting that these cell types are characterized by a spectrum of marker gene expression levels. While this analysis provides evidence for transcriptional heterogeneity, more cells are needed to thoroughly characterize subgroups within the different cell types.
A transcriptome resource to reveal marker genes of human pancreatic cell types
To maximize the utility of our dataset for the identification of cell type‐specific expression patterns, we generated a resource of genome browser tracks of all individual cells as well as cumulative tracks for the cell type clusters identified by PCA (http://islet-transcriptome.computational-epigenetics.org/). One interesting use of this resource is the analysis of master regulatory transcription factors, which are fundamental for the development and the maintenance of different pancreatic cell types based on animal models and human genetics. The genome browser tracks illustrate the beta cell‐specific expression of PDX1, a master regulatory transcription factor directly controlling insulin expression. In contrast, the alpha lineage‐defining factor ARX is expressed in both alpha and some PP cells (Fig 2A and Appendix Fig S2). Other transcription factors that are important for pancreas development have different degrees of cell type‐specific expression in mature human islets, including pan‐endocrine (PAX6), beta cell‐specific (PAX4), and duct/delta (HHEX) patterns (Fig 2B). While MAFA is transcribed in beta cells specifically, we observed robust MAFB expression in alpha, beta, and delta cells. Half of the beta cells studied expressed MAFA and MAFB concomitantly. In addition to these previously described factors, we also observed cell type‐specific expression for transcriptional regulators, which have not yet been extensively characterized in the endocrine pancreas. For example, MORF4L1 shows a similar pan‐endocrine pattern to the canonical islet cell marker NEUROD1 (Fig 2C). A subset of alpha cells express IRX2 (Fig 2D), some beta cells show high expression of polycomb ring finger oncogene (BMI1) (Fig 2E), and PP cells can be characterized by the transcription factors ETV1 and MEIS1 (Fig 2F).
Figure 2. Expression of cell type‐specific transcription factors at single‐cell resolution.

-
AMerged UCSC Genome Browser tracks for the PDX1 and ARX loci. The respective tracks for all single cells are presented in Appendix Fig S2.
-
BRelative expression (scaled RPKM value) of important transcription factors represented by bubble size and projected onto the MDS profile.
-
C–FCell type‐specific expression of pan‐endocrine (C), alpha cell (D), beta cell (E), and PP cell (F) transcription factors (red bar: mean expression). The statistical significance of the differential gene expression is presented in Appendix Fig S6.
We further performed pairwise correlation analysis on transcript level to identify genes, of which the expression profiles correlate highly (r > 0.9) with those of the endocrine marker genes INS, GCG, SST, and PPY (Fig EV3). While several highly correlated genes could be identified for INS and SST (e.g., zinc transporter SLC39A4 and Notch pathway component DLK1 for INS and transcription factors NKX6‐3, ZNF430 for SST), the expression profiles of GCG and PPY did not show high correlation with any other genes.
Figure EV3. Assessing pairwise correlation of endocrine marker genes.

Correlation matrix displaying all genes (y‐axis) that are highly correlated (r > 0.9) with at least one of the endocrine marker genes (x‐axis). Different transcripts of the same gene are indicated by “Tx”.
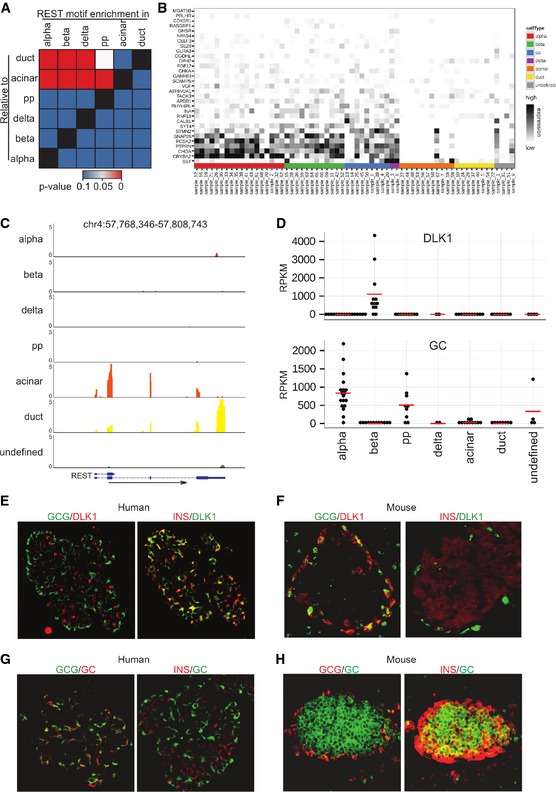
To extend our analysis beyond transcription factors and known marker genes, we performed pairwise comparisons of cell type‐specific transcriptomes by gene set enrichment analysis (Dataset EV3). Interestingly, we observed strong enrichment of a gene set containing the REST‐binding motif in all endocrine cell types compared to acinar and ductal cells (Fig 3A). Most genes that contain the REST motif in their promoters are expressed in alpha, beta, delta, and PP cells, whereas they are repressed in ductal and acinar cells (Fig 3B). The transcriptional repressor REST targets the REST‐binding motif. In line with the target gene expression pattern, REST is specifically expressed in ductal and acinar cells (Fig 3C and Appendix Fig S3).
Figure 3. Single‐cell transcriptomes reveal unique features of human islets.
-
AHeatmap displaying the P‐values obtained by pairwise Gene Set Enrichment Analysis (GSEA) for the REST‐binding motif.
-
BRelative expression (scaled RPKM value) of genes contained in the REST‐binding motif gene set.
-
CMerged UCSC Genome Browser tracks for REST. The respective tracks for all single cells are presented in Appendix Fig S3.
-
DExpression of DLK1 and GC in human islet cell types (red bar: mean expression). The statistical significance of the differential gene expression is presented in Appendix Fig S6.
-
E–HCo‐staining of DLK1 (E, F) or GC (G, H) with insulin and with glucagon in representative human (E, G) and mouse (F, H) islets.
Finally, based on pairwise differential expression analysis between the pancreatic cell types, genes with highly specific expression patterns were identified (Fig EV4 and Appendix Fig S4, Datasets EV4 and EV5). We then used these data to assess islet cell type‐specific expression in two areas of high relevance for diabetes research–diabetes risk genes and mouse–human species differences.
Figure EV4. Specific expression of selected marker genes.

Relative expression (scaled RPKM value) of interesting genes across all single cells represented by bubble size and projected onto the MDS profile as displayed in Fig 1D.
Genomewide association studies (GWAS) have identified genomic loci conferring increased risk for the development of diabetes. We examined whether any of the diabetes‐related genes predicted by GWAS were specifically expressed in one of the pancreatic islet cell types and genes differentially expressed between the endocrine and exocrine cell types (Fig EV5A). For both type 1 and type 2 diabetes, we identified GWAS genes with beta cell‐ and endocrine‐specific expression. Other genes show broader expression patterns, emphasizing the complexity of functional annotation of diabetes GWAS results. Furthermore, key MODY (Mature Onset of Diabetes in Young) 21 genes PDX1, PAX4, INS, HNF1A, GCK are predominantly specific to beta cells (Fig EV5B).
Figure EV5. Assessing cell type specificity of genes identified in diabetes‐related GWAS .

- Cell type specificity for genes reported in diabetes‐related GWAS. Each gene reported in a diabetes‐related GWAS (search for “Diabetes” on GWAS Catalog) was assigned to the pancreatic cell type in which it was found to be most specifically expressed. Ranking was performed as described in Appendix Fig S7B and Dataset EV6.
- Heatmap showing mean expression values for the most cell type‐specific diabetes‐associated GWAS genes in the different here identified human islet cell types. Specifically, only genes with a specificity rank lower than 500 (dashed line in panel A) are listed, and genes with equal expression in multiple cell types are not shown. The numbers in the colored boxes indicate the number of studies in which the respective gene has been reported. Heatmaps are colored by mean ln(RPKM), the mean of the natural logarithm of the RPKM values across all cells of the respective cell type.
To investigate species‐specific differences of alpha and beta cell transcriptomes, we assessed the degree to which the previously identified differentially expressed mouse genes 7, 9 are also differentially expressed in human islets and vice versa (Appendix Fig S5). We found that the human alpha cell‐specific gene group‐specific component (vitamin D binding protein) GC and the human beta cell‐specific gene DLK1 (Fig 3D) displayed opposite expression patterns as to what had been reported in mouse islet cells. To confirm the cell type‐specific expression of DLK1 and GC, we performed immunofluorescence staining on both human and mouse pancreatic tissue sections. In human islets, DLK1 was specifically expressed only in insulin‐positive cells (Fig 3E), whereas this protein was observed in glucagon‐positive cells in mouse tissue (Fig 3F). Similarly, GC expression showed alpha cell specificity in human tissues (Fig 3G), whereas it was co‐expressed with insulin in mouse tissues (Fig 3H). These results suggest that two of the most differentially expressed cell type‐specific marker genes for human alpha and beta cells have opposite expression patterns in mouse islets.
Pancreatic islets comprise different cell types with characteristic transcriptomes, which confounds transcriptome studies that focus on whole pancreatic islets in physiological and pathological conditions. Lineage‐labeled transgenic mice have made it possible to obtain transcriptomes for highly pure alpha and beta cell populations in mouse. For human islets, however, cell type‐specific enrichment strategies depend on the availability of specific antibodies. Efforts have been made to measure the transcription of individual genes in single human islet cells by qRT–PCR 22, but our dataset is the first to provide genomewide transcriptional information of human islets at single‐cell resolution. Using single‐cell data, we also for the first time defined the transcriptomes of human delta cells and PP cells, thereby providing reference transcriptomes for all major endocrine cell types in human pancreatic islets.
We illustrated the practical utility of our resource and dataset by three case studies. First, after confirming the cell type specificity of the major transcription factors involved in pancreatic endocrine lineage determination, we identified transcripts encoding transcription factors expressed in islet cells. These include the pan‐endocrine marker MORF4L1, alpha cell‐specific IRX2, beta cell‐specific BMI1, and PP cell‐specific MEIS1 and ETV1. These data can provide the basis for future functional studies in the roles of these transcription factors in the pancreas and in diabetes.
In a second example, we analyzed cell type‐specific enrichment of previously characterized gene sets. The specific expression of REST‐motif‐containing genes in the endocrine cell types led us to identify the specific expression of the transcriptional repressor REST in the exocrine pancreas. REST recruits a large complex of chromatin regulators, including many factors that allow pharmacological modulation like histone deacetylases and the histone demethylase LSD1. REST repression in non‐endocrine cells activates the promoters of important beta cell transcription factors, including PAX4 and PDX1 and is a key step in reprogramming to insulin‐producing cells 23, 24, 25, 26. Future studies will show whether REST is critical in restricting ductal differentiation potential and may be a target for inducing beta cell neogenesis from duct cells.
Finally, in a third example, we focused on differences between mouse and human islets. Previous studies have noticed such differences regarding the overall architecture and specific physiological properties 7, 27. Our human islet single‐cell transcriptomes confirm that the expression of hormones and canonical transcription factors is conserved between human and mouse. However, two genes—GC and DLK1—that are among the most characteristic for human alpha and beta cells, respectively, are expressed in opposite patterns in the mouse. Both DLK1 and GC are relevant to diabetes 5, 28, and further research is necessary to dissect their roles in both human and mouse islet biology.
These examples highlight the utility of the current single‐cell transcriptome database for islet biology. In addition, we expect future growth of our resource with the addition of single‐cell expression data from diabetic donors and from islets treated with drugs and metabolites ex vivo, contributing to the utility of the presented resource for studies on all aspects of human islet biology. In summary, our study establishes a transcriptional dataset for all the cell types in human pancreatic islets with single‐cell resolution and defines distinctly human features in the patterns of alpha and beta cell‐expressed genes.
Materials and Methods
Reagents
Antibodies used in this project are directed against insulin (Sigma I8510), glucagon (Abcam ab92517), DLK1 (R&D MAB1144‐100), and GC (Abcam ab81307). The sequences of primers for actin have been published recently 29. All the fluorescently labeled secondary antibodies were purchased from Life Technologies Corporation. The reagents used for the Smart‐seq2 protocol for cDNA synthesis, amplification, and sequencing library preparation have been published recently 17.
Cell culture
Human islets were provided through the JDRF award 31‐2012‐783 (ECIT: Islet for Research program). They were from a 37‐year‐old male donor whose BMI was 22. Islets were cultured in CMRL medium (Life Technologies) supplemented with 10% FBS, 2 mM glutamine, 100 U/ml penicillin, and 100 μg/ml streptomycin. Islets were collected following overnight culture after receiving them. To disassociate islets into single cells, islets were incubated in Accutase (Life Technologies) in 37°C for 20 min, neutralized by CMRL medium. Purification of single cells was performed by flow cytometry cell sorting on a Moflo AstriosEQ (Beckman Coulter, Miami) as previously described in 16.
Immunofluorescence
The human pancreatic histology slides were ordered from Abcam (ab4611). The mouse pancreatic histology slides from 129SV mice were gifts from Patrick Collombat. The staining followed a published protocol 30. Briefly, the paraffin was removed from the tissues. Afterwards, rehydration and antigen retrieval was performed. The tissues were blocked by 3% BSA for half an hour and incubated overnight at 4°C with primary antibodies in 1:1,000 dilutions. After washing with PBST, tissues were incubated with secondary antibodies and Hoechst 33342 for half an hour. Finally, the slides were mounted and sealed with nail polish and images were taken with Leica CRT6000.
Single‐cell RNA‐seq sample and sequencing library preparation
cDNA synthesis and enrichment were performed following the Smart‐seq2 protocol as described Picelli et al 17. ERCC spike‐in RNA (Ambion) was added to the lysis buffer in a dilution of 1:1,000,000. Library preparation was conducted on 1 ng of cDNA using the Nextera XT library preparation kit (Illumina) as described Picelli et al 17. Sequencing was performed by the Biomedical Sequencing Facility at CeMM using the 50 bp single‐read setup on the Illumina HiSeq 2000/2500 platform.
qRT–PCR
After the cDNA was synthesized and amplified from single cells, quantitative PCR was performed with Power SYBR Green PCR Master Mix (Applied Biosystems) on a LightCycler 480 qPCR instrument (Roche).
Single‐cell RNA‐seq data processing
The raw sequencing data were processed using a custom bioinformatics pipeline which consists of the following main steps: (i) trimming of contaminating sequencing adapter sequences, (ii) alignment of the trimmed reads to the human transcriptome as well as genome, (iii) calculation of expression estimates for each transcript, differential expression analysis and visualization as genome browser tracks.
Trimming of adapter sequences was performed with trimmomatic (v 0.32). Only reads with a minimum length of 25 bp after adapter trimming were included in the downstream analysis. Alignment of the trimmed reads to the human transcriptome (hg19 GRCh37 ftp://ftp.ensembl.org/pub/release-74/fasta/homo_sapiens/cdna/Homo_sapiens.GRCh37.74.cdna.all.fa.gz) was performed with bowtie1 (v 1.1) 31 recording up to 100 different mapping positions for each read which takes into account that one read might originate from any of the different transcripts of one gene. Alignment to the human genome (hg19/GRCh37) was performed using Tophat (v 2.0.13) 32. These genomic alignments were purely performed for the purpose of visualization in genome browser tracks. Conversion of the alignment files to the files needed to display the data as genome browser tracks (bigWig) was performed with RSeQC (v 2.3.9) bam2wig.py followed by UCSC tools' wigToBigWig. Calculation of normalized transcript‐wise expression estimates (rpkm values) as well as differential expression analysis was performed based on the transcriptome alignments using the R (v 3.1.2) package BitSeq (v 1.10.0) 18. In order to correct for potential biases in the read distribution, the BitSeq function getExpression() was run with the “uniform” option disabled.
Quality filtering
The minimal number of reads needed to obtain reliable RPKM values as estimates of gene expression was determined by taking advantage of a synthetic RNA mix consisting of 92 RNAs covering a 106‐fold concentration range (ERCC spike‐in controls) that had been carried along through the entire library preparation and sequencing process with each single cell. Starting from ~25 reads per transcript, we observed the expected linear relationship between ERCC transcript abundance and measured RPKM values (Fig EV1B). For the purpose of noise reduction, we defined transcripts covered by less than 25 reads as “not expressed” and set their RPKM values to a minimal value. Furthermore, 6 samples showed less than 500 (arbitrary cutoff) reliably covered transcripts and were excluded from the analysis (Fig EV1A).
Grouping the single cells based on their gene expression profiles
In order to determine groups of cells with similar expression profiles and at the same time identify the primary defining genes for each group, we performed a stepwise principal component analysis (PCA) based on the quality‐filtered expression values. PCA was performed using the function prcomp() in R. The results were displayed as a biplots showing samples (cells) as dots and the most highly loaded variables (transcripts) as vectors. Biplots were constructed using a slightly modified version of the R function ggbiplot() (https://github.com/vqv/ggbiplot).
External data
External RNA‐seq raw data (next‐generation sequencing reads) for bulk samples of human acinar cells, beta cells, and islet cells were obtained from ArrayExpress (E‐MTAB‐1294: https://www.ebi.ac.uk/arrayexpress/experiments/E-MTAB-1294/samples/) 20. We used the samples HI10 (islet), HI25 (islet), HI32 (islet), HIE1 (beta cells), HIE2 (beta cells), and acinar tissue donor (acinar cells). External data were processed using the same pipeline as the single‐cell data. For the comparison of external and single‐cell as well as 500 cell data by multidimensional scaling, batch effect correction was performed using the function ComBat() of the R package sva.
Defining cell type‐specific gene expression profiles
Cell type‐specific gene expression profiles were defined by performing pairwise differential expression analysis between all previously defined groups of cells. Differential expression analysis was performed using the function estimateDE() of the R package BitSeq. For each cell type in each comparison, the specificity of the expression of each transcript was deduced under consideration of effect size (absolute difference and log2 fold change) as well as statistical significance (probability of positive log ratio, PPLR) of the measured differential expression. Technically, for each comparison, all transcripts were ranked by absolute difference in gene expression, log fold change of gene expression, and probability of positive log ratio and a combined rank for each transcripts was produced by selecting the worst (i.e., highest) of these three ranks as a representative rank. Finally, the representative ranks from all comparisons for each cell type were again combined by selecting the worst rank for each transcript (Appendix Fig S7). Therefore, the lower the combined rank, the more specific the expression of the respective transcript for the assessed cell type. To identify the cell type for which the expression of a given gene is most specific, we compared the assigned combined ranks between all cell types and selected the cell type that showed the lowest combined rank for this gene.
Assessing cross‐contamination between cell types
We assessed potential cross‐contamination between two cell types using a four‐step approach: (i) selection of cell type‐specific genes (profile genes), (ii) selection of the purest single cells for each cell type (profile cells), (iii) calculation of pure and increasingly contaminated gene expression profiles in silico (mix profiles), and (iv) identification of the mix profiles that best match the expression profile of each single cell.
As profile genes, we selected all genes among the top 500 cell type‐specific genes for each of the two cell types that showed an absolute mean expression difference of greater than 0.5 and a relative mean expression difference of at least twofold. This selection resulted in 233 profile genes for alpha cells and 252 profile genes for beta cells.
To identify the purest cells of each cell type, we calculated a weighted mean of scaled expression values (sample‐wise, scale 0 to 1; lower percentile: 0.05, upper percentile: 0.95) for both groups of profile genes for each single cell (profile scores). We used a rank‐based weighting system in order to give more power to more cell type‐specific profile genes. All single cells were then plotted according to their profile scores, and per cell type, the three cells with the most cell type‐specific profile scores (highest distance to the diagonal) were selected as profile cells (Fig EV2A).
Pure expression profiles consisting of both groups of profile genes were calculated as the mean expression values of the three profile cells. We then used these two cell type‐specific profiles to artificially construct expression profiles that represented different degrees of contamination by computationally mixing the two profiles in different ratios. Specifically, we calculated weighted means of the two pure expression values for each profile gene, with the weight increasing from 0 to 100 in steps of 1 for one of the pure profiles and at the same time decreasing from 100 to 0 for the other pure profile. This resulted in 100 profiles, two pure (cell type specific) and 98 mixed profiles (Fig EV2B).
We then calculated the Pearson correlation of each of the artificial 100 profiles with the actual expression profiles of each of the single cells (Fig EV2C) and selected the highest correlating mix profile for each single cell. These selected mix profiles represent the fraction of variance in profile gene expression that is explained by either of the two cell type‐specific profiles as well as the fraction of variance that remains unexplained (Fig EV2D and E).
Gene set enrichment analysis
Binding motif analysis was done with Gene Set Enrichment Analysis (GSEA) 33, 34. For each single cell, the most highly expressed transcript was selected as representative for the respective gene. Finally, gene expression values for each cell type were found by calculating the median across all cells of a particular cell type. These median expression values were used as input for GSEA. Genes that were not found to be expressed in any of the cell types were removed from the input dataset. Pairwise comparisons were done among all six assigned cell types except the “undefined” amounting to 30 comparisons in total. The REST‐binding motif was significantly enriched (P < 0.05, FDR < 25%) in all of the comparisons between endocrine cell types and exocrine cell types.
GWAS analysis
GWAS results relevant for diabetes (search for “diabetes”) were downloaded from the GWAS catalog (https://www.ebi.ac.uk/gwas/). We categorized the reported traits into type 1 and type 2 diabetes according to whether “1” or “2” appeared in the trait description. Each gene that was identified as significant in a GWAS (reported gene) was assigned to the cell type for which it was identified as most specific (see “Defining cell type‐specific gene expression profiles”). Because in this analysis specificity among the endocrine cells (alpha cells, beta cells, delta cells, PP cells) and among the exocrine cells (acinar cells, duct cells) was not paramount, cell type specificity was determined only in comparison with cell types of the other group. This approach was chosen in order to not dismiss genes as unspecific if they are endocrine or exocrine specific but not necessarily cell type specific. The eight MODY genes were taken from 21.
Data deposition
Sequencing datasets described in this work have been deposited in the Gene Expression Omnibus (GEO) repository under accession number GSE73727.
Author contributions
SK, CBo, MF, JL and TP conceived and designed the study; CBa and EB provided human islets; JL, AS and MF performed the experiments; TP and CBo generated next‐generation sequencing data; JK processed the raw data; JK and JL performed the bioinformatic analysis; SK, CBo, MF, JL and JK wrote the manuscript with contributions from all co‐authors.
Conflict of interest
The authors declare that they have no conflict of interest.
Supporting information
Appendix
Expanded View Figures PDF
Dataset EV1
Dataset EV2
Dataset EV3
Dataset EV4
Dataset EV5
Dataset EV6
Review Process File
Acknowledgements
We would like to thank the Core Facility Flow Cytometry at the Medical University of Vienna for their expertise and assistance with FACS sorting and the Biomedical Sequencing Facility at CeMM for next‐generation sequencing and single‐cell technology development. We thank Patrick Collombat (INSERM, Nice) for providing mouse pancreatic tissue slides. This work was funded and supported by JDRF grants 3‐SRA‐2015‐20‐Q‐R and 17‐2011‐258 (Generation of beta cells from alternative pancreatic subtypes). Human islets were provided through the JDRF awards 31‐2012‐783 and 1‐RSC‐2014‐100‐I‐X (ECIT: Islet for Research program). Research in the Kubicek laboratory is supported by the Austrian Federal Ministry of Science, Research and Economy, the National Foundation for Research, Technology, and Development, and the Marie Curie Career Integration Grant EPICAL. The single‐cell sequencing infrastructure at CeMM was supported by a New Frontiers Research Infrastructure grant from the Austrian Academy of Sciences. J.K. is Recipient of a DOC Fellowship of the Austrian Academy of Sciences.
EMBO Reports (2016) 17: 178–187
References
- 1. Collombat P, Xu X, Ravassard P, Sosa‐Pineda B, Dussaud S, Billestrup N, Madsen OD, Serup P, Heimberg H, Mansouri A (2009) The ectopic expression of Pax4 in the mouse pancreas converts progenitor cells into alpha and subsequently beta cells. Cell 138: 449–462 [DOI] [PMC free article] [PubMed] [Google Scholar]
- 2. Chera S, Baronnier D, Ghila L, Cigliola V, Jensen JN, Gu G, Furuyama K, Thorel F, Gribble FM, Reimann F et al (2014) Diabetes recovery by age‐dependent conversion of pancreatic delta‐cells into insulin producers. Nature 514: 503–507 [DOI] [PMC free article] [PubMed] [Google Scholar]
- 3. Fadista J, Vikman P, Laakso EO, Mollet IG, Esguerra JL, Taneera J, Storm P, Osmark P, Ladenvall C, Prasad RB et al (2014) Global genomic and transcriptomic analysis of human pancreatic islets reveals novel genes influencing glucose metabolism. Proc Natl Acad Sci USA 111: 13924–13929 [DOI] [PMC free article] [PubMed] [Google Scholar]
- 4. Bramswig NC, Everett LJ, Schug J, Dorrell C, Liu C, Luo Y, Streeter PR, Naji A, Grompe M, Kaestner KH (2013) Epigenomic plasticity enables human pancreatic alpha to beta cell reprogramming. J Clin Invest 123: 1275–1284 [DOI] [PMC free article] [PubMed] [Google Scholar]
- 5. Kameswaran V, Bramswig NC, McKenna LB, Penn M, Schug J, Hand NJ, Chen Y, Choi I, Vourekas A, Won KJ et al (2014) Epigenetic regulation of the DLK1‐MEG3 microRNA cluster in human type 2 diabetic islets. Cell Metab 19: 135–145 [DOI] [PMC free article] [PubMed] [Google Scholar]
- 6. Hrvatin S, Deng F, O'Donnell CW, Gifford DK, Melton DA (2014) MARIS: method for analyzing RNA following intracellular sorting. PLoS One 9: e89459 [DOI] [PMC free article] [PubMed] [Google Scholar]
- 7. Benner C, van der Meulen T, Caceres E, Tigyi K, Donaldson CJ, Huising MO (2014) The transcriptional landscape of mouse beta cells compared to human beta cells reveals notable species differences in long non‐coding RNA and protein‐coding gene expression. BMC Genom 15: 620 [DOI] [PMC free article] [PubMed] [Google Scholar]
- 8. Benitez CM, Qu K, Sugiyama T, Pauerstein PT, Liu Y, Tsai J, Gu X, Ghodasara A, Arda HE, Zhang J et al (2014) An integrated cell purification and genomics strategy reveals multiple regulators of pancreas development. PLoS Genet 10: e1004645 [DOI] [PMC free article] [PubMed] [Google Scholar]
- 9. Kubicek S, Gilbert JC, Fomina‐Yadlin D, Gitlin AD, Yuan Y, Wagner FF, Holson EB, Luo T, Lewis TA, Taylor B et al (2012) Chromatin‐targeting small molecules cause class‐specific transcriptional changes in pancreatic endocrine cells. Proc Natl Acad Sci USA 109: 5364–5369 [DOI] [PMC free article] [PubMed] [Google Scholar]
- 10. Scharfmann R, Pechberty S, Hazhouz Y, von Bulow M, Bricout‐Neveu E, Grenier‐Godard M, Guez F, Rachdi L, Lohmann M, Czernichow P et al (2014) Development of a conditionally immortalized human pancreatic beta cell line. J Clin Invest 124: 2087–2098 [DOI] [PMC free article] [PubMed] [Google Scholar]
- 11. Dorrell C, Schug J, Lin CF, Canaday PS, Fox AJ, Smirnova O, Bonnah R, Streeter PR, Stoeckert CJ Jr, Kaestner KH et al (2011) Transcriptomes of the major human pancreatic cell types. Diabetologia 54: 2832–2844 [DOI] [PMC free article] [PubMed] [Google Scholar]
- 12. Blodgett DM, Nowosielska A, Afik S, Pechhold S, Cura AJ, Kennedy NJ, Kim S, Kucukural A, Davis RJ, Kent SC et al (2015) Novel observations from next‐generation RNA sequencing of highly purified human adult and fetal islet cell subsets. Diabetes 64: 3172–3181 [DOI] [PMC free article] [PubMed] [Google Scholar]
- 13. Treutlein B, Brownfield DG, Wu AR, Neff NF, Mantalas GL, Espinoza FH, Desai TJ, Krasnow MA, Quake SR (2014) Reconstructing lineage hierarchies of the distal lung epithelium using single‐cell RNA‐seq. Nature 509: 371–375 [DOI] [PMC free article] [PubMed] [Google Scholar]
- 14. Jaitin DA, Kenigsberg E, Keren‐Shaul H, Elefant N, Paul F, Zaretsky I, Mildner A, Cohen N, Jung S, Tanay A et al (2014) Massively parallel single‐cell RNA‐seq for marker‐free decomposition of tissues into cell types. Science 343: 776–779 [DOI] [PMC free article] [PubMed] [Google Scholar]
- 15. Zeisel A, Munoz‐Manchado AB, Codeluppi S, Lonnerberg P, La Manno G, Jureus A, Marques S, Munguba H, He L, Betsholtz C et al (2015) Brain structure. Cell types in the mouse cortex and hippocampus revealed by single‐cell RNA‐seq. Science 347: 1138–1142 [DOI] [PubMed] [Google Scholar]
- 16. Farlik M, Sheffield NC, Nuzzo A, Datlinger P, Schonegger A, Klughammer J, Bock C (2015) Single‐cell DNA methylome sequencing and bioinformatic inference of epigenomic cell‐state dynamics. Cell Rep 10: 1386–1397 [DOI] [PMC free article] [PubMed] [Google Scholar]
- 17. Picelli S, Faridani OR, Bjorklund AK, Winberg G, Sagasser S, Sandberg R (2014) Full‐length RNA‐seq from single cells using Smart‐seq2. Nat Protoc 9: 171–181 [DOI] [PubMed] [Google Scholar]
- 18. Glaus P, Honkela A, Rattray M (2012) Identifying differentially expressed transcripts from RNA‐seq data with biological variation. Bioinformatics 28: 1721–1728 [DOI] [PMC free article] [PubMed] [Google Scholar]
- 19. Chiaromonte F, Miller W, Bouhassira EE (2003) Gene length and proximity to neighbors affect genome‐wide expression levels. Genome Res 13: 2602–2608 [DOI] [PMC free article] [PubMed] [Google Scholar]
- 20. Moran I, Akerman I, van de Bunt M, Xie R, Benazra M, Nammo T, Arnes L, Nakic N, Garcia‐Hurtado J, Rodriguez‐Segui S et al (2012) Human beta cell transcriptome analysis uncovers lncRNAs that are tissue‐specific, dynamically regulated, and abnormally expressed in type 2 diabetes. Cell Metab 16: 435–448 [DOI] [PMC free article] [PubMed] [Google Scholar]
- 21. Gardner DS, Tai ES (2012) Clinical features and treatment of maturity onset diabetes of the young (MODY). Diabetes Metab Syndr Obes 5: 101–108 [DOI] [PMC free article] [PubMed] [Google Scholar]
- 22. Bengtsson M, Stahlberg A, Rorsman P, Kubista M (2005) Gene expression profiling in single cells from the pancreatic islets of Langerhans reveals lognormal distribution of mRNA levels. Genome Res 15: 1388–1392 [DOI] [PMC free article] [PubMed] [Google Scholar]
- 23. Bruce AW, Donaldson IJ, Wood IC, Yerbury SA, Sadowski MI, Chapman M, Gottgens B, Buckley NJ (2004) Genome‐wide analysis of repressor element 1 silencing transcription factor/neuron‐restrictive silencing factor (REST/NRSF) target genes. Proc Natl Acad Sci USA 101: 10458–10463 [DOI] [PMC free article] [PubMed] [Google Scholar]
- 24. Johnson DS, Mortazavi A, Myers RM, Wold B (2007) Genome‐wide mapping of in vivo protein‐DNA interactions. Science 316: 1497–1502 [DOI] [PubMed] [Google Scholar]
- 25. Li HT, Jiang FX, Shi P, Zhang T, Liu XY, Lin XW, Pang XN (2012) In vitro reprogramming of rat bone marrow‐derived mesenchymal stem cells into insulin‐producing cells by genetically manipulating negative and positive regulators. Biochem Biophys Res Commun 420: 793–798 [DOI] [PubMed] [Google Scholar]
- 26. Li B, Wang S, Liu H, Liu D, Zhang J, Zhang B, Yao H, Lv Y, Wang R, Chen L et al (2011) Neuronal restrictive silencing factor silencing induces human amniotic fluid‐derived stem cells differentiation into insulin‐producing cells. Stem Cells Dev 20: 1223–1231 [DOI] [PubMed] [Google Scholar]
- 27. Bosco D, Armanet M, Morel P, Niclauss N, Sgroi A, Muller YD, Giovannoni L, Parnaud G, Berney T (2010) Unique arrangement of alpha‐ and beta‐cells in human islets of Langerhans. Diabetes 59: 1202–1210 [DOI] [PMC free article] [PubMed] [Google Scholar]
- 28. Wang G, Li Y, Li L, Yu F, Cui L, Ba Y, Li W, Wang C (2014) Association of the vitamin D binding protein polymorphisms with the risk of type 2 diabetes mellitus: a meta‐analysis. BMJ Open 4: e005617 [DOI] [PMC free article] [PubMed] [Google Scholar]
- 29. Fomina‐Yadlin D, Kubicek S, Walpita D, Dancik V, Hecksher‐Sorensen J, Bittker JA, Sharifnia T, Shamji A, Clemons PA, Wagner BK et al (2010) Small‐molecule inducers of insulin expression in pancreatic alpha‐cells. Proc Natl Acad Sci USA 107: 15099–15104 [DOI] [PMC free article] [PubMed] [Google Scholar]
- 30. Li B, Tsao SW, Li YY, Wang X, Ling MT, Wong YC, He QY, Cheung AL (2009) Id‐1 promotes tumorigenicity and metastasis of human esophageal cancer cells through activation of PI3K/AKT signaling pathway. Int J Cancer 125: 2576–2585 [DOI] [PubMed] [Google Scholar]
- 31. Langmead B, Trapnell C, Pop M, Salzberg SL (2009) Ultrafast and memory‐efficient alignment of short DNA sequences to the human genome. Genome Biol 10: R25 [DOI] [PMC free article] [PubMed] [Google Scholar]
- 32. Kim D, Pertea G, Trapnell C, Pimentel H, Kelley R, Salzberg SL (2013) TopHat2: accurate alignment of transcriptomes in the presence of insertions, deletions and gene fusions. Genome Biol 14: R36 [DOI] [PMC free article] [PubMed] [Google Scholar]
- 33. Subramanian A, Tamayo P, Mootha VK, Mukherjee S, Ebert BL, Gillette MA, Paulovich A, Pomeroy SL, Golub TR, Lander ES et al (2005) Gene set enrichment analysis: a knowledge‐based approach for interpreting genome‐wide expression profiles. Proc Natl Acad Sci USA 102: 15545–15550 [DOI] [PMC free article] [PubMed] [Google Scholar]
- 34. Mootha VK, Lindgren CM, Eriksson KF, Subramanian A, Sihag S, Lehar J, Puigserver P, Carlsson E, Ridderstrale M, Laurila E et al (2003) PGC‐1alpha‐responsive genes involved in oxidative phosphorylation are coordinately downregulated in human diabetes. Nat Genet 34: 267–273 [DOI] [PubMed] [Google Scholar]
Associated Data
This section collects any data citations, data availability statements, or supplementary materials included in this article.
Supplementary Materials
Appendix
Expanded View Figures PDF
Dataset EV1
Dataset EV2
Dataset EV3
Dataset EV4
Dataset EV5
Dataset EV6
Review Process File