Abstract
Key points
The mechanism of therapeutic efficacy of flecainide for catecholaminergic polymorphic ventricular tachycardia (CPVT) is unclear.
Model predictions suggest that Na+ channel effects are insufficient to explain flecainide efficacy in CPVT.
This study represents a first step toward predicting therapeutic mechanisms of drug efficacy in the setting of CPVT and then using these mechanisms to guide modelling and simulation to predict alternative drug therapies.
Abstract
Catecholaminergic polymorphic ventricular tachycardia (CPVT) is an inherited arrhythmia syndrome characterized by fatal ventricular arrhythmias in structurally normal hearts during β‐adrenergic stimulation. Current treatment strategies include β‐blockade, flecainide and ICD implementation – none of which is fully effective and each comes with associated risk. Recently, flecainide has gained considerable interest in CPVT treatment, but its mechanism of action for therapeutic efficacy is unclear. In this study, we performed in silico mutagenesis to construct a CPVT model and then used a computational modelling and simulation approach to make predictions of drug mechanisms and efficacy in the setting of CPVT. Experiments were carried out to validate model results. Our simulations revealed that Na+ channel effects are insufficient to explain flecainide efficacy in CPVT. The pure Na+ channel blocker lidocaine and the antianginal ranolazine were additionally tested and also found to be ineffective. When we tested lower dose combination therapy with flecainide, β‐blockade and CaMKII inhibition, our model predicted superior therapeutic efficacy than with flecainide monotherapy. Simulations indicate a polytherapeutic approach may mitigate side‐effects and proarrhythmic potential plaguing CPVT pharmacological management today. Importantly, our prediction of a novel polytherapy for CPVT was confirmed experimentally. Our simulations suggest that flecainide therapeutic efficacy in CPVT is unlikely to derive from primary interactions with the Na+ channel, and benefit may be gained from an alternative multi‐drug regimen.
Key points
The mechanism of therapeutic efficacy of flecainide for catecholaminergic polymorphic ventricular tachycardia (CPVT) is unclear.
Model predictions suggest that Na+ channel effects are insufficient to explain flecainide efficacy in CPVT.
This study represents a first step toward predicting therapeutic mechanisms of drug efficacy in the setting of CPVT and then using these mechanisms to guide modelling and simulation to predict alternative drug therapies.
Abbreviations
- APD
action potential duration
- BCL
Basic Cycle Length
- CaMKII
Ca2+/calmodulin‐dependent protein kinase
- CASQ2
calsequestrin
- CPVT
catecholaminergic polymorphic ventricular tachycardia
- DAD
delayed afterdepolarizations
- EAD
early afterdepolarizations
- ICD
implantable cardioverter defibrillator
- ISO
isoproterenol
- KO
knockout
- PKA
cAMP‐dependent protein kinase
- PMF
potential of mean force
- Po
open probability
- RyR2
ryanodine receptor
- SCaR
spontaneous Ca2+ release event
- Tc
mean closed time
- To
mean open time
- TB
tonic block
- VT
ventricular tachycardia
- WT
wild‐type
Introduction
First‐line pharmacotherapy for treating catecholaminergic polymorphic ventricular tachycardia (CPVT) patients utilizes β‐blockade at maximally tolerated doses; however, 30% of patients continue to experience arrhythmic episodes and often require mechanical implantable cardioverter defibrillator (ICD) implantation (Liu et al. 2008). β‐Blockade is associated with fatigue, diminished physical activity level and reduced quality of life, while ICD discharge is associated with significant pain and anxiety, which can induce additional episodes of electrical storm (Sears et al. 1999; Nakamura et al. 2007).
CPVT is an inherited arrhythmia syndrome arising from mutations in the ryanodine receptor (RyR2) as well as the calcium buffer and regulator of RyR2, calsequestrin (CASQ2). As its name suggests, CPVT sets up a pathological substrate for arrhythmogenesis under the influence of a catecholamine surge, which leads to bidirectional and polymorphic ventricular tachycardia. Sudden cardiac arrest and death are not uncommon for individuals harbouring CPVT mutations, and a lethal episode may present as the first manifestation of disease (Priori et al. 2002).
Flecainide, a class IC antiarrhythmic suppresses the emergence of CPVT in both mice harbouring the CASQ2(−/−) mutation and humans with either a CASQ2 or RYR2 (S412G) mutation (Watanabe et al. 2009; van der Werf et al. 2011). However, the mechanism and efficacy of flecainide remain disputed. For example, Katz et al. (2010) found little efficacy for CASQ2 subtypes, while Liu et al. suggested virtually no effect on Ca2+ handling properties, rather proposing that flecainide is effective due to its Na+ channel blocking properties (Watanabe et al. 2011; Liu et al. 2011 a). Still other studies demonstrated flecainide interaction and blockade of RyR2 (Hilliard et al. 2010; Galimberti & Knollmann, 2011; Mehra et al. 2014).
Studies of other class I antiarrhythmics showed that only those that modulated RyR2 activity demonstrated efficacy in models of CPVT, including propafenone (Hwang et al. 2011). Moreover, the type of interaction with the RyR2 was found to be significant as well; tetracaine, an RyR2 closed state blocker, failed to regulate Ca2+ properties in a CASQ2(−/−) model of CPVT (Galimberti & Knollmann, 2011). The late Na+ channel blocker ranolazine has also been studied for treatment of CPVT; however, two studies reveal conflicting results: Parikh et al. (2012) demonstrated strong interaction between ranolazine and RyR2, whereas Galimberti & Knollmann (2011) failed to demonstrate such an interaction.
Discrepant experimental observations, likely to be due to different experimental set‐ups and models of CPVT, make reconciling the aforementioned studies difficult. Thus, the focus of the present study is to use a computational modelling approach to understand the dominant mechanism(s) underlying antiarrhythmic drug success and failure. In particular, is the effect of flecainide to normalize aberrant Na+ channel activation sufficient to explain observed clinical efficacy? The latter would be particularly important, given the wealth of clinical (The Cardiac Arrhythmia Suppression Trial (CAST) Investigators, 1989; Nakamura et al. 2007) and experimental data (Moreno et al. 2011) that reveal flecainide‐induced proarrhythmia. Finally, can we use the model as a therapeutic prediction tool to optimize a multidrug regimen in CPVT?
Methods
Ethics approval
Animal use was approved by the Institutional Animal Care and Use Committee, Baylor College of Medicine, and conformed to the Guide for the Care and Use of Laboratory Animals (National Research Council, 2011).
Experimental methods
Eight animals (six R176Q/+ and two wild‐type (WT)) were studied with ECG telemetry as previously described (van Oort et al. 2010). Telemeters (Data Sciences International, St Paul, MN, USA) were implanted in the abdominal cavity with subcutaneous lead placement in a lead II configuration. Following telemetry implantation, mice were injected with subcutaneous 0.3 mg kg−1 buprenorphine. The isoflurane was discontinued and mice were placed on a warming pad with blow‐by oxygen. They were observed continuously until awake with normal breathing pattern and spontaneous movement. The mice were observed continuously for the first 2 h then daily for 7 days. Buprenophine, 0.2–0.3 mg kg−1 subcutaneous injection, was provided every 6–12 h for the first 24 h. Ambulatory telemetry recordings were obtained after all animals had at least 7 days’ recovery from surgery and a 24 h baseline recording. Repeat baseline recordings were obtained 15 min prior to all injections. Mice were injected with a single intraperitoneal (i.p.) dose of adrenaline (120 mg kg−1, Sigma‐Aldrich, St Louise, MO, USA) and caffeine (120 mg kg−1, Avantor Performance Materials, Center Valley, PA, USA) in sterile saline followed by continuous 24 h telemetry recordings. After a 7 day wash‐out period, all mice underwent repeated injections with pretreatment. Baseline ECG telemetry was recorded for 15 min. Separate i.p. injections were given of flecainide (12 mg kg−1, Sigma‐Aldrich), metoprolol (10 mg kg−1, Sigma‐Aldrich) and KN‐93 (30 μmol kg−1, Calbiochem). All drugs were mixed in sterile water. After 30 min, mice were injected with a single i.p. dose of adrenaline (2 mg kg−1) and caffeine (120 mg kg−1). Following injection of adrenaline and caffeine, the mice were monitored by telemetry for a total of 8 h. Data collection was performed using Dataquest A.R.T. version 4.31 (Data Sciences International, St Paul, MN, USA). Off‐line analysis was performed by ECG Auto analysis version 3.1 (EMKA technologies, Falls Church, VA, USA).
Molecular dynamics and free energy simulations
Force‐field parameters for flecainide were developed using the general automated atomic model parameterization (GAAMP) server developed by Huang & Roux (2013). Briefly, all geometry optimization, charge fitting and torsional parameter fitting were done using B3LYP functional at the 6–31G*(2d,2p) level of theory. Umbrella sampling simulations for partitioning of the neutral and cationic forms of flecainide into model POPE bilayer (128 lipids) were performed using a protocol described previously by Li et al. (2008). Harmonic constraints of 5 kcal (mol Å2)−1 were applied to the drug's centre of mass along the reaction coordinate spanning 62 Å from −31 Å to 31 Å normal to the membrane plane. We used five starting conformations for the drug and 124 windows spaced every 0.5 Å to describe drug partitioning into the bilayer. A flat‐bottomed cylindrical restraint with R = 15 Å was used to confine drug in the xy plane along the reaction coordinate. It allows for good sampling in a lateral plane. Each potential of mean force (PMF) window was equilibrated for 2.5 ns in the presence of restraining potential and then subjected to a 5 ns production run. The resulting 1D PMF was reconstructed with the weighted histogram analysis method (WHAM) (Roux, 1995). The WHAM convergence tolerance was set at 0.0001 kcal mol−1. We used symmetrized density to compute resulting PMFs. The statistical uncertainties were estimated by separating the data into seven blocks and were found to be within ±1.5 kcal mol−1 for neutral and charged forms of flecainide, respectively.
Computational ventricular myocyte models
Briefly, we developed mouse and rabbit in silico models of catecholaminergic polymorphic ventricular tachycardia (CPVT) by ‘knocking out’ the SR Ca2+ buffer calsequestrin (Kornyeyev et al. 2012) in the Morotti–Grandi mouse cardiac cell model (Morotti et al. 2014) and in the Soltis–Saucerman rabbit cardiac cell model (Soltis & Saucerman, 2010), respectively. Flecainide interactions with the ryanodine receptor were modelled assuming open state associations (Hilliard et al. 2010). We also incorporated the model of the cardiac Na+ channel and I Kr and their interaction with flecainide as previously (Moreno et al. 2011, 2013). We utilized the Morotti–Grandi computational model for mouse (Morotti et al. 2014) and the Soltis–Saucerman computational model for rabbit (Soltis & Saucerman, 2010), which included all the relevant components required for a detailed analysis, including accurate cellular electrophysiology, Ca2+ handling (Shannon et al. 2004) and the cAMP‐dependent protein kinase (PKA) (Saucerman et al. 2003) and Ca2+/calmodulin‐dependent protein kinase (CaMKII) (Soltis & Saucerman, 2010) phosphorylation pathways. The computational model for flecainide interaction with the cardiac Na+ channel is from (Moreno et al. 2011), with adaptations designed to recreate the CPVT phenotype and flecainide's interaction with the RyR2, informed and validated by experimental data (Hilliard et al. 2010; Hwang et al. 2011).
Wild‐type Na+ channel models and inclusion of drug binding
The wild‐type drug‐free Na+ channel model was used as previously described (Moreno et al. 2013). The Na+ drug‐channel model parameters for the on‐ and off‐rates of flecainide, ranolazine and lidocaine are taken from experiments where available. These include diffusion rates that indicate drug on‐rates ‘k on’ = [drug] × D (diffusion rate) and affinities (K d) to discrete conformations that determine drug off‐rates ‘k off’ = K d × D (diffusion rate). Rates were also constrained by experimental data (described in detail below) and microscopic reversibility as in Colquhoun et al. (2004). The transition rates are given in Table 1.
Table 1.
Markov model transition rates (ms−1) for Drug free WT Na+ channel
| States of Markov model | Rate constants |
|---|---|
| IC3 →IC2, C3→C2, BC3→BC2 | α11 = 8.5539/(7.4392e‐2*exp(‐V/17.0)+2.0373e‐1*exp(‐V/150)) |
| IC2→IF, C2→C1, BC2→BC1 | α12 = 8.5539/(7.4392e‐2*exp(‐V/15.0)+2.0373e‐1*exp(‐V/150)) |
| C1→O, BC1→BO | α13 = 8.5539/(7.4392e‐2*exp(‐V/12.0)+2.0373e‐1*exp(‐V/150)) |
| IC2→IC3, C2→C3, BC2→BC3 | β11 = 7.5215e‐2*exp(‐V/20.3) |
| IF→IC2, C1→C2, BC1→BC2 | β12 = 2.7574*exp(‐(V‐5)/20.3) |
| O→C1, BO→BC1 | β13 = 4.7755e‐1*exp(‐(V‐10)/20.3) |
| IC3→C3, IC2→C2, IF→C1 | α3 = 5.1458e‐6*exp(‐V/8.2471) |
| C3→IC3, C2→IC2, C1→IF | β3 = 6.1205*exp(V/13.542) |
| O→IF | α2 = 13.370*exp(V/43.749) |
| IF→O | β2 = (α13* α2* α3)/(β13* β3) |
| O→IS | αx = 3.4229e‐2*α2 |
| IS→O | βx = 1.7898e‐2*α3 |
| C3, C2, C1, O → BC3, BC2, BC1, BO | μ1 = 2.0462e‐7 |
| BC3, BC2, BC1, BO → C3, C2, C1,O | μ2 = 8.9731e‐4 |
Flecainide
The flecainide model was used as previously described (Moreno et al. 2011), but now includes a drug‐bound bursting regime (drug binding to red states as indicated in Scheme 1; Tope 8 states are ‘normal’ gating mode, while red states indicate burst mode). Rate constants in the upper (normal mode) states are from
Scheme 1
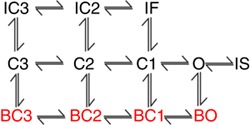
Moreno et al. (2011). Bursting state affinity for the charged form of flecainide was initially set at the value found by assuming the affinity of tonic block of late I Na was equal to K d at −100 mV. The value for K d,0 was then calculated and used as an initial value in the optimization. For example, the affinity of tonic block (TB) I Na,L for WT is ∼44 μM (Nagatomo et al. 2000); if that value is assumed to equal K d,−100mV, K d,0,bursting was initially set at 3.202 μM (e.g. the K d,0,bursting that would give K d,−100mV,bursting = 44 μM). The optimized K d,0,bursting was 95.2165 μM. Full parameters are given in Table 2.
Table 2.
Markov model transition rates (ms−1) for Flecainide
| Parameter Name | Value |
|---|---|
| kon = kclosed, on | [D+]*Diffusion |
| koff = kclosed, off | kd, open *Diffusion; (kdopen = 11.2e‐6*exp(‐0.7*V*F/R*T)) |
| kbursting, on = kclosed bursting, on | [D+]*Diffusion |
| kbursting, off = kclosed bursting, off | kdBursting,Open *Diffusion; (kdBursting,Open = 95.2165e‐6*exp(‐0.7*V*F/R*T)) |
| kneutral, on | [D]*Diffusion |
| kneutral, off | 400e‐6*Diffusion |
| kneutral, inactivated, on | kneutral, on/2 |
| kneutral, inactivated, off | 5.4e‐6*Diffusion |
| kneutral, closed, on | kneutral, on/2 |
| kneutral, closed, off | 800e‐6*Diffusion |
| Diffusion | 5500 M−1ms−1 |
| States of Markov model | Rate constants |
| D+IC3 →D+IC2, D+C3→D+C2, | α11 |
| DIC3 →DIC2, DC3→DC2 | |
| D+IC2→D+IF, D+C2→D+C1, | α12 |
| DIC2→DIF, DC2→DC1 | |
| D+IC2→D+IC3, D+C2→D+C3, | β11 |
| DIC2→DIC3, DC2→DC3 | |
| D+IF→D+IC2, D+C1→D+C2, | β12 |
| DIF→DIC2, DC1→DC2 | |
| D+O→D+IS | αx1 = 5.7839e‐5*αx |
| D+IS→D+O | βx1 = 1.6689e‐8 *βx |
| DO→DIS | αx2 = 2.6126e‐1 *αx |
| D+C1→D+O | α13c = 3.6324e‐3*α13 |
| DC1→DO | α13n = 2.6452e+0*α13 |
| D+O→D+C1 | β13c = (β13*kcon*koff*α13c)/(kon*kcoff*α13) |
| DO→DC1 | β13n = (β13*kc_on*α13n*k_off)/(kc_off*α13*k_on) |
| DIS→DO | βx2 = (βx*k_on* αx2*ki_off)/(αx*ki_on*k_off) |
| D+O→D+IF | α22 = 1.4847e+3 *α2 |
| DO→DIF | α_22 = 4.2385e+1 *α2 |
| D+IF→D+O | β22 = (α13c* α22* α33)/(β13c* β33) |
| DIF→DO | β_22 = (α_33*α13n*α_22)/(β_33*β13n) |
| D+C3→D+IC3, D+C2→D+IC2, D+C1→D+IF | β33 = 1.7352e‐6 *β3 |
| DC3→DIC3, DC2→DIC2, DC1→DIF | β_33 = 2.1181e+0*β3 |
| D+IC3→D+C3, D+IC2→D+C2, D+IF→D+C1 | α33 = 6.7505e‐5 *α3 |
| DIC3→DC3, DIC2→DC2, DIF→DC1 | α_33 = (ki_off* α3*kc_on* β_33)/(ki_on*kc_off* β3) |
| D+IF→D+IT | α44 = 2.4135* α2 |
| D+IT→D+IF | β44 = 4.9001e‐2 *α3 |
| DIF→DIT | α_44 = 1.0326e‐3 *α2 |
| DIT→DIF | β_44 = 2.1378e‐2 *α3 |
Ranolazine
The ranolazine–Na+ channel drug interaction model was as previously described (Moreno et al. 2013) and the transition rates are given in Table 3.
Table 3.
Markov model transition rates (ms−1) for Ranolazine
| Parameter Name | Value |
|---|---|
| kon = kclosed, on | [D+]*Diffusion |
| koff = kclosed, off | kd, open *Diffusion; (kdopen = 100.5e‐6*exp(‐0.7*V*F/R*T)) |
| kbursting, on = kclosed bursting, on | [D+]*Diffusion |
| kbursting, off = kclosed bursting, off | kdBursting,Open *Diffusion; (kdBursting,Open = 1.5012e‐6*exp(‐0.7*V*F/R*T)) |
| kneutral, on | [D]*Diffusion |
| kneutral, off | 400e‐6*Diffusion |
| kneutral, inactivated, on | kneutral, on |
| kneutral, inactivated, off | 5.4e‐6*Diffusion |
| kneutral, closed, on | kneutral, on |
| kneutral, closed, off | 800e‐6*Diffusion |
| Diffusion | 5500 M−1ms−1 |
| States of Markov model | Rate constants |
| D+IC3 →D+IC2, D+C3→D+C2, | α11 |
| DIC3 →DIC2, DC3→DC2 | |
| D+IC2→D+IF, D+C2→D+C1, | α12 |
| DIC2→DIF, DC2→DC1 | |
| D+IC2→D+IC3, D+C2→D+C3, | β11 |
| DIC2→DIC3, DC2→DC3 | |
| D+IF→D+IC2, D+C1→D+C2, | β12 |
| DIF→DIC2, DC1→DC2 | |
| D+O→D+IS | αx1 = 4.4923e+3 *αx |
| D+IS→D+O | βx1 = 2.7031e‐1 *βx |
| DO→DIS | αx2 = 1.4947e+1 *αx |
| D+C1→D+O | α13c = 3.6811*α13 |
| DC1→DO | α13n = 2.3570e+2*α13 |
| D+O→D+C1 | β13c = (β13*kcon*koff*α13c)/(kon*kcoff*α13) |
| DO→DC1 | β13n = (β13*kc_on*α13n*k_off)/(kc_off*α13*k_on) |
| DIS→DO | βx2 = (βx*k_on* αx2*ki_off)/(αx*ki_on*k_off) |
| D+O→D+IF | α22 = 6.8705e+4 *α2 |
| DO→DIF | α_22 = 2.1182e+2 *α2 |
| D+IF→D+O | β22 = (α13c* α22* α33)/(β13c* β33) |
| DIF→DO | β_22 = (α_33*α13n*α_22)/(β_33*β13n) |
| D+C3→D+IC3, D+C2→D+IC2, D+C1→D+IF | β33 = 1.7561e‐1 *β3 |
| DC3→DIC3, DC2→DIC2, DC1→DIF | β_33 = 1.2197e‐3*β3 |
| D+IC3→D+C3, D+IC2→D+C2, D+IF→D+C1 | α33 = 4.0832e‐2 *α3 |
| DIC3→DC3, DIC2→DC2, DIF→DC1 | α_33 = (ki_off* α3*kc_on* β_33)/(ki_on*kc_off* β3) |
Lidocaine
The wild‐type lidocaine model was as previously described (Moreno et al. 2011), but now includes a drug‐bound bursting (lower 4 states) regime. Non‐bursting rates were from (Moreno et al. 2011). Bursting state affinity for the charged form of lidocaine was initially set at the value found by assuming the affinity of tonic block of late I Na was equal to K d at −100 mV. K d,0 was then calculated and used as an initial value in the optimization. For example, the affinity of TB I Na,L for WT is ∼12 μM (Fedida et al. 2006); if that value is assumed to equal K d,−100mV, K d,0,bursting was initially set at 0.80 μM (e.g. the K d,0,bursting that would give K d,−100mV,bursting = 12 μM). The optimized K d,0,bursting was 0.9810 μM. The transition rates are given in Table 4.
Table 4.
Markov model transition rates (ms−1) for Lidocaine
| Parameter Name | Value |
|---|---|
| kon = kclosed, on | [D+]*Diffusion |
| koff = kclosed, off | kd, open *Diffusion; (kdopen = 318e‐6*exp(‐0.7*V*F/R*T)) |
| kbursting, on = kclosed bursting, on | [D+]*Diffusion |
| kbursting, off = kclosed bursting, off | kdBursting,Open *Diffusion; (kdBursting,Open = 0.981e‐6*exp(‐0.7*V*F/R*T)) |
| kneutral, on | [D]*Diffusion |
| kneutral, off | 400e‐6*Diffusion |
| kneutral, inactivated, on | kneutral, on/2 |
| kneutral, inactivated, off | 3.4e‐6*Diffusion |
| kneutral, closed, on | kneutral, on/2 |
| kneutral, closed, off | 900e‐6*Diffusion |
| Diffusion | 500 M−1ms−1 |
| States of Markov model | Parameters |
| D+IC3 →D+IC2, D+C3→D+C2, | α11 |
| DIC3 →DIC2, DC3→DC2 | |
| D+IC2→D+IF, D+C2→D+C1, | α12 |
| DIC2→DIF, DC2→DC1 | |
| D+IC2→D+IC3, D+C2→D+C3, | β11 |
| DIC2→DIC3, DC2→DC3 | |
| D+IF→D+IC2, D+C1→D+C2, | β12 |
| DIF→DIC2, DC1→DC2 | |
| D+O→D+IS | αx1 = 6.3992e‐7*αx |
| D+IS→D+O | βx1 = 1.3511e+0 *βx |
| DO→DIS | αx2 = 1.3110e‐1 *αx |
| D+C1→D+O | α13c = 5.6974e‐3* α13 |
| DC1→DO | α13n = 8.4559e+1*α13 |
| D+O→D+C1 | β13c = (β13*kcon*koff*α13c)/(kon*kcoff*α13) |
| DO→DC1 | β13n = (β13*kc_on*α13n*k_off)/(kc_off*α13*k_on) |
| DIS→DO | βx2 = (βx*k_on* αx2*ki_off)/(αx*ki_on*k_off) |
| D+O→D+IF | α22 = 6.7067e‐6 *α2 |
| DO→DIF | α_22 = 1.7084e‐5 *α2 |
| D+IF→D+O | β22 = (α13c* α22* α33)/(β13c* β33) |
| DIF→DO | β_22 = (α_33*α13n*α_22)/(β_33*β13n) |
| D+C3→D+IC3, D+C2→D+IC2, D+C1→D+IF | β33 = 1.9698e‐5 *β3 |
| DC3→DIC3, DC2→DIC2, DC1→DIF | β_33 = 4.8477e+0*β3 |
| D+IC3→D+C3, D+IC2→D+C2, D+IF→D+C1 | α33 = 3.2976e+0 *α3 |
| DIC3→DC3, DIC2→DC2, DIF→DC1 | α_33 = (ki_off* α3*kc_on* β_33)/(ki_on*kc_off* β3) |
RyR2–flecainide drug‐channel interaction model development
The Shannon–Bers Markov model formulation of the RyR2 (Shannon et al. 2004) was modified to include a drug bound state DO with transitions k on = D × [drug] and k off = D × IC50,drug to and from the open state O, which represent the drug diffusing to the receptor and binding or dissociating from the channel, respectively, as done previously (Moreno et al. 2011). The diffusion rate of flecainide (Scheme 2) was estimated at 5500 M−1 ms−1 (Zhu et al. 2006).
Scheme 2
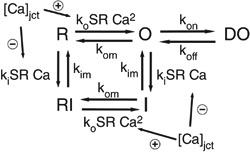
Isoproterenol‐stimulated Ca2+ waves in CASQ2 knockout (KO) CASQ2(−/−) mice were inhibited by flecainide with an IC50 of 2.0 ± 0.2 μM (Hwang et al. 2011), while other experimental preparations measured an IC50 range from 2 to 17 μM (Brunton et al. 2010; Hilliard et al. 2010; Hwang et al. 2011; Mehra et al. 2014). Drug binding was modelled as open‐state block, using experimental data for drug affinity to the open state to determine off and on rates, respectively. We also predicted cases for variable flecainide IC50 = 3, 4, and 5 μM shown in Fig. 1. We examined the cases of 3, 4 and 5 μM of IC50 acting on each of the targets under the influence of 1 μM isoproterenol, over a range of clinically relevant pacing frequencies, from 0.5 to 3.0 Hz (30–180 beat min−1; Leenhardt et al. 1995), at 0.01 Hz increments.
Figure 1. Testing IC50 of flecainide in the cell model for INa, RyR2 and both targets in combination .
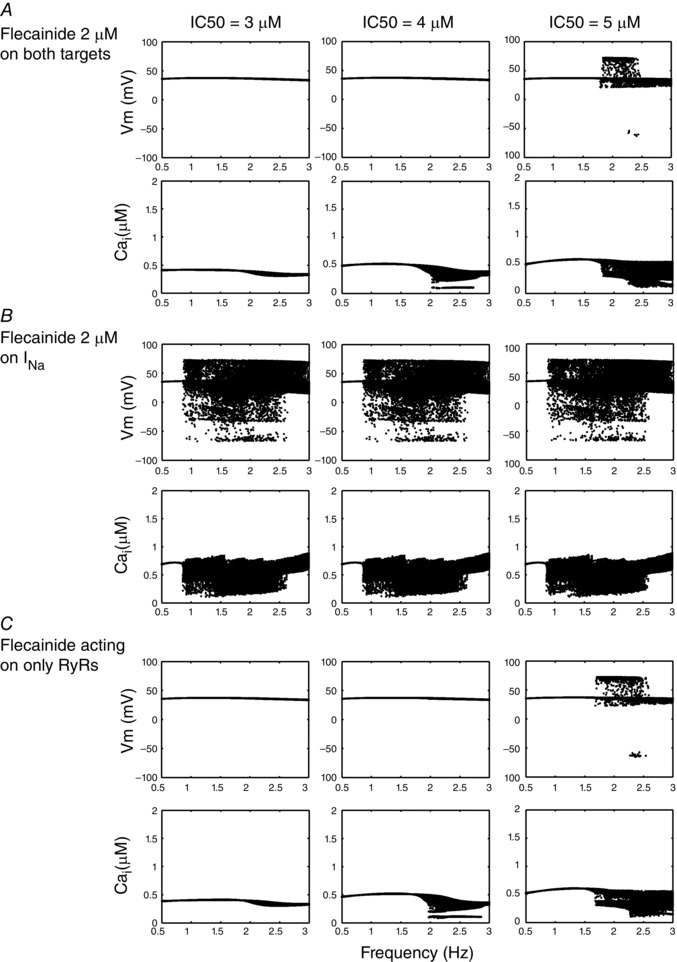
Voltage dynamics is shown for each IC50 case, and the voltage and Ca2+ transient maxima are binned for each pacing frequency between 0.5 and 3 Hz during the second half of a 2 min simulation time course. A, CASQ2(−/−) myocytes with 3, 4 and 5 μM IC50 effects on both Na+ channels and RyRs. B, flecainide interaction with just Na+ channels. C, flecainide concentrations acting on only RyRs.
We assumed rapid partitioning of flecainide into its charged (98% at pH 7.4, pK a = 9.3) and neutral (2%) fractions (Liu et al. 2003), diffusion of the neutral component across the membrane, and equilibration on the cytosolic side, resulting in equimolar concentrations of flecainide inside and outside of the cell, consistent with experimental observations and the mechanism of flecainide's interaction with the Na+ channel (Liu et al. 2003). The kinetics of the state transitions for the channel are adjusted for temperature by a Q 10 factor of 1.5 (Sitsapesan et al. 1991). The presence of a 20% RyR subconductance state in response to flecainide binding of the channel (Hilliard et al. 2010) is modelled at the whole cell level as a reduction to 20% maximal conductance of the channel.
In single channel simulations mimicking the experimental conditions tested, the IC50 of 16 μM was used to validate the model. It is important, however, to justify the use of the 2 μM IC50 value used in cellular and tissue level simulations. The 16 μM IC50 value corresponds to single channel conditions (Hilliard et al. 2010), which does not account for the influence of coupling between adjacent ryanodine receptors on the kinetics of the channel (Marx et al. 2001). Similarly, the IC50 value of 16 μM for spark inhibition in permeabilized myocytes cannot be used, due to the constant maintenance of [Ca2+] in those experiments – the high concentration of Ca2+ used to elicit consistent Ca2+ sparks in experiments is static and is an unrealistic representation of paced myocytes (Galimberti & Knollmann, 2011). The high external Ca2+ concentration used would cause a higher IC50 than that seen using a lower Ca2+ concentration in the intact myocyte used to generate Ca2+ waves during diastole, due to a persistently overactive ryanodine receptor by constitutive cytosolic activation.
Thus the measured IC50 for wave inhibition in the isoproterenol‐stimulated Ca2+ waves in CASQ2(−/−) mice (IC50 = 2.0 ± 0.2 μM; Hwang et al. 2011), was used, since it reflects realistic conditions for our model system. Its weakness is that the IC50 does not separate out external contributions to the IC50, such as lowered junctional Ca2+ by I NCX activity via lowered [Na+]. Experiments in paced rat myocytes indicate that this contribution may significantly influence flecainide's ability to inhibit spontaneous Ca2+ wave formation, and thus future work will need to evaluate whether the contribution of I NCX regulation of Na+ is indeed significant in influencing flecainide's efficacy (Sikkel et al. 2013).
The parameters are presented in Table 5.
Table 5.
Parameters for SR Ca2+ release
| Parameter Name | Value / Units |
|---|---|
| kon | [D+]*Diffusion |
| koff | 0.011 |
| Diffusion | 5500 M−1ms−1 |
| ks | 25 ms−1 |
| koCa | 10 mM−2ms−1 |
| kom | 0.06 ms−1 |
| kiCa | 0.5 mM−1ms−1 |
| kim | 0.005 ms−1 |
| EC50‐SR | 0.45 mM |
| MaxSR | 15 |
| MinSR | 1 |
| HSR | 2.5 |
| KSRleak | 5.348e‐6 ms−1 |
Simulation of I Kr blockade
To simulate the effects of flecainide or ranolazine on I Kr current, we decreased the peak conductance, G IKr in a concentration dependent fashion using a concentration–response relationship with a Hill coefficient of 1 (n = 1) as follows:
where G IKr,max is the nominal conductance value from the given rabbit ventricular myocyte model (Soltis & Saucerman, 2010) and IC50 is the concentration of drug that produces a 50% inhibition of I Kr current. The IC50 values for the drug to inhibit I Kr current are for flecainide 1.5 μM (Belardinelli et al. 2013) and for ranolazine 12 μM (Rajamani et al. 2008).
Simulation of effect of metoprolol on β‐adrenergic activity and CaMKII blocking effects of KN‐62
We modelled the β1 and CaMKII blocking effects of metoprolol (IC50 = 105 nM) and KN‐62 (IC50 = 468 nM) as a competitive inhibitor of β‐agonist and limiter of free endogenous total CaMKII, respectively. Dose–response curves (Fig. 2) for the effect of metoprolol on β‐adrenergic activity were extracted from an E max experimental model (Abrahamsson et al. 1990), where the percentage inhibition of E max represents the fraction of ISO inhibition. In preliminary tests of the computational model involving myocyte pacing, 50 nM ISO achieved 98% of the maximal response to agonist; ISO inhibition was therefore modelled as a percentage of 50 nM applied ISO. Thus, in Fig. 2 A, percentage β1‐receptor blockade refers to the percentage of β1‐receptors that are competitively blocked by metoprolol. KN‐62 was modelled as an inhibitor of endogenously available CaMKII (Tokumitsu et al. 1990). Dose–response data were obtained from Davies et al. (2000) and fitted to a percentage block of CaMKII for given doses of KN‐62; similarly, percentage CaMKII inhibition in Fig. 2 B refers to the percentage of endogenous CaMKII that is inhibited by KN‐62. Data are from Abrahamsson et al. (1990) (metoprolol) and Tokumitsu et al. (1990) (KN‐62). We applied the E max model from Abrahamsson et al. (1990) to determine our dose–response relation as follows:
where E max = 100%, and C is the metoprolol or KN‐62 concentration.
Figure 2. Dose–response curves for metoprolol on β1‐receptor blockade and KN‐62 on CaMKII inhibition .
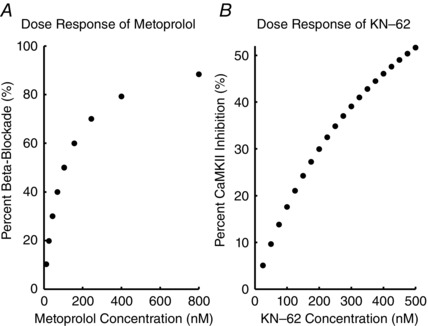
A, dose–response curves for the effect of metoprolol on β‐adrenergic activity were extracted from an experimental model (Abrahamsson et al. 1990). B, dose–response data were obtained from (Davies et al. 2000) and fitted to a percentage block of CaMKII for given doses of KN‐62.
CPVT CASQ2(−/−) model development
The CPVT phenotype was modelled via a computational CASQ2(−/−) (Knollmann et al. 2006) by modifying the Soltis–Saucerman model (Soltis & Saucerman, 2010). We set the calsequestrin buffer concentration and the time derivative of the calsequestrin buffer concentration to 0. While this has no direct effect on regulating RyR2 function, it was expected to still demonstrate a functional effect on RyR2 activity because of alterations to intracellular SR Ca2+. Equations for the regulation of Na+/K+‐ATPase activity by PKA as mediated by phospholemman were incorporated from the Yang–Saucerman model (Yang & Saucerman, 2012). Our previously validated Na+ channel (Moreno et al. 2011) and modified RyR2 channel were inserted into the cellular model (Soltis & Saucerman, 2010).
Stochastic single channel RyR2 simulations
Individual RyR2 channels were modelled stochastically in Monte Carlo simulations using Gillespie's algorithm (Gillespie, 1977). Parameters were constrained by fixed concentrations of flecainide (0 and 50 μM), luminal Ca2+ (1 mM), and junctional Ca2+ (0.1 μM), mimicking experimental conditions (Hwang et al. 2011). Stochastic error diminishes over a large number of simulations, approaching the expected mean open time (T o), mean closed time (T c), and open probability (P o) as derived by the methods of Colquhoun & Hawkes (1981).
Cellular and tissue simulations
Mouse ventricular myocyte model
The I Na channel was replaced in the Morotti–Grandi mouse cardiac cell model (Morotti et al. 2014) with our published Markov model (Moreno et al. 2013). We then adjusted three transition rates for the mouse model to simulate the mouse I Na kinetics as follows: O→C1, β13 × 0.45; O→IF, α2 × 0.45; O→IS, αx × 0.45. Virtual myocytes were paced using a −9.5 pA pF−1 current stimulus for 5 ms in single cells for 150 s at 2 Hz pacing frequency in the presence and absence of drug and 0.5 μM isoproterenol (ISO).
Rabbit ventricular myocyte model
Virtual whole cells and tissues (both WT and KO) were allowed to ‘rest’ without external stimuli for 10 min to establish initial conditions. Cells were then virtually paced (using a −80 pA pF−1 current stimulus for 0.5 ms in single cells and −500 pA pF−1 stimulus for 2.0 ms in tissues) for 5 min at specific pacing frequencies in the absence of drug or agonist. Cells were finally paced for an additional 2 min in the presence and absence of drug and 1 μM ISO. Parameters including upstroke velocity, action potential duration (APD) and the number of early and delayed afterdepolarizations (EADs and DADs) were tracked over the course of each simulation.
One‐dimensional (1D) tissue was simulated as a fibre of 165 cells (1.65 cm) (Glukhov et al. 2010) with reflective boundary conditions. Transmural heterogeneity was incorporated into the tissue by a linear decrease to 25% maximal I to conductance (Myles et al. 2010), corresponding to a linear transition from epicardial to endocardial tissue (Fedida & Giles, 1991) and an APD gradient of 205–224 ms. The diffusion coefficient Dx was set to 0.002 cm2 ms−1 to establish a conduction velocity of 61–73 cm s−1 (epicardium–endocardium in WT conditions) (Brugada et al. 1990).
Code for simulations and analysis was written in C++ and MATLAB 2014a (The Math Works, Inc., Natick, MA, USA). Code was run on an Apple Mac Pro machine with two 2.93 GHz 6‐Core Intel Xeon processors, and an HP ProLiant DL585 G7 server with a 2.3 GHz 48‐core AMD Opteron processor. Code was compiled with the Intel ICC compiler 2013. Numerical results were visualized using MATLAB R2014b. All source code used in this paper is available online or can be obtained by emailing ceclancy@ucdavis.edu.
Results
We modelled the interaction between flecainide and RyR2 by modifying the Shannon–Bers model of the cardiac RyR2 channel (Shannon et al. 2004) (see Methods) that reproduces gain and fractional SR Ca2+ release, and includes regulation by both luminal and junctional Ca2+ fractions. Based on experimental data, drug binding was modelled as voltage‐independent open‐state block that results in a ∼20% subconductance state (Hilliard et al. 2010; Hwang et al. 2011; Mehra et al. 2014). A different recent study suggested that flecainide does not block the RyR (Bannister et al. 2015). These effects are also included in the cellular level simulations as no RyR block by flecainide.
This assumption resulted in predictions of drug effects that were consistent with experiments in single channel lipid bilayer studies (Hilliard et al. 2010). Stochastic Monte Carlo simulations reveal intermittent closures that interrupt channel openings, corresponding to flecainide binding and unbinding the open‐state (Fig. 3 A) (Hwang et al. 2011). Figure 3 B shows model predictions (lines) closely match experimental measurements (symbols) of drug concentration‐dependent effects on channel open probability (left) and channel mean open time (middle) (Hwang et al. 2011). Mean closed time displays no dose dependence in this binding scheme, as in experimental findings (Fig. 3 B, right). We modelled flecainide interactions with the Na+ and hERG K+ channel as described previously (Moreno et al. 2011) (Moreno et al. 2013).
Figure 3. Simulated interaction of flecainide with single ryanodine receptors .
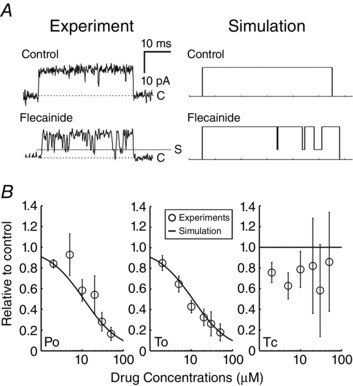
A, experimental single RyR channels in bilayers (left) compared with stochastic model simulations (right), in the absence (top) and presence (bottom) of 50 μM flecainide. B, measured and simulated dose dependence of flecainide on channel open probability (P o, left), mean open time (middle, T o), and mean closed time (T c). Experimental data points (circles) and simulated results from ∼1,000,000 stochastic openings and closures at concentrations as indicated (lines). Experimental data are from Hilliard et al. (2010 and Hwang et al. (2011).
We generated a virtual calsequestrin knockout mouse cardiac myocte (CASQ2(−/−)) by setting the concentration of CASQ to zero in the Morotti–Grandi model of the mouse ventricular myocyte, which includes the β‐adrenergic signalling and CaMKII pathways (Morotti et al. 2014). We then predicted the effects of the virtual CASQ2(−/−) on electrical and Ca2+ dynamics. Figure 4 A–D shows action potentials (APs) (top) and Ca2+ transients (bottom) of cells paced at a frequency of 2 Hz. As expected, the Ca2+ transient amplitude increases upon application of 0.5 μM isoproterenol (ISO) (Fig. 4 B). In the absence of ISO, CASQ2(−/−) myocytes demonstrate reduced but intact Ca2+ transients and APs compared with control (compare Fig. 4 C to Fig. 4 A) consistent with experimental observations in CSQN mutant and CSQN underexpression mouse myocytes (Viatchenko‐Karpinski et al. 2004; Terentyev et al. 2008; Gyorke & Terentyev, 2008). Consistent with multiple experimental observations, application of 0.5 μM ISO induces spontaneous Ca2+ release events (red arrows Fig. 4 D, bottom), which drive afterdepolarizations (Knollmann et al. 2006; Gyorke & Terentyev, 2008; Hilliard et al. 2010; Liu et al. 2013). Following development of the virtual mouse model of CPVT, which is validated by many published experimental data, we generated a virtual calsequestrin rabbit knockout (CASQ2(−/−)). This approach allows for cross species testing, e.g. to predict how larger animals (more ‘human‐like’) would respond, and to also look for model independence of our findings.
Figure 4. An in silico calsequestrin (CASQ2(−/−)) knockout model recapitulates the CPVT phenotype .
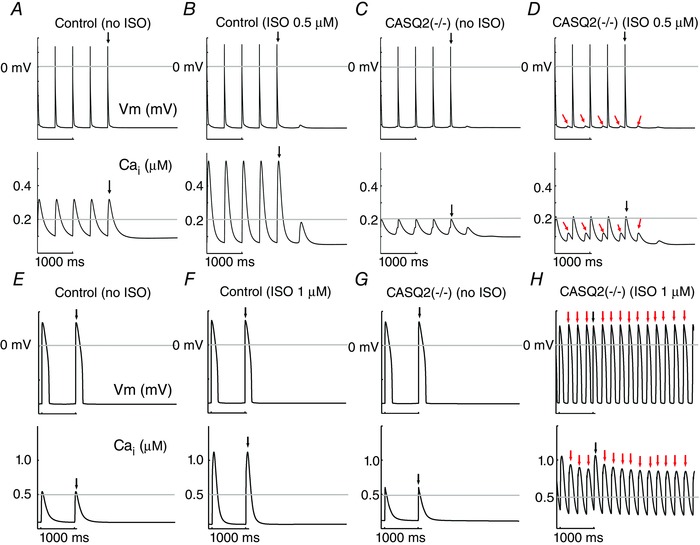
In each panel, simulated membrane voltage (top) and intracellular Ca2+ transients (bottom) are shown during 2 Hz pacing in the mouse virtual myocyte (A–D) and 1 Hz in the rabbit virtual myocyte (E–H). A, simulated control mouse ventricular myocytes. B, control mouse cell with 0.5 μM simulated isoproterenol (ISO). C, simulated CASQ2 knockout mouse. D, 0.5 μM ISO applied to the simulated CASQ2 knockout mouse. E, simulated control rabbit ventricular myocytes. F, control rabbit cell with 1 μM simulated isoproterenol (ISO). G, simulated CASQ2 knockout rabbit. H, 1 μM ISO applied to the simulated CASQ2 knockout rabbit. Red arrows indicate spontaneous triggers. Black arrow is the final stimulus.
The rabbit model was constructed by setting the concentration of CASQ to zero in the Soltis–Saucerman model of the rabbit ventricular myocyte, which contains the β‐adrenergic signalling and CaMKII pathways. Figure 4 E–H shows simulated rabbit APs (top) and Ca2+ transients (bottom) of control cells paced at a frequency of 1 Hz. As observed in the mouse model, the Ca2+ transient amplitude increases upon application of 1 μM ISO (Fig. 4 F). In the absence of ISO, CASQ2(−/−) myocytes demonstrate morphologically similar Ca2+ transients and APs to control (compare Fig. 4 G to Fig. 4 E). No differences were found with other pacing frequencies. Consistent with experimental observations (Kornyeyev et al. 2012), application of 1 μM ISO induces spontaneous Ca2+ release events (red arrows Fig. 4 H, bottom), which drive depolarizations that trigger APs (red arrows in Fig. 4 H, top).
Recent publications have suggested that flecainide may be insufficiently concentrated inside the cell to affect the RyR directly (Liu et al. 2011 a, 2012). Thus, we employed a novel atomic scale modelling approach to compute free energy profiles for flecainide transport in the extracellular, membrane and intracellular compartments (Fig. 5 A).
Figure 5. Atomic scale prediction of flecainide transport across the membrane .
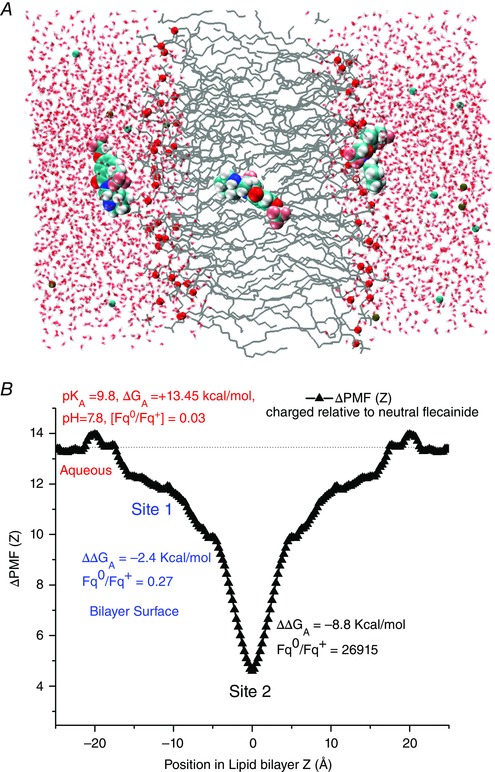
A, visualization of flecainide transport. B, the difference between the potentials of mean force (ΔPMF (Z)) across the bilayer, and position‐dependent free energies for charged and neutral flecainide (ΔΔG A) at the membrane interface (site 1) and hydrophobic core of the bilayer (site 2). Relative fractions of neutral to charged drug (Fqo/Fq+) in the aqueous solution (red), site 1 (blue) and site 2 (black) are shown.
With a pK a value of 9.8, 97% of flecainide will exist in the protonated form at physiological pH. However, recent studies suggest that the hydrophobic environment of the lipid bilayers promotes stabilization of the neutral form, allowing for flecainide entry upon deprotonation. To assess feasibility of this mechanism, we determined the underlying thermodynamics governing flecainide movement on the surface and in the hydrophobic core of the membrane and the barriers associated with transport of cationic or neutral forms.
Force (PMF) (or Potential mean force free energies (ΔG A)) for partitioning of charged and neutral flecainide
Both forms of flecainide display preference for interfacial partitioning with stabilization of about 8 and 11 k B T for charged and neutral flecainide, respectively. The simulations show that concentration of neutral flecainide will increase substantially on the surface as compared to the bulk phase and will be predominant in the hydrophobic core of the bilayer (site 2). There is a substantial penalty for protonated drug to cross a hydrophobic core, although it will act as a sink for a neutral flecainide with a very small crossing barrier for the drug (∼2k B T not shown).
The difference between the potentials of mean force (ΔPMF (Z)) across the bilayer, and position‐dependent free energies for charged and neutral flecainide (ΔΔG A) at the membrane interface (site 1) and hydrophobic core of the bilayer (site 2) are shown in Fig. 5 B. We calculated the pK a shift due to drug deprotonation upon partitioning into lipid bilayers from the difference between the position‐dependent free energies for charged and neutral flecainide (ΔΔG A).
ΔpK a values are also indicated as relative fractions of neutral to charged drug (Fqo/Fq+) in the aqueous solution (red), site 1 (blue) and site 2 (black) in Fig. 5 B. The pK a shift is close to zero in the bulk (as expected) and then sharply drops at site 1. This indicates that flecainide will readily lose its proton in the membrane environment.
Is diffusion of neutral flecainide sufficient for effective accumulation? We estimated diffusion coefficients from local friction factors along the reaction coordinate in free energy simulations (from fluctuations in the constraining force) (Boggara & Krishnamoorti, 2010). The diffusion coefficient for flecainide was calculated as ∼4.9 × 10⁻⁷ cm2 s−1 in the bilayer, about an order of magnitude lower than bulk water similar to previously reported values for various drugs (Boggara & Krishnamoorti, 2010). Flecainide is predicted to undergo extremely rapid equilibration.
We next predicted the effects of flecainide on control and CASQ2(−/−) rabbit ventricular myocyte models for clinically relevant frequencies at a high therapeutic dose of flecainide (2 μM). In order to map the action potential (AP) dynamics–frequency relationship for the CPVT CASQ2(−/−) with flecainide, the maximum values of the voltage following the upstroke of the AP were collected during the second half of a 2 min simulation and binned vertically for each constant pacing frequency; for clarity, only steady state behaviour is shown (t = 60–120 s). In the control simulation there was a stimulus to AP ratio of 1:1 (Fig. 6 A). The time course of AP at 2 Hz (grey line) is shown on the left (Fig. 6 A, C, E, G and I). The peak of the calcium transient was similarly monitored (control – Fig. 6 B), with the time course of the calcium transient at 2 Hz (grey line) in the left of each of the right panels (Fig. 6 B, D, F, H and J).
Figure 6. Model prediction of flecainide mechanism .
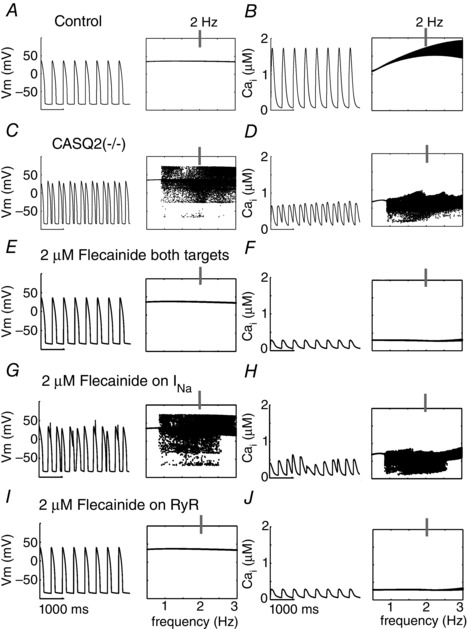
The time course of action potentials is in left columns and calcium transients (CaTs) in right columns at 2 Hz. Voltage and Ca2+ transient dynamics over a range of physiological frequencies is shown to the right of each simulated time course at 2 Hz: the voltage maxima are binned for each pacing frequency between 0.5 and 3 Hz during the second half of a 2 min simulation time course. A and B, control APs, CaTs. C and D, CASQ2(−/−) APs, CaTs. E and F, CASQ2(−/−) myocyte APs and CaTs with high clinical dose (2 μM) flecainide effects on both Na+ channels and RyRs. G and H, high dose flecainide acting only on Na+ channels. I and J, high dose flecainide (2 μM) on only RyRs.
In the absence of drug, CASQ2(−/−) myocytes displayed triggered APs at frequencies greater than 0.95 Hz (notice the horizontal line in the plot at frequencies slower than 0.95 Hz, corresponding to a stimulus to AP ratio of 1:1), when challenged by 1 μM ISO (Fig. 6 C). Pathological electrical activity was preceded by spontaneous Ca2+ release events from the RyR2 (Fig. 6 D), which, when resulting in a sufficient release of Ca2+, can integrate in time to induce electrogenic forward‐mode sodium–calcium exchange current (3 inward Na+/1 outward Ca2+) and depolarize the cell, ultimately activating I Na.
Application of a high therapeutic dose flecainide (2 μM), acting on the rabbit RyR2, I Kr and I Na rectified the electrical activity at all frequencies tested (Fig. 6 E). The electrical stability coincided with suppression of diastolic Ca2+ release, but was also accompanied by a markedly reduced Ca2+ transient (Fig. 6 F). The therapeutic range of plasma concentrations for flecainide is 0.5–2.0 μM (Brunton et al. 2010). We examined the cases of 0.5, 1.0 and 1.5 μM flecainide acting on each of the targets under the influence of 1 μM isoproterenol, over a range of clinically relevant pacing frequencies, from 0.5 to 3.0 Hz (30–180 beats min−1; Leenhardt et al. 1995), at 0.01 Hz increments (Fig. 7). Low dose flecainide (0.5 μM) failed to suppress Ca2+ alternans, a marker of proarrhythmia (Chudin et al. 1999), which emerged at frequencies greater than 1.6 Hz and suggests incomplete efficacy in the lower range of therapeutic dosing (Fig. 7 A).
Figure 7. Full parameter space of flecainide efficacy for INa, RyR2 and both targets in combination .
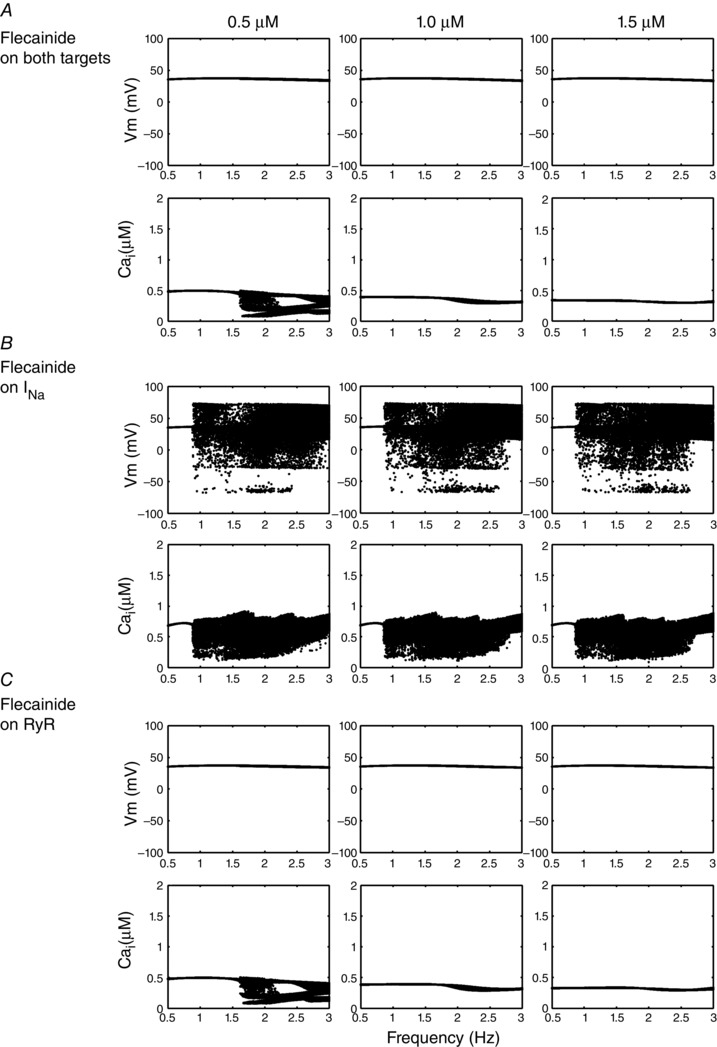
Voltage dynamics is shown for each flecainide case, and the voltage and Ca2+ transient maxima are binned for each pacing frequency between 0.5 and 3 Hz during the second half of a 2 min simulation time course. A, CASQ2(−/−) myocytes with 0.5, 1.0 and 1.5 μM flecainide effects on both Na+ channels and RyRs. B, flecainide concentrations acting on only Na+ channels. C, flecainide interaction with just RyRs.
We next simulated drug action on the Na+ current or RyR alone to determine the contributions of each target to drug efficacy. The rabbit model predicted that neither the high dose of flecainide (2 μM in Fig. 6 G and H), nor any lower concentrations, when tested on Na+ current alone, eliminated pathological activity at all pacing frequencies (Fig. 7 B). As expected from flecainide's use‐dependent blocking behaviour of I Na, higher concentrations and faster pacing frequencies eliminated some arrhythmogenic behaviour, but DADs and triggered action potentials persisted. Derangement of Ca2+ activity also persisted, and was largely unaffected by drug effects on the Na+ current (Fig. 6 H).
Selective application of flecainide on RyR2 yielded results comparable to the case flecainide acting on both targets (compare Fig. 6 I and J (selective RyR2) with Fig. 6 E and F (both targets)). Mid‐ and high‐dose flecainide acting on the RyR2 alone resolved pathological behaviour at the cellular level, though Ca2+ alternans and DADs still emerged at lower doses (Fig. 7 C).
We next modelled the physiological effects of acute application of isoproterenol on heart rate, mimicking acute sympathetic stimulation. In Fig. 8, rabbit cells were paced to steady‐state (for 500 s) at 1 Hz and then subjected to isoproterenol and an increase in pacing frequency (cycle length = 600 ms). Compared with control virtual cells that responded uneventfully to sympathetic challenge (Fig. 8 A), the virtual CASQ2(−/−) CPVT mutation generated multiple spontaneous APs, observed in the histogram of peak voltages in time (left side of left panels) and in the time course of the membrane potential (right of left panels during the time indicated by the boxed region in the left panels). As observed for steady‐state pacing, simulated 2 μM flecainide application on both the Na+ current and RyR (Fig. 8 C) normalized aberrant behaviour, while flecainide effects on the Na+ channel alone were insufficient (Fig. 8 D). A dose of 2 μM flecainide acting on the RyR alone normalized the membrane potential and prevented spontaneous Ca2+ release (Fig. 8 E). We also tested different pacing cycle lengths from 300 ms to 500 ms, and found similar results (data not shown).
Figure 8. Simulation of the physiological effects of isoproterenol on heart rate .
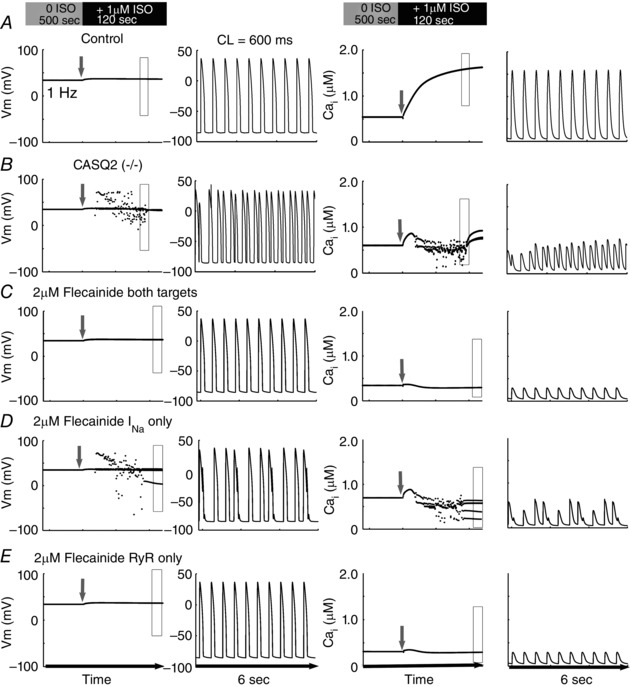
Five hundred beats were paced in control cells at Basic Cycle Length (BCL) 1000 ms (1 Hz) without ISO; cycle length was abruptly decreased to 600 ms with concomitant application of ISO (1 μM). Peak voltages in time are shown in the left columns, and a representative time course (expanded rectangle of left panels) of the membrane potential action potentials is in the 2nd column. Corresponding peak Ca2+ transients are in column 3, with a representative time course shown in the far right columns. The grey arrow in each panel denotes onset of pacing acceleration and application of ISO.
We next predicted the effects of flecainide in a rabbit one‐dimensional (1D) transmural heterogeneous tissue. Stimulation was applied to the endocardial site of the CASQ2(−/−) rabbit tissue at 2 Hz (120 beats min−1) with 1 μM ISO, in the presence or absence of flecainide. Spontaneous Ca2+ releases from the RyR2 often resulted in sufficient calcium loading to drive inward I NCX, causing DADs that were occasionally sufficient in amplitude to activate Na+ channels for a triggered AP (red arrows – Fig. 9 A).
Figure 9. Space–time representations of one‐dimensional simulations of flecainide effects on CPVT at BCL 500ms .
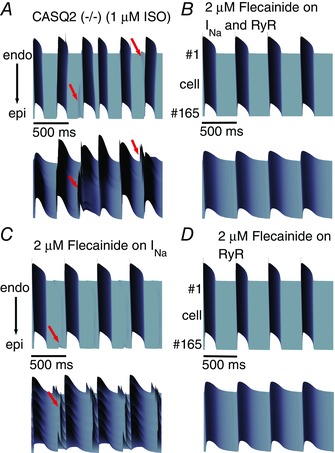
For each set of panels, voltage time course is on the top, calcium transient is on the bottom. A, simulated one‐dimensional coupled tissue harbouring the CASQ2(−/−) CPVT mutation in the absence of drug. B, effect of flecainide (2 μM) on I Na and RyR. C, flecainide (2 μM) effects on I Na alone. D, simulated effects of 2 μM flecainide on the RyR alone. Red arrows indicate spontaneous DADs, triggered action potentials and Ca2+ transients.
Flecainide at 2 μM acting on both the Na+ channels and the RyRs suppressed propagated arrhythmogenic activity by regulating underlying SR Ca2+ release (Fig. 9 B). Also consistent, 2 μM flecainide acting on I Na alone did not prevent spontaneous Ca2+ release and DADs (Fig. 9 C). However, 2 μM flecainide acting on the RyR2 alone was sufficient for therapeutic suppression of DADs and triggered APs (Fig. 9 D). Notably, 2 μM flecainide acting on I Na (e.g. Fig. 9 B and C) slowed tissue conduction velocity from 66 to 44 cm s−1 as compared with 2 μM flecainide acting on RyR2 alone, consistent with well‐documented detrimental conduction velocity in coupled tissue (Starmer et al. 1991; Moreno et al. 2011).
We further probed concentration dependence of our RyR2‐specific effects of flecainide, and found strong dose dependence. Subthreshold DADs arising from spatially discordant Ca2+ alternans emerged in the presence of 0.5 μM and 0.65 μM flecainide acting on RyR2 (Fig. 10), alone and in combination with I Na block (not shown). Figure 10 B and D show the time course of the Ca2+ mediated alternans development for 0.5 μM and 0.65 μM flecainide, respectively, acting on RyR2 alone.
Figure 10. Simulated effects of low clinical dose flecainide effect on RyR only in CPVT one‐dimensional tissue .
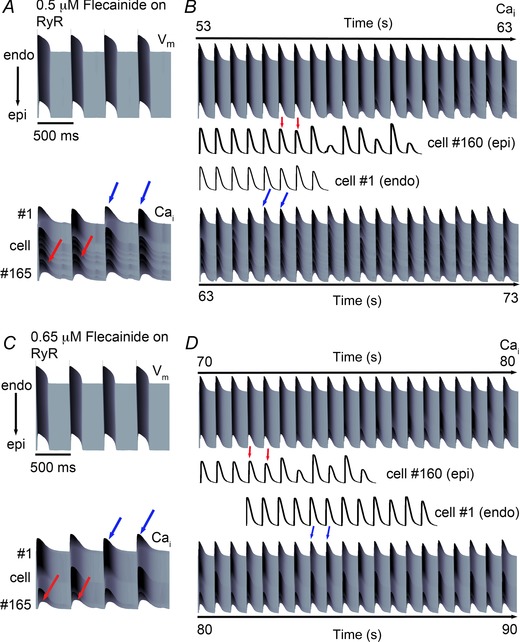
Ca2+ alternans developed slowly over time, originating from the epicardial end (red arrows) and continued to the endocardium (blue arrows). A, simulated effects of low clinically relevant dose of 0.5 μM flecainide acting on the RyR alone on action potentials (top) and Ca2+ transients (bottom). B, spatially discordant Ca2+ alternans emerge over time. Red arrows correspond to epicardial (Epi) Ca2+ alternans, while blue arrows correspond to endocardial (Endo) Ca2+ alternans. Cell no. 160 (Epi) is shown from the time 53 s (bottom), and Cell no. 1 (Endo) is shown from the time 63 s (top). C, a modest increase in flecainide (0.65 μM) decreased the transient amplitude difference between beats and prolonged the onset of alternans. D, extended time course of Ca2+ alternans development for 0.65 μM flecainide on the RyR alone. Cell no. 160 (Epi) is shown from the time 70 s (bottom), and Cell no. 1 (Endo) is shown from the time 80 s (top). In panels B and D, arrows mark the first instance of alternans, which persist for the duration of the simulation.
Given the therapeutic potential of flecainide to normalize Ca2+ anomalies in the CPVT‐linked CASQ2(−/−), we set out to predict whether other Na+ channel blockers might suppress emergent‐triggered activity in rabbit ventricular myocyte models. We simulated the pure Na+ channel blocker lidocaine (20 μM) and the late Na+ current/hERG channel blocker ranolazine (5 μM) (Moreno et al. 2013). Lidocaine and ranolazine have both failed to demonstrate efficacy in the suppression of Ca2+ wave formation (Galimberti & Knollmann, 2011). For both lidocaine and ranolazine devoid of RyR2 interaction, our results mimicked selective I Na inhibition by flecainide. Lidocaine (Fig. 11 A) and ranolazine (Fig. 11 B) did not prevent spontaneous depolarizations at all frequencies. Protocol is as in Fig. 6.
Figure 11. Simulated high clinically relevant doses of lidocaine and ranolazine in CPVT myocytes .
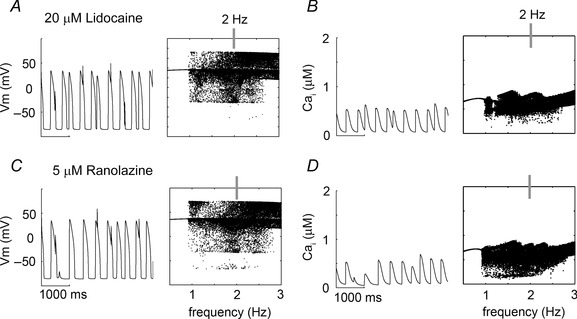
Single cell time course is shown at 2 Hz (left) and voltage and calcium transient maxima over a range of frequencies (0.5–3 Hz, right). A and B, high clinically relevant dose (20 μM) of the pure Na+ channel blocker lidocaine on voltage and Ca2+ transient, respectively. C and D, clinically relevant dose (5 μM) of the antianginal and late Na+ current blocker ranolazine on voltage and Ca2+ transient, respectively.
Low dose flecainide is predicted to be insufficient for normalizing the CASQ2(−/−) CPVT mutation‐induced proarrhythmia in simulated cells and tissues. The extension of these results is that high doses may be required for clinical therapy, which may paradoxically promote arrhythmia. β‐Blockade is associated with suboptimal management and pronounced side effects. Thus, we set out to utilize modelling and simulation to guide a novel form of virtual pharmacopoeia in an attempt to identify alternative CPVT therapy. We considered combinations of on‐market or preclinical drugs that would cumulatively regulate the RyR2 at lower concentrations, and minimize risk associated with off‐target interactions of each drug.
We used the computational model to test the hypothesis that a multidrug combination of flecainide, β‐blockade, and CaMKII inhibition would demonstrate efficacy in CPVT. Although little is known about CaMKII inhibition in humans, the signalling molecule regulates many targets and is highly distributed in the brain; thus it is expected that high doses of CaMKII inhibition should be avoided (Ledoux et al. 1999; Kaurstad et al. 2012). However, both β‐blockers and CaMKII inhibitors are classes of drugs that functionally modulate RyR2 activity (Fig. 12 A), and are suggested to provide efficacy in the management of CPVT (Pott et al. 2011; Liu et al. 2011 b; Di Pasquale et al. 2013).
Figure 12. Predicted low‐dose polytherapy for CPVT .
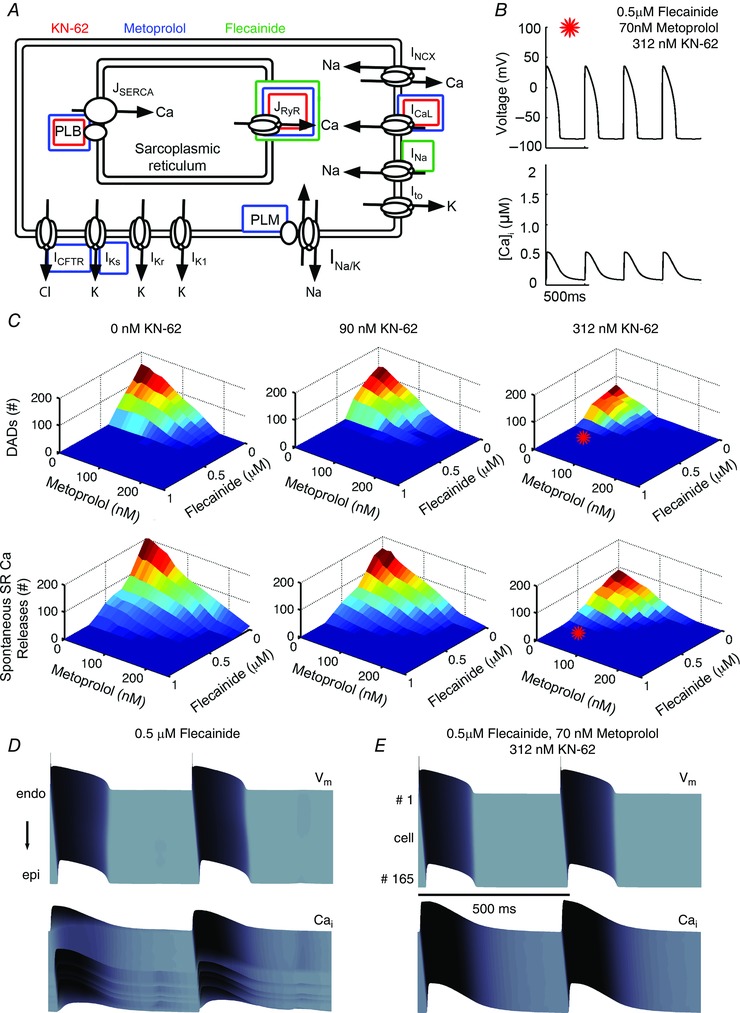
A, schematic diagram showing the primary targets of flecainide, metoprolol, and KN‐62. B, prediction of low‐dose combined therapy on action potentials (top) and calcium transients (bottom) at 2 Hz C, 3 drug combination parameter space simulated in single cells tracking the number of DADs (top) and spontaneous Ca2+ releases (bottom). Red stars denote the location of the case in B of 0.5 μM flecainide, 70 nM metoprolol and 312 nM KN‐62. D, simulated tissue effects of low dose flecainide. E, predicted tissue effects of combined simulated therapy.
We modelled the β1‐blocking effects of metoprolol (IC50 = 105 nM) as a competitive inhibitor of β‐agonist, and CaMKII inhibition by KN‐62 (IC50 = 468 nM) as a limiter of free endogenous total CaMKII (see Fig. 2; individual drug efficacy of β‐blockade and CaMKII).
We tested in a full factorial combination: the range of relevant concentration combinations in single cells at 2 Hz 0–1 μM flecainide (0.1 μM increments), 0–420 nM metoprolol (corresponding to 0–80% block of β‐receptors, at 8% increments), and 0–468 nM KN‐62 (corresponding to 0–50% CaMKII inhibition at 5% increments). Among the combinations tested, a combined dose of 0.5 μM flecainide, 70 nM metoprolol and 312 nM KN‐62 resulted in controlled Ca2+ and voltage activity over the duration of single cell pacing at 2 Hz (Fig. 12 B). Parameter space maps were generated for the three‐drug combination indicating ranges of dose to prevent DAD formation and spontaneous Ca2+ release events. Among the 1331 combinations tested, the surfaces shown in Fig. 12 C represent the efficacy of these combinations on voltage (top row) and spontaneous Ca2+ releases (bottom row). When the surface is dark blue, no DADs occurred (voltage), while the dark blue surface in the bottom panels of Fig. 12 C indicates that no spontaneous Ca2+ release events occurred. Even for some drug combinations that remediated DADs, spontaneous Ca2+ releases still occurred (indicated by larger blue area in the DAD row than the spontaneous Ca2+ release row). The effect of flecainide alone is contained within these graphs where the concentration of the other drugs is zero. The red stars in Fig. 12 C, right, show one predicted optimal therapeutic combination, a combined dose of 0.5 μM flecainide, 70 nM metoprolol and 312 nM KN‐62, resulted in just one effective combination that remediated Ca2+ and voltage activity (indicated by a star). This is within a parameter space of local minima, indicating eradication of single cell proarrhythmia event markers (e.g. DADs and spontaneous Ca2+ release (SCaR) events).
Finally, we simulated our drug combination of 0.5 μM flecainide, 70 nM metoprolol and 312 nM KN‐62 in CASQ2(−/−) in 1D tissue, and compared the results with a simulated tissue pretreated with 0.5 μM flecainide (Fig. 12 D). Compared with flecainide alone, combination therapy was superior by (i) requiring a lower dose of flecainide (and thus maintaining conduction velocity 41 cm s−1 for flecainide vs. 59 cm s−1 for combination therapy); (ii) fully suppressing all DADs and triggered APs; (iii) reducing APD90; (iv) normalizing [Ca]i; and (v) preventing the occurrence of spatially discordant Ca2+ alternans (see Table 6).
Table 6.
CASQ2(−/−) with ISO 1 μM at 2 Hz (rabbit)
| Drug concentration | CV (cm s−1) | APD90 (ms) | [Ca]i (μM) |
|---|---|---|---|
| Drug free | 60 | Triggered APs | 0.6 |
| Flecainide 2 μM | 41 | 192.5 | 0.285 |
| Flecainide 0.5 μM + 70 nM Metoprolol + 312 nM KN‐62 | 59 | 177.8 | 0.55 |
We next tested if the rabbit model prediction for flecainide, β‐blockade and CaMKII polytherapy would hold true in the computational mouse model, as a test of the model independence of our findings. Just as we observed for the rabbit model predictions, high dose (2 μM) flecainide effects on both I Na and the RyR normalized the CASQ2(−/−) CPVT phenotype as shown in Fig. 13 A. Application of flecainide in the mouse model did not affect the amplitude of the Ca2+ transients, consistent with experimental observations in the mouse genetic models (Hilliard et al. 2010). Also consistent, the effects of high dose (2 μM) flecainide on I Na alone was predicted to be insufficient for normalizing the CASQ2(−/−) CPVT mutation‐induced afterdepolarizations and spontaneous Ca2+ release events as shown in Fig. 13 B. However, 2 μM flecainide acting on the RyR2 alone was sufficient for therapeutic suppression of DADs (Fig. 13 C). Low dose 0.5 μM flecainide acting on I Na and the RyR2 did not ablate spontaneous Ca2+ release events as shown in Fig. 13 D. We also tested if one of the predicted polytherapy combinations that was found to be effective in the rabbit model simulations was also effective in the mouse. The result, shown in Fig. 13 E, shows that the drug combination of 0.5 μM flecainide, 70 nM metoprolol and 312 nM KN‐62 in the mouse CASQ2(−/−) virtual myocyte completely normalized the cellular phenotype.
Figure 13. Simulated drug effects in mouse ventricular myocytes .
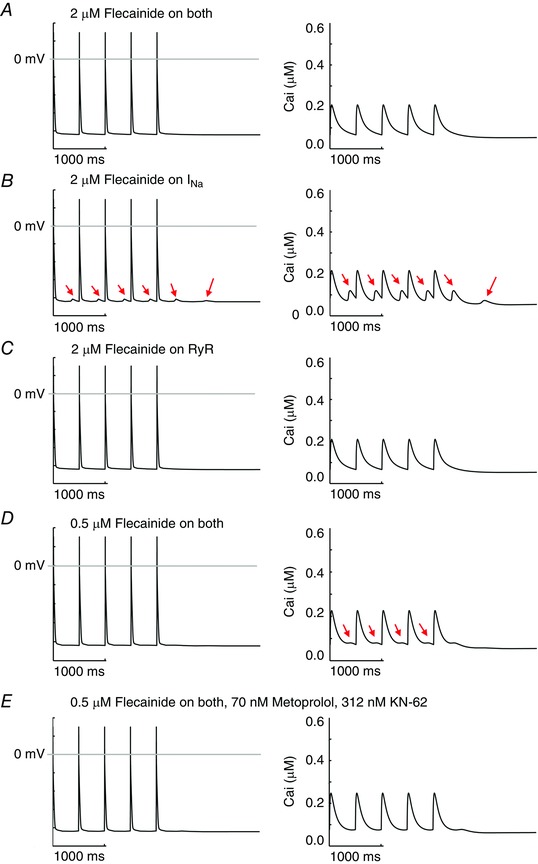
In each panel simulated membrane voltage (left) and intracellular Ca2+ transients (right) are shown during 2 Hz pacing. A, CASQ2(−/−) myocyte APs and CaTs with high clinical dose (2 μM) flecainide effects on both Na+ channels and RyRs. B, high dose flecainide acting only on Na+ channels. C, high dose flecainide (2 μM) on only RyRs. D, low dose flecainide 0.5 μM on both Na+ channels and RyRs. E, simulated test of predicted polytherapy in mouse ventricular myocytes.
We next set out to experimentally test if the model prediction for flecainide, β‐blockade and CaMKII polytherapy would be effective in the R176Q/+ CPVT experimental mouse model, an alternate CPVT genotype. The results are shown in Fig. 14. A knock‐in R176Q/+ CPVT mouse model was used (six R176Q/+, two WT). R176/+ mice develop bidirectional ventricular tachycardia (VT) with catecholamine provocation. At baseline, neither the WT nor the R176Q/+ mice demonstrated ventricular arrhythmias and average heart rate was 462 beats min−1 (R176Q/+) and 574 beats min−1 (WT) (Table 7). After injection of adrenaline (2 mg kg−1 i.p.) and caffeine (120 mg kg−1 i.p.), six of six R176Q/+ mice developed bidirectional VT as shown in Fig. 14 A and C. Ventricular tachycardia initiated within 30 s to 6 min and lasted between 1 and 51 min in length (average 21 min) with an average ventricular rate of 807 beats min−1. Both WT and R176Q/+ mice demonstrated T‐wave alternans lasting several hours after injection of adrenaline and caffeine. After a 7 day wash‐out, the mice were injected with adrenaline and caffeine (2 mg kg−1 and 120 mg kg−1 i.p., respectively); however, 30 min prior, all mice were given pre‐treatment with i.p. injections of flecainide (12 mg kg−1, Sigma‐Aldrich), metoprolol (10 mg kg−1, Sigma‐Aldrich) and KN‐93 (30 μmol kg−1, Calbiochem). All mice demonstrated statistically significant PR, QRS and QTc prolongation 30 min after administration of flecainide, metoprolol and KN‐93 (Table 8). Some mice exhibited ST segment changes (data not shown). Heart rates were lower after drug administration but not significantly (Table 8). Adrenaline and caffeine following pre‐treatment with flecainide, metoprolol and KN‐93 failed to induce ventricular tachycardia in all R176Q/+ mice. Mice demonstrated T‐wave alternans (one WT and five R176Q/+) and single premature ventricular contractions (four R176Q/+); however, higher‐grade ectopy and the typical bidirectional VT were not seen as shown in Fig. 14 B and C.
Figure 14. Experimental test of predicted polytherapy .
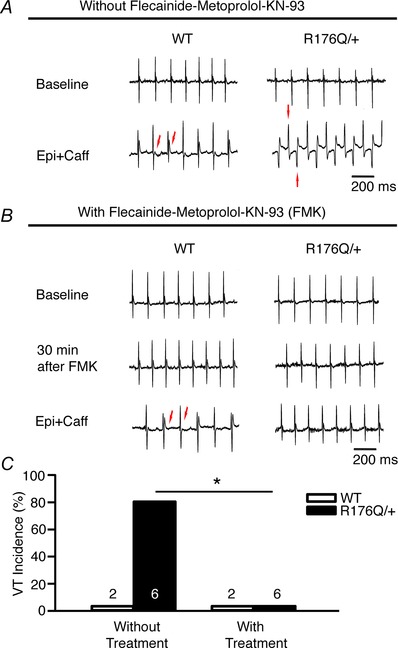
A and B, representative tracings from WT and R176Q/+ mice are shown at baseline and after sympathetic challenge with no drug (A) and following administration of flecainide, metoprolol and KN‐93 (B). C, summary of data without (left) and following (right) pre‐treatment with flecainide, metoprolol and KN‐93, which suppressed VT in all R176Q/+ mice (*P = 0.015).
Table 7.
ECG measurement comparing wild type and R176Q/+ mice before and after treatments
| Without treatment | With treatment | ||||||||||||||
|---|---|---|---|---|---|---|---|---|---|---|---|---|---|---|---|
| Baseline | Epi + Caffeine | Baseline | Flec + Metop + KN‐93 | Epi + Caffeine | |||||||||||
| WT | R176Q/+ | P | WT | R176Q/+ | P | WT | R176/+ | P | WT | R176Q/+ | P | WT | R176Q/+ | P | |
| Heart rate (beats min−1) | 574 | 462 | 0.18 | 588 | 466 | 0.09 | 442 | 467 | 0.73 | 385 | 375 | 0.93 | 424 | 328 | 0.25 |
| PR (ms) | 35 | 38 | 0.34 | 36 | 40 | 0.26 | 36 | 38 | 0.40 | 45 | 50 | 0.60 | 43 | 55 | 0.23 |
| QRS (ms) | 12 | 11 | 0.72 | 13 | 15 | 0.08 | 12 | 12 | 0.78 | 16 | 16 | 0.76 | 18 | 21 | 0.63 |
| QTc (ms) | 45 | 46 | 0.69 | 46 | 49 | 0.28 | 49 | 49 | 0.99 | 45 | 48 | 0.26 | 45 | 43 | 0.37 |
Adrenaline (2 mg kg−1) and caffeine (120 mg kg−1) were initially injected intraperitoneal (i.p.) without pre‐treatment (Without treatment). Mice were then given a pre‐treatment dose of flecainide (12 mg kg−1, i.p.), metoprolol (10 mg kg−1, i.p.), and KN‐93 (30 μmol kg−1, i.p.) followed 30 min later by an injection of the same i.p. dose of adrenaline and caffeine (With treatment). Flec, flecainide (12 mg kg−1); Metop, metoprolol (10 mg kg−1); KN‐93 (30 μmol kg−1).
Table 8.
Comparison of ECG measurements before and after treatment with flecainide, metoprolol and KN‐93
| Flecainide, | |||
|---|---|---|---|
| Baseline | Metoprolol, KN‐93 | P | |
| Heart rate (beats min−1) | 461 | 378 | 0.14 |
| PR (ms) | 37 | 48 | 0.01 |
| QRS (ms) | 12 | 16 | < 0.001 |
| QTc (ms) | 49 | 47 | 0.12 |
Discussion
The optimal pharmacological management of CPVT remains a clinical challenge. The current mainstay of pharmacotherapy often involves maximally tolerated β‐blockade despite high (∼30–50%) failure rates (Priori et al. 2002; Liu et al. 2008). In conjunction with pharmacotherapy, mechanical ICD implantation (Miyake et al. 2013) and left cardiac sympathetic denervation (Wilde et al. 2008) have been used clinically, but carry inherent morbidity and fail to target the mechanistic underpinnings of the CPVT arrhythmia triggers.
While alternative class I antiarrhythmics have been suggested (Galimberti & Knollmann, 2011; Hwang et al. 2011), only flecainide has shown moderate clinical success. Its well‐studied mechanism of action is inhibition of the inward sodium current (I Na), but data suggest that flecainide interacts with I Kr and RyR2 (Hilliard et al. 2010; Galimberti & Knollmann, 2011). Flecainide has demonstrated lethal proarrhythmic effects in other patient populations (Echt et al. 1991), and previous clinical failures were largely the result of an incomplete understanding of the emergent proarrhythmic risk.
Recent studies have suggested that because flecainide is 97–99% ionized at physiological pH, it is insufficiently concentrated inside the cell to act on the RyR (Liu et al. 2011 a, 2012), though the study cited as evidence showed the opposite result (Liu et al. 2003). The authors made permanently charged flecainide, which when applied intracellularly (via a pipette) led to the same effect as when the same concentration of unadulterated flecainide was applied externally (in the bath). Permanently charged flecainide had no effect when applied externally, showing that the drug action cannot be via an extracellular path.
Here, we utilized a physics‐based molecular dynamics approach to simulate the partitioning of flecainide by computing free energy profiles for flecainide transport in the extracellular, membrane and intracellular compartments (Fig. 5). The simulations suggest that flecainide accumulates on the membrane surface in cationic and neutral forms after which deprotonation occurs at the surface binding site and promotes membrane crossing down the concentration gradient. The drug then reacquires a proton once it is in the intracellular milieu. This process is extremely rapid, occurring with a diffusion coefficient of ∼10−7 cm s−1, only an order of magnitude lower than in the bulk water.
Our predictions support the existing experimental data suggesting the following cell entry model for flecainide transport: (i) drug accumulates on the membrane surface in cationic and neutral forms; (ii) deprotonation occurs at the surface binding site (site 1) and promotes membrane crossing down the concentration gradient; and (c) drug acquires a proton once it is in the intracellular milieu.
As demonstrated in Fig. 4, virtual mouse and rabbit CASQ2(−/−) cells with β‐agonist display increased Ca2+ transients and spontaneous Ca2+ release events, which are sufficient to drive triggered cellular electrical activity, and reproduce clinical behaviour of the CVPT phenotype (Liu et al. 2011 a). The absence of calsequestrin as a buffer speeds up the dynamics of SR refilling, providing more interaction time for SR Ca2+ to activate the RyR2, and results in functionally upregulated RyR2 activity. The resulting spontaneous Ca2+ release events and depolarizations of the membrane persist after cessation of pacing, owing to cyclic refilling of the SR, spontaneous release of Ca2+ into the cytoplasm via the RyR2, activation of I Na by inward I NCX, influx of Ca2+ via activation of I CaL and reuptake of Ca2+ into the SR via SERCA. It is important to note that diastolic intervals in the rabbit are longer than in the mouse, and the model predicted that they could allow sufficient time to promote spontaneous diastolic release and triggered activity. Our model predicted that high dose flecainide prevents aberrant spontaneous Ca2+ releases with resultant resolution of triggered AP activity in single virtual myocytes of mouse and rabbit and in rabbit transmural 1D virtual cardiac tissue (see Figs 6, 8 and 9), consistent with experimental data (Hilliard et al. 2010; Galimberti & Knollmann, 2011).
There is considerable disagreement in the literature as to whether the antiarrhythmic effects seen with flecainide are predominately the result of Na+ channel blockade, RyR2 blockade, or both. Studies by Watanabe et al. (2009) and others (Hilliard et al. 2010; Galimberti & Knollmann, 2011; van der Werf et al. 2011) have documented a substantial interaction between flecainide and RyR2. They proposed that flecainide acts as a RyR2 open state blocker, with resultant increase in Ca2+ spark rate, a decrease in Ca2+ spark mass and disruption of Ca2+ wave propagation.
Other studies have failed to document any effects of flecainide on RyR or Ca2+ handling, and suggested flecainide's efficacy is almost entirely due to its Na+ channel blocking effects (Liu et al. 2011 a; Bannister et al. 2015). There are a few potential explanations for these disparate findings, including a lower than expected flecainide concentration within the cell in Liu's study, given rapid diffusion of neutral flecainide through the membrane and repartitioning within the bath solution, and potential mutation‐induced lowered affinity of flecainide for RyR2.
When we decoupled flecainide's presumed RyR2 activity from its well‐known Na+ channel blockade, we were surprised to find that the model predicted that Na+ channel blockade – even at the high clinical doses – was not sufficient to explain the antiarrhythmic effects seen clinically with flecainide. As seen in Fig. 6 and 8 (single cells) and Fig. 9 (1D tissue), pure Na+ channel blockade failed to inhibit spontaneous Ca2+ release, and subsequent triggered activity, whereas the RyR2‐specific flecainide interaction was predicted to yield results similar to flecainide acting on both targets.
Interestingly, our simulations with lidocaine (Moreno et al. 2011) as an additional control of pure Na+ channel blockade resulted in good concordance with experimental results (Katz et al. 2010; Galimberti & Knollmann, 2011; Hwang et al. 2011), namely that as a monotherapeutic approach, Na+ channel blockade is insufficient to resolve CPVT arrhythmia triggers. Consistent with experimental evidence in support of this mechanism of action, flecainide's interaction with the Na+ channel did resolve arrhythmia triggers in higher dimensions, but proarrhythmic DADs persisted.
Lastly, because the drugs used to treat CPVT act on different targets, we hypothesized that their actions might prove synergistic when used as a combination therapy. We tested the full parameter space of clinically relevant combination therapy with β‐blockade, flecainide and CaMKII inhibition (Fig. 12), and found that all three drugs achieved better efficacy when used in combination with either or both of the other drugs tested. The potential to achieve therapeutic efficacy at lower drug concentrations potentially limits the danger of off‐target and drug‐related side‐effects and are consistent with clinical reports of improved therapy with combined β‐blockade and flecainide (Pott et al. 2011; Pflaumer & Davis, 2012).
Importantly, our polypharmacy simulations go beyond confirmation that a multidrug regimen is superior; for the first time (to our knowledge), our simulations are a proof‐of‐concept for prediction of a dosing strategy, and simulate a virtual phase 1–2 clinical trial of dose escalations with several thousand combinations of clinically relevant dosages.
We then utilized an experimental protocol to validate the virtual trial in R176Q/+ CPVT mice (Fig. 14). The CPVT R176/+ mice developed bidirectional ventricular tachycardia (VT) with catecholamine provocation. But, as predicted by the computer model in both rabbit (Fig. 12) and mouse (Fig. 13) virtual myocytes, pre‐treatment with flecainide, metoprolol and KN‐93 prevented catecholaminergically induced ventricular tachycardia in all R176Q/+ mice.
Our study is not without limitations. Most importantly, different CPVT mutations demonstrate differences in ultrastructure (Liu et al. 2013), protein expression (Song et al. 2007), RyR2 structural conformation and functionality (Cerrone et al. 2005; Goddard et al. 2008), and Ca2+ dynamics (Viatchenko‐Karpinski et al. 2004; Terentyev et al. 2006). As flecainide and β‐blockade have been used clinically, we know that the adverse effect profiles are concentration dependent. Little is known about the clinical consequences of CaMKII inhibition, and our predictions will obviously require careful testing and validation prior to clinical use.
Another important limitation of our study is that the models that we have utilized do not explicitly represent subcellular Ca2+ dynamics. For this reason, we are not able to simulate subcellular Ca2+ waves and the effects of the drugs on them. This will be an important subject of a future study. In addition, a full experimental follow‐up study to further test and hone the therapeutic efficacy of alternate polytherapy approaches needs to be conducted.
In conclusion, we utilized a computational modelling approach, informed by, and validated with experimental and clinical data, to make therapeutic predictions of drug mechanism and efficacy in the setting of CPVT. Our study sought to answer three fundamental questions of current pharmacotherapy for CPVT. (i) Is flecainide interaction with the Na+ channel sufficient for therapy? (ii) Can we predict if other Na+ channel blockers will be equally efficacious? (iii) Can a multi‐targeted pharmacologic approach synergize to yield greater success than with individual therapeutics?
Additional information
Competing interests
C.E.C. has a research grant from Gilead Sciences, not involved in this study.
Author contributions
P.‐C.Y. and J.D.M. designed and performed simulations, analysed data, and prepared the manuscript; S.B.V.‐B., M.‐T.J. and S.N. designed and performed simulations; C.Y.M. and X.H.T. designed and performed experiments, and drafted the manuscript; E.G. analysed data, and revised the manuscript; C.E.C. designed simulations and experiments, analysed data, coordinated and oversaw the project, and prepared the manuscript. All authors have approved the final version of the manuscript and agree to be accountable for all aspects of the work. All persons designated as authors qualify for authorship, and all those who qualify for authorship are listed.
Funding
American Heart Association (GIAs (10GRNT3880050, 13GRNT14370019), Western States Affiliate), the National Institutes of Health NHLBI RO1‐HL‐085592, NHLBI R01‐HL‐085592‐S1, R01 HL105242‐05, 1U01HL126273‐01A1 and Gilead Sciences (to C.E.C.). Canadian Institutes for Health Research (MOP‐186232) and Heart and Stroke Foundation, Alberta (GIA) (to S.N.). NIH‐NHLBI (HL089598, HL091947, HL117641, HL129570), the American Heart Association (13EIA14560061) to XHT.
P.‐C. Yang and J. D. Moreno contributed equally.
References
- Abrahamsson B, Lucker P, Olofsson B, Regardh CG, Sandberg A, Wieselgren I & Bergstrand R (1990). The relationship between metoprolol plasma concentration and beta1‐blockade in healthy subjects: a study on conventional metoprolol and metoprolol CR/ZOK formulations. J Clin Pharmacol 30, S46–54. [DOI] [PubMed] [Google Scholar]
- Bannister ML, Thomas NL, Sikkel MB, Mukherjee S, Maxwell C, MacLeod KT, George CH & Williams AJ (2015). The mechanism of flecainide action in CPVT does not involve a direct effect on RyR2. Circ Res 116, 1324–1335. [DOI] [PubMed] [Google Scholar]
- Belardinelli L, Liu G, Smith‐Maxwell C, Wang WQ, El‐Bizri N, Hirakawa R, Karpinski S, Li CH, Hu L, Li XJ, Crumb W, Wu L, Koltun D, Zablocki J, Yao L, Dhalla AK, Rajamani S & Shryock JC (2013). A novel, potent, and selective inhibitor of cardiac late sodium current suppresses experimental arrhythmias. J Pharmacol Exp Ther 344, 23–32. [DOI] [PubMed] [Google Scholar]
- Boggara MB & Krishnamoorti R (2010). Partitioning of nonsteroidal antiinflammatory drugs in lipid membranes: a molecular dynamics simulation study. Biophys J 98, 586–595. [DOI] [PMC free article] [PubMed] [Google Scholar]
- Brugada J, Boersma L, Kirchhof C & Allessie M (1990). [Anisotropy and reentrant ventricular tachycardia: experimental model in the isolated rabbit heart]. Rev Esp Cardiol 43, 558–568. [PubMed] [Google Scholar]
- Brunton LL, Chabner BA & Knollmann BC (2010). Goodman and Gilman's The Pharmacological Basis of Therapeutics. McGraw‐Hill Professional, New York, USA. [Google Scholar]
- Cerrone M, Colombi B, Santoro M, di Barletta MR, Scelsi M, Villani L, Napolitano C & Priori SG (2005). Bidirectional ventricular tachycardia and fibrillation elicited in a knock‐in mouse model carrier of a mutation in the cardiac ryanodine receptor. Circ Res 96, e77–82. [DOI] [PubMed] [Google Scholar]
- Chudin E, Goldhaber J, Garfinkel A, Weiss J & Kogan B (1999). Intracellular Ca2+ dynamics and the stability of ventricular tachycardia. Biophys J 77, 2930–2941. [DOI] [PMC free article] [PubMed] [Google Scholar]
- Colquhoun D, Dowsland KA, Beato M & Plested AJ (2004). How to impose microscopic reversibility in complex reaction mechanisms. Biophys J 86, 3510–3518. [DOI] [PMC free article] [PubMed] [Google Scholar]
- Colquhoun D & Hawkes AG (1981). On the stochastic properties of single ion channels. Proc R Soc Lond B Biol Sci 211, 205–235. [DOI] [PubMed] [Google Scholar]
- Davies SP, Reddy H, Caivano M & Cohen P (2000). Specificity and mechanism of action of some commonly used protein kinase inhibitors. Biochem J 351, 95–105. [DOI] [PMC free article] [PubMed] [Google Scholar]
- Di Pasquale E, Lodola F, Miragoli M, Denegri M, Avelino‐Cruz JE, Buonocore M, Nakahama H, Portararo P, Bloise R, Napolitano C, Condorelli G & Priori SG (2013). CaMKII inhibition rectifies arrhythmic phenotype in a patient‐specific model of catecholaminergic polymorphic ventricular tachycardia. Cell Death Dis 4, e843. [DOI] [PMC free article] [PubMed] [Google Scholar]
- Echt DS, Liebson PR, Mitchell LB, Peters RW, Obias‐Manno D, Barker AH, Arensberg D, Baker A, Friedman L, Greene HL, et al (1991). Mortality and morbidity in patients receiving encainide, flecainide, or placebo. The Cardiac Arrhythmia Suppression Trial. N Engl J Med 324, 781–788. [DOI] [PubMed] [Google Scholar]
- Fedida D & Giles WR (1991). Regional variations in action potentials and transient outward current in myocytes isolated from rabbit left ventricle. J Physiol 442, 191–209. [DOI] [PMC free article] [PubMed] [Google Scholar]
- Fedida D, Orth PM, Hesketh JC & Ezrin AM (2006). The role of late I and antiarrhythmic drugs in EAD formation and termination in Purkinje fibers. J Cardiovasc Electrophysiol 17 Suppl 1, S71–S78. [DOI] [PubMed] [Google Scholar]
- Galimberti ES & Knollmann BC (2011). Efficacy and potency of class I antiarrhythmic drugs for suppression of Ca2+ waves in permeabilized myocytes lacking calsequestrin. J Mol Cell Cardiol 51, 760–768. [DOI] [PMC free article] [PubMed] [Google Scholar]
- Gillespie DT (1977). Exact stochastic simulation of coupled chemical reactions. J Phys Chem 81, 2340–2361. [Google Scholar]
- Glukhov AV, Fedorov VV, Lou Q, Ravikumar VK, Kalish PW, Schuessler RB, Moazami N & Efimov IR (2010). Transmural dispersion of repolarization in failing and nonfailing human ventricle. Circ Res 106, 981–991. [DOI] [PMC free article] [PubMed] [Google Scholar]
- Goddard CA, Ghais NS, Zhang Y, Williams AJ, Colledge WH, Grace AA & Huang CL (2008). Physiological consequences of the P2328S mutation in the ryanodine receptor (RyR2) gene in genetically modified murine hearts. Acta Physiol (Oxf) 194, 123–140. [DOI] [PMC free article] [PubMed] [Google Scholar]
- Gyorke S & Terentyev D (2008). Modulation of ryanodine receptor by luminal calcium and accessory proteins in health and cardiac disease. Cardiovasc Res 77, 245–255. [DOI] [PubMed] [Google Scholar]
- Hilliard FA, Steele DS, Laver D, Yang Z, Le Marchand SJ, Chopra N, Piston DW, Huke S & Knollmann BC (2010). Flecainide inhibits arrhythmogenic Ca2+ waves by open state block of ryanodine receptor Ca2+ release channels and reduction of Ca2+ spark mass. J Mol Cell Cardiol 48, 293–301. [DOI] [PMC free article] [PubMed] [Google Scholar]
- Huang L & Roux B (2013). Automated force field parameterization for nonpolarizable and polarizable atomic models based on ab initio target data. J Chem Theory Comput 9, 3543–3556. [DOI] [PMC free article] [PubMed] [Google Scholar]
- Hwang HS, Hasdemir C, Laver D, Mehra D, Turhan K, Faggioni M, Yin H & Knollmann BC (2011). Inhibition of cardiac Ca2+ release channels (RyR2) determines efficacy of class I antiarrhythmic drugs in catecholaminergic polymorphic ventricular tachycardia. Circ Arrhythm Electrophysiol 4, 128–135. [DOI] [PMC free article] [PubMed] [Google Scholar]
- Katz G, Khoury A, Kurtzwald E, Hochhauser E, Porat E, Shainberg A, Seidman JG, Seidman CE, Lorber A, Eldar M & Arad M (2010). Optimizing catecholaminergic polymorphic ventricular tachycardia therapy in calsequestrin‐mutant mice. Heart Rhythm 7, 1676–1682. [DOI] [PMC free article] [PubMed] [Google Scholar]
- Kaurstad G, Alves MN, Kemi OJ, Rolim N, Hoydal MA, Wisloff H, Stolen TO & Wisloff U (2012). Chronic CaMKII inhibition blunts the cardiac contractile response to exercise training. Eur J Appl Physiol 112, 579–588. [DOI] [PMC free article] [PubMed] [Google Scholar]
- Knollmann BC, Chopra N, Hlaing T, Akin B, Yang T, Ettensohn K, Knollmann BE, Horton KD, Weissman NJ, Holinstat I, Zhang W, Roden DM, Jones LR, Franzini‐Armstrong C & Pfeifer K (2006). Casq2 deletion causes sarcoplasmic reticulum volume increase, premature Ca2+ release, and catecholaminergic polymorphic ventricular tachycardia. J Clin Invest 116, 2510–2520. [DOI] [PMC free article] [PubMed] [Google Scholar]
- Kornyeyev D, Petrosky AD, Zepeda B, Ferreiro M, Knollmann B & Escobar AL (2012). Calsequestrin 2 deletion shortens the refractoriness of Ca2+ release and reduces rate‐dependent Ca2+‐alternans in intact mouse hearts. J Mol Cell Cardiol 52, 21–31. [DOI] [PMC free article] [PubMed] [Google Scholar]
- Ledoux J, Chartier D & Leblanc N (1999). Inhibitors of calmodulin‐dependent protein kinase are nonspecific blockers of voltage‐dependent K+ channels in vascular myocytes. J Pharmacol Exp Ther 290, 1165–1174. [PubMed] [Google Scholar]
- Leenhardt A, Lucet V, Denjoy I, Grau F, Ngoc DD & Coumel P (1995). Catecholaminergic polymorphic ventricular tachycardia in children. A 7‐year follow‐up of 21 patients. Circulation 91, 1512–1519. [DOI] [PubMed] [Google Scholar]
- Li L, Vorobyov I, MacKerell AD & Allen TW (2008). Is arginine charged in a membrane? Biophys J 94, L11–L13. [DOI] [PMC free article] [PubMed] [Google Scholar]
- Liu H, Atkins J & Kass RS (2003). Common molecular determinants of flecainide and lidocaine block of heart Na+ channels: evidence from experiments with neutral and quaternary flecainide analogues. J Gen Physiol 121, 199–214. [DOI] [PMC free article] [PubMed] [Google Scholar]
- Liu N, Denegri M, Dun W, Boncompagni S, Lodola F, Protasi F, Napolitano C, Boyden PA & Priori SG (2013). Abnormal propagation of calcium waves and ultrastructural remodeling in recessive catecholaminergic polymorphic ventricular tachycardia. Circ Res 113, 142–152. [DOI] [PubMed] [Google Scholar]
- Liu N, Denegri M, Ruan Y, Avelino‐Cruz JE, Perissi A, Negri S, Napolitano C, Coetzee WA, Boyden PA & Priori SG (2011. a). Short communication: flecainide exerts an antiarrhythmic effect in a mouse model of catecholaminergic polymorphic ventricular tachycardia by increasing the threshold for triggered activity. Circ Res 109, 291–295. [DOI] [PubMed] [Google Scholar]
- Liu N, Napolitano C, Venetucci LA & Priori SG (2012). Flecainide and antiarrhythmic effects in a mouse model of catecholaminergic polymorphic ventricular tachycardia. Trends Cardiovasc Med 22, 35–39. [DOI] [PubMed] [Google Scholar]
- Liu N, Ruan Y, Denegri M, Bachetti T, Li Y, Colombi B, Napolitano C, Coetzee WA & Priori SG (2011. b). Calmodulin kinase II inhibition prevents arrhythmias in RyR2R4496C+/− mice with catecholaminergic polymorphic ventricular tachycardia. J Mol Cell Cardiol 50, 214–222. [DOI] [PubMed] [Google Scholar]
- Liu N, Ruan Y & Priori SG (2008). Catecholaminergic polymorphic ventricular tachycardia. Prog Cardiovasc Dis 51, 23–30. [DOI] [PubMed] [Google Scholar]
- Marx SO, Gaburjakova J, Gaburjakova M, Henrikson C, Ondrias K & Marks AR (2001). Coupled gating between cardiac calcium release channels (ryanodine receptors). Circ Res 88, 1151–1158. [DOI] [PubMed] [Google Scholar]
- Mehra D, Imtiaz MS, van Helden DF, Knollmann BC & Laver DR (2014). Multiple modes of ryanodine receptor 2 inhibition by flecainide. Mol Pharmacol 86, 696–706. [DOI] [PMC free article] [PubMed] [Google Scholar]
- Miyake CY, Webster G, Czosek RJ, Kantoch MJ, Dubin AM, Avasarala K & Atallah J (2013). Efficacy of implantable cardioverter defibrillators in young patients with catecholaminergic polymorphic ventricular tachycardia: success depends on substrate. Circ Arrhythm Electrophysiol 6, 579–587. [DOI] [PubMed] [Google Scholar]
- Moreno JD, Yang PC, Bankston JR, Grandi E, Bers DM, Kass RS & Clancy CE (2013). Ranolazine for congenital and acquired late INa‐linked arrhythmias: in silico pharmacological screening. Circ Res 113, e50–61. [DOI] [PMC free article] [PubMed] [Google Scholar]
- Moreno JD, Zhu ZI, Yang PC, Bankston JR, Jeng MT, Kang C, Wang L, Bayer JD, Christini DJ, Trayanova NA, Ripplinger CM, Kass RS & Clancy CE (2011). A computational model to predict the effects of class I anti‐arrhythmic drugs on ventricular rhythms. Sci Transl Med 3, 98ra83. [DOI] [PMC free article] [PubMed] [Google Scholar]
- Morotti S, Edwards AG, McCulloch AD, Bers DM & Grandi E (2014). A novel computational model of mouse myocyte electrophysiology to assess the synergy between Na+ loading and CaMKII. J Physiol 592, 1181–1197. [DOI] [PMC free article] [PubMed] [Google Scholar]
- Myles RC, Bernus O, Burton FL, Cobbe SM & Smith GL (2010). Effect of activation sequence on transmural patterns of repolarization and action potential duration in rabbit ventricular myocardium. Am J Physiol Heart Circ Physiol 299, H1812–1822. [DOI] [PMC free article] [PubMed] [Google Scholar]
- Nagatomo T, January C & Makielski J (2000). Preferential block of late sodium current in the LQT3 ΔKPQ mutant by the class IC antiarrhythmic flecainide. Mol Pharmacol 57, 101–107. [PubMed] [Google Scholar]
- Nakamura H, Kurokawa J, Bai CX, Asada K, Xu J, Oren RV, Zhu ZI, Clancy CE, Isobe M & Furukawa T (2007). Progesterone regulates cardiac repolarization through a nongenomic pathway: an in vitro patch‐clamp and computational modeling study. Circulation 116, 2913–2922. [DOI] [PubMed] [Google Scholar]
- Parikh A, Mantravadi R, Kozhevnikov D, Roche MA, Ye Y, Owen LJ, Puglisi JL, Abramson JJ & Salama G (2012). Ranolazine stabilizes cardiac ryanodine receptors: A novel mechanism for the suppression of early afterdepolarization and torsades de pointes in long QT type 2. Heart Rhythm 9, 953–960. [DOI] [PMC free article] [PubMed] [Google Scholar]
- Pflaumer A & Davis AM (2012). Guidelines for the diagnosis and management of Catecholaminergic Polymorphic Ventricular Tachycardia. Heart Lung Circ 21, 96–100. [DOI] [PubMed] [Google Scholar]
- Pott C, Dechering DG, Reinke F, Muszynski A, Zellerhoff S, Bittner A, Kobe J, Wasmer K, Schulze‐Bahr E, Monnig G, Kotthoff S & Eckardt L (2011). Successful treatment of catecholaminergic polymorphic ventricular tachycardia with flecainide: a case report and review of the current literature. Europace 13, 897–901. [DOI] [PubMed] [Google Scholar]
- Priori SG, Napolitano C, Memmi M, Colombi B, Drago F, Gasparini M, DeSimone L, Coltorti F, Bloise R, Keegan R, Cruz Filho FE, Vignati G, Benatar A & DeLogu A (2002). Clinical and molecular characterization of patients with catecholaminergic polymorphic ventricular tachycardia. Circulation 106, 69–74. [DOI] [PubMed] [Google Scholar]
- Rajamani S, Shryock JC & Belardinelli L (2008). Rapid kinetic interactions of ranolazine with HERG K+ current. J Cardiovasc Pharmacol 51, 581–589. [DOI] [PubMed] [Google Scholar]
- Roux B (1995). The calculation of the potential of mean force using computer‐simulations. Comp Phys Comm 91, 275–282. [Google Scholar]
- Saucerman JJ, Brunton LL, Michailova AP & McCulloch AD (2003). Modeling β‐adrenergic control of cardiac myocyte contractility in silico. J Biol Chem 278, 47997–48003. [DOI] [PubMed] [Google Scholar]
- Sears SF Jr, Todaro JF, Lewis TS, Sotile W & Conti JB (1999). Examining the psychosocial impact of implantable cardioverter defibrillators: a literature review. Clin Cardiol 22, 481–489. [DOI] [PMC free article] [PubMed] [Google Scholar]
- Shannon TR, Wang F, Puglisi J, Weber C & Bers DM (2004). A mathematical treatment of integrated Ca dynamics within the ventricular myocyte. Biophys J 87, 3351–3371. [DOI] [PMC free article] [PubMed] [Google Scholar]
- Sikkel MB, Collins TP, Rowlands C, Shah M, O'Gara P, Williams AJ, Harding SE, Lyon AR & MacLeod KT (2013). Triple mode of action of flecainide in catecholaminergic polymorphic ventricular tachycardia: reply. Cardiovasc Res 98, 327–328. [DOI] [PubMed] [Google Scholar]
- Sitsapesan R, Montgomery RA, MacLeod KT & Williams AJ (1991). Sheep cardiac sarcoplasmic reticulum calcium‐release channels: modification of conductance and gating by temperature. J Physiol 434, 469–488. [DOI] [PMC free article] [PubMed] [Google Scholar]
- Soltis AR & Saucerman JJ (2010). Synergy between CaMKII substrates and β‐adrenergic signaling in regulation of cardiac myocyte Ca2+ handling. Biophys J 99, 2038–2047. [DOI] [PMC free article] [PubMed] [Google Scholar]
- Song L, Alcalai R, Arad M, Wolf CM, Toka O, Conner DA, Berul CI, Eldar M, Seidman CE & Seidman JG (2007). Calsequestrin 2 (CASQ2) mutations increase expression of calreticulin and ryanodine receptors, causing catecholaminergic polymorphic ventricular tachycardia. J Clin Invest 117, 1814–1823. [DOI] [PMC free article] [PubMed] [Google Scholar]
- Starmer CF, Lastra AA, Nesterenko VV & Grant AO (1991). Proarrhythmic response to sodium channel blockade. Theoretical model and numerical experiments. Circulation 84, 1364–1377. [DOI] [PubMed] [Google Scholar]
- Terentyev D, Kubalova Z, Valle G, Nori A, Vedamoorthyrao S, Terentyeva R, Viatchenko‐Karpinski S, Bers DM, Williams SC, Volpe P & Gyorke S (2008). Modulation of SR Ca release by luminal Ca and calsequestrin in cardiac myocytes: effects of CASQ2 mutations linked to sudden cardiac death. Biophys J 95, 2037–2048. [DOI] [PMC free article] [PubMed] [Google Scholar]
- Terentyev D, Nori A, Santoro M, Viatchenko‐Karpinski S, Kubalova Z, Gyorke I, Terentyeva R, Vedamoorthyrao S, Blom NA, Valle G, Napolitano C, Williams SC, Volpe P, Priori SG & Gyorke S (2006). Abnormal interactions of calsequestrin with the ryanodine receptor calcium release channel complex linked to exercise‐induced sudden cardiac death. Circ Res 98, 1151–1158. [DOI] [PubMed] [Google Scholar]
- The Cardiac Arrhythmia Suppression Trial (CAST) Investigators (1989). Preliminary report: effect of encainide and flecainide on mortality in a randomized trial of arrhythmia suppression after myocardial infarction. N Engl J Med 321, 406–412. [DOI] [PubMed] [Google Scholar]
- Tokumitsu H, Chijiwa T, Hagiwara M, Mizutani A, Terasawa M & Hidaka H (1990). KN‐62, 1‐[N,O‐bis(5‐isoquinolinesulfonyl)‐N‐methyl‐l‐tyrosyl]‐4‐phenylpiperazi ne, a specific inhibitor of Ca2+/calmodulin‐dependent protein kinase II. J Biol Chem 265, 4315–4320. [PubMed] [Google Scholar]
- van der Werf C, Kannankeril PJ, Sacher F, Krahn AD, Viskin S, Leenhardt A, Shimizu W, Sumitomo N, Fish FA, Bhuiyan ZA, Willems AR, van der Veen MJ, Watanabe H, Laborderie J, Haissaguerre M, Knollmann BC & Wilde AA (2011). Flecainide therapy reduces exercise‐induced ventricular arrhythmias in patients with catecholaminergic polymorphic ventricular tachycardia. J Am Coll Cardiol 57, 2244–2254. [DOI] [PMC free article] [PubMed] [Google Scholar]
- van Oort RJ, McCauley MD, Dixit SS, Pereira L, Yang Y, Respress JL, Wang Q, De Almeida AC, Skapura DG, Anderson ME, Bers DM & Wehrens XH (2010). Ryanodine receptor phosphorylation by calcium/calmodulin‐dependent protein kinase II promotes life‐threatening ventricular arrhythmias in mice with heart failure. Circulation 122, 2669–2679. [DOI] [PMC free article] [PubMed] [Google Scholar]
- Viatchenko‐Karpinski S, Terentyev D, Gyorke I, Terentyeva R, Volpe P, Priori SG, Napolitano C, Nori A, Williams SC & Gyorke S (2004). Abnormal calcium signaling and sudden cardiac death associated with mutation of calsequestrin. Circ Res 94, 471–477. [DOI] [PubMed] [Google Scholar]
- Watanabe H, Chopra N, Laver D, Hwang HS, Davies SS, Roach DE, Duff HJ, Roden DM, Wilde AA & Knollmann BC (2009). Flecainide prevents catecholaminergic polymorphic ventricular tachycardia in mice and humans. Nat Med 15, 380–383. [DOI] [PMC free article] [PubMed] [Google Scholar]
- Watanabe H, Steele DS & Knollmann BC (2011). Mechanism of antiarrhythmic effects of flecainide in catecholaminergic polymorphic ventricular tachycardia. Circ Res 109, 712–713. [DOI] [PubMed] [Google Scholar]
- Wilde AA, Bhuiyan ZA, Crotti L, Facchini M, De Ferrari GM, Paul T, Ferrandi C, Koolbergen DR, Odero A & Schwartz PJ (2008). Left cardiac sympathetic denervation for catecholaminergic polymorphic ventricular tachycardia. N Engl J Med 358, 2024–2029. [DOI] [PubMed] [Google Scholar]
- Yang JH & Saucerman JJ (2012). Phospholemman is a negative feed‐forward regulator of Ca2+ in β‐adrenergic signaling, accelerating β‐adrenergic inotropy. J Mol Cell Cardiol 52, 1048–1055. [DOI] [PMC free article] [PubMed] [Google Scholar]
- Zhu Y, Kyle JW & Lee PJ (2006). Flecainide sensitivity of a Na channel long QT mutation shows an open‐channel blocking mechanism for use‐dependent block. Am J Physiol Heart Circ Physiol 291, H29–37. [DOI] [PubMed] [Google Scholar]


