

Abstract
Suspected non-Alzheimer disease pathophysiology (SNAP) is a biomarker-based concept that applies to individuals with normal levels of amyloid-β biomarkers in the brain, but in whom biomarkers of neurodegeneration are abnormal. The term SNAP has been applied to individuals who are clinically normal for their age and to individuals with mild cognitive impairment, but is applicable to any amyloid-negative, neurodegeneration-positive individual regardless of clinical status, except when the pathology underlying neurodegeneration can be confidently inferred from the clinical presentation. SNAP is present in ~23% of clinically normal individuals aged >65 years and in ~25% of mildly cognitively impaired individuals. APOE4 is underrepresented in individuals with SNAP compared with amyloid-positive individuals. Clinically normal and mildly impaired individuals with SNAP have worse clinical and/or cognitive outcomes than individuals with normal levels of neurodegeneration and amyloid-β biomarkers. In this Perspectives article we describe the available data on SNAP and address topical controversies in the field.
Introduction
Suspected non-Alzheimer disease (AD) pathophysiology (SNAP) is a biomarker-based concept denoting AD-like neurodegeneration in individuals without β-amyloidosis. SNAP was first described in a study1 in which the National Institute on Aging–Alzheimer’s Association (NIA–AA) criteria of preclinical AD2 were examined. The NIA–AA criteria rely on biomarkers to classify individuals as either amyloid-β-positive or amyloid-β-negative, and as neurodegeneration-positive or neurodegeneration-negative.2–5 Five biomarkers are used in the NIA–AA classification. Biomarkers of fibrillary β-amyloid deposition are high ligand retention on amyloid PET and low levels of amyloid-β42 in the cerebrospinal fluid (CSF). The biomarkers of AD-related neurodegeneration are high levels of tau in CSF, brain hypometabolism as assessed by 18F-FDG–PET and atrophy as assessed by anatomic MRI.5 Signature topographic patterns characteristic of AD6 revealed by 18F-FDG–PET and MRI are used as evidence of AD-related neurodegeneration (Figure 1). Preclinical AD was a new concept, in which clinically normal individuals with biomarker evidence of AD pathology were hypothesized to be on the trajectory towards symptomatic AD.2 The NIA–AA preclinical AD workgroup who proposed this concept operated under the assumption that the term ‘AD’ referred to the pathological condition and that clinical symptoms resulting from the pathological condition are not required in the definition of AD.2 The NIA–AA staging framework for preclinical AD2 is based on biomarker combinations and cognition: stage 1 refers to amyloidosis without neurodegeneration (A+N−), stage 2 refers to amyloidosis plus neurodegeneration (A+N+) and stage 3 refers to amyloidosis plus neurodegeneration (A+N+) plus subtle cognitive deficit(s) (Box 1).
Figure 1. Signature patterns of AD.
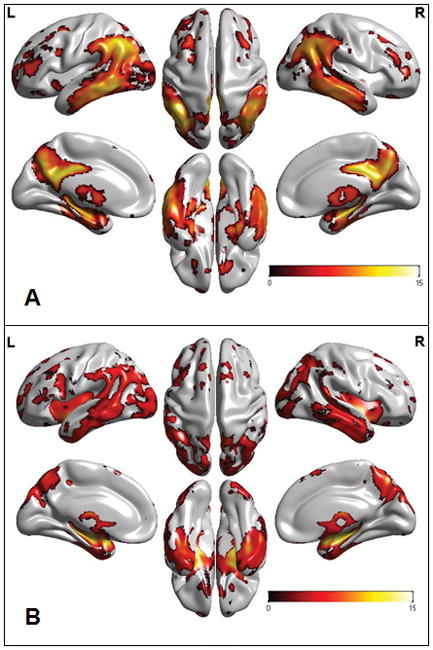
Individuals with AD dementia (n = 50) were age-matched and sex-matched with cognitively normal elderly individuals (n = 50). a | 18F-FDG–PET maps (FWE threshold set at P <0,001) illustrate decreased FDG uptake in the basal temporal, lateral temporal–parietal, lateral prefrontal, and posterior cingulate–precuneus areas in individuals with AD dementia compared with cognitively normal elderly individuals. This spatial pattern constitutes an “AD-signature” in FDG PET. b | Structural MRI maps (FWE threshold set at P <0.05) illustrate grey matter loss in the medial, basal and lateral temporal, lateral parietal, occipital, insula, and precuneus areas in individuals with AD dementia compared with cognitively normal elderly individuals. This spatial pattern constitutes an “AD-signature” in structural MRI. All voxel-based comparison images were generated with SPM5. 3D displays were generated by Brain Net Viewer.95 The colour bar scale indicates the t-test differences between the groups. Abbreviations: AD, Alzheimer disease; FEW, family-wise error; L, left; R, right; SPM5, statistical parametric mapping. From Jack et al. 2013 with permission. 88
Box 1. Terminology for classification of individuals.
A−N−: NIA–AA preclinical stage 0
A+N−: NIA–AA preclinical stage 1
A+N+: NIA–AA preclinical stages 2 and 3
A−N+: SNAP
Abbreviations: A, amyloidosis; N, neurodegeneration; NIA–AA, National Institute on Aging–Alzheimer’s Association; SNAP, suspected non-Alzheimer disease pathophysiology.
In the study in which SNAP was first described, 450 clinically normal individuals aged > 70 years were classified using amyloid plaque density assessed by PET, brain metabolism assessed by 18F-FDG–PET and hippocampal volume assessed by MRI (see Supplementary Table online).1 Of this sample, 31% of participants were at NIA–AA preclinical AD stages 1–3; 43% had neither amyloidosis nor neurodegeneration (A−N−) and were classified as being at stage 0.1 23% of participants had neurodegeneration without amyloidosis (A−N+). The term SNAP was used to convey the notion that the latter group did not represent preclinical AD, but rather had biomarker evidence of non-AD neurodegenerative processes (Figure 2).1 The proportion of APOE4 carriers in the SNAP group was 13%, much lower than that in individuals with preclinical AD (~40%), and half that in individuals at stage 0 (24%). This observation supported the view that SNAP was not simply the result of measurement or classification errors, but rather had a biological basis. Controversies followed the publication of the SNAP concept.1,7
Figure 2. Imaging differences between preclinical AD stage 1 and SNAP.
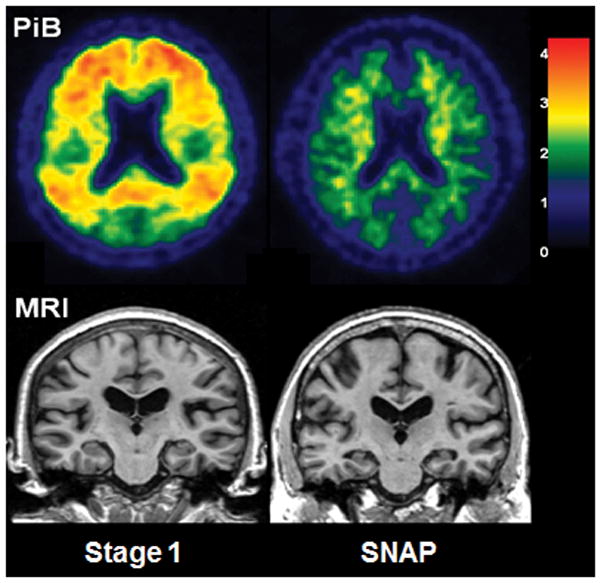
Left-hand column, clinically normal 75 years old woman with abnormal amyloid-β levels as seen by PET and normal brain structure as seen by MRI, who was diagnosed as having preclinical AD stage 1. Right-hand column, clinically normal 77 years old woman with normal amyloid-β levels as seen by PET and visually obvious atrophic hippocampi as seen by MRI, who was diagnosed as having SNAP. Abbreviations: AD, Alzheimer disease; SNAP, suspected non-AD pathophysiology.
Clinically normal individuals
Most studies in which the SNAP concept was used have not been focused on SNAP as a primary aim, but were designed to evaluate diagnostic criteria of AD that incorporate biomarkers. Different methods were used to classify the participants in these studies (see Supplementary Table online). Some studies used imaging alone,1,8–11 others CSF biomarkers alone,12–14 others CSF biomarkers combined with imaging.15 The proportion of individuals with SNAP among clinically normal participants aged >65 years was very consistent across these studies, many of which, perhaps coincidently, reported exactly 23% (see Supplementary Table online). Compared with other concepts used in the field of cognitive ageing, this consistency is unusual and supports the legitimacy of the SNAP concept.
Clinical and/or cognitive outcomes have been described in several of these cohorts (see Supplementary Table online and Figure 3). Average follow-up times ranged from 1.3 to 6 years. Although progression rates vary by study, a common pattern for the risk of clinical progression to mild impairment or dementia or cognitive decline overall is apparent. This risk is greatest for preclinical AD stage 3, next for preclinical AD stage 2, next for preclinical AD stage 1 or SNAP, and is the lowest for preclinical AD stage 0. The risk of cognitive decline seems to be greater for preclinical AD stage 1 than for SNAP when CSF biomarkers alone are used, but not when imaging is used (see Supplementary Table online and Figure 3). This observation could indicate that some neurodegeneration biomarkers are more sensitive than others at predicting imminent cognitive decline.15 It could also simply reflect a confounding interaction between the biomarkers selected for use in individual cohorts and the characteristics of those cohorts. Each research group tends to use one set of biomarkers and the inherent predisposition to clinical progression is undoubtedly not equal among different cohorts.
Figure 3. Comparisons of clinical outcomes of individuals with preclinical AD and SNAP across different cohorts.

The percentages of individuals within each group who progressed clinically from being clinically normal to having mild cognitive impairment or dementia are shown for four different studies. Abbreviations: AD, Alzheimer disease; ADC, Amsterdam Dementia cohort; ADNI, Alzheimer’s Disease Neuroimaging Initiative; MCSA, Mayo Clinic Study on Aging; SNAP, suspected non-AD pathophysiology; Wash U, Washington University.
Several studies examined the cognitive profiles of clinically normal individuals classified according to biomarkers of b-amyloidosis and neurodegeneration at baseline (see Supplementary Table online).8,9,12,14 Overall, no significant differences in cognitive performance were observed between the SNAP group and the A−N− or A+N− groups. Therefore, the consensus at this time is that SNAP does not have a distinct cognitive phenotype among clinically normal individuals.
Studies in which imaging was used to classify clinically normal individuals into different biomarker-based groups indicated that men are more likely to have SNAP than women, which does not seem to be the case when CSF is used for classification into amyloid pathology and neurodegeneration (see Supplementary Table online). Individuals with SNAP also tend to be older than those at preclinical AD stages 0 or 1. All studies indicate that APOE4 is markedly less common in SNAP than in preclinical AD (A+N− and A+N+). Some studies indicate that APOE4 is less common in SNAP than in the A−N− reference group.1,8,9 These observations are logical given that APOE4 is a major risk factor for Aβ pathology.16,17
Clinical and imaging features of cerebrovascular disease and Lewy body disease18 were assessed among 430 clinically normal individuals classified in preclinical AD and SNAP categories.19 Some of these features were more prevalent in individuals with SNAP than in A−N− individuals, but were not different between individuals with SNAP and A+N+ individuals. These results could be interpreted to indicate that neither subclinical cerebrovascular disease nor Lewy body disease are likely to be the substrates of the neurodegeneration observed in SNAP; however, the fact that these features were more prevalent in the SNAP than in the A−N− group argues against this conclusion. An alternative interpretation would attribute the findings to age differences among biomarker groups. The frequency of cerebrovascular disease and Lewy body disease increases with ageing and individuals with SNAP were older than A−N− individuals, but had about the same age as A+N+ individuals.
One study that examined the changes in the frequency of biomarker-based groups with age20 found that the frequency of SNAP was 0 in the 50–60 years age range and then increased monotonically, reaching 24% by 89 years of age. Therefore, the frequency of SNAP in the population is not static, but increases with ageing after age 60 years.
The characteristics of clinically normal individuals aged >70 years who were documented to become newly amyloid-positive by serial imaging of amyloid plaques by PET were assessed.21 42% of the individuals who met the criteria of incident amyloid positivity had SNAP at baseline and later transitioned to A+N+. As SNAP represents one or more of the non-AD processes that are common in the elderly, the researchers concluded that frequently finding elderly individuals with SNAP at baseline who later develop evidence of β-amyloidosis was entirely logical.21 As β-amyloidosis accumulates slowly (over decades),22–24 individuals with SNAP who became amyloid-β-positive over a short interval undoubtedly had amyloid-β values close to the threshold of detection at baseline.
Cognitively impaired individuals
SNAP is a biomarker-based concept that is independent of any particular level of clinical impairment. As in the studies of clinically normal individuals, studies of individuals with mild cognitive impairment (MCI) used several different classification methods (see Supplementary Table online). The proportions of individuals with SNAP within the MCI group reported in these studies were more variable than those reported within clinically normal individuals. This difference is likely to be due to several factors, including smaller sample sizes, differences in recruitment methods—and hence the characteristics of participants in the different study populations—and the inherent heterogeneity of MCI. SNAP was found in 17% of participants in the Alzheimer’s Disease Neuroimaging Initiative,25 17% of those in the study by Caroli et al.,26 20% of those in the study by Prestia et al.,27 29% of those in the study by Vos et al.,28 29% of those in the Mayo Clinic Study of Aging,25 and 35% of those in the study by Duara et al.29 In the Alzheimer’s Disease Neuroimaging Initiative,30 7% of participants who were clinically diagnosed as having AD dementia met the criteria of SNAP.
The rates of clinical progression to dementia among individuals with MCI and SNAP have been assessed, with average follow-up times ranging from 1 to 2.5 years in different cohorts (see Supplementary Table online). In the study by Prestia et al.,27 47% of individuals with MCI and SNAP progressed to dementia compared with 100% of the A+N+, 27% of the A+N− and 5% of the A−N− groups. In the Mayo Clinic Study of Aging,25 21% of individuals with MCI and SNAP progressed to dementia compared with 16% of the A+N+, 0% of the A+N− and 8% of the A−N− groups. In the Alzheimer’s Disease Neuroimaging Initiative,25 40% of individuals with MCI and SNAP progressed to dementia, compared with 42% of the A+N+, 0% of the A+N− and 11% of the A−N− groups.
Caroli et al.26 found that progressive cognitive deterioration in individuals with MCI and SNAP was more frequent than in A−N− and A+N− individuals with MCI, but less frequent than in A+N+ individuals with MCI. Of the 19 patients with SNAP and MCI at baseline who progressed to dementia, seven developed clinically defined non-AD dementias and the remaining 12 developed clinically defined AD dementia. Neurodegeneration was defined as either hippocampal atrophy or hypometabolism (assessed with 18F-FDG–PET) in AD-like neocortical areas. Caroli et al.26 suggested that these two different sources of biomarker information about neurodegeneration might indicate that two different subgroups exist within SNAP.
Vos et al.28 assessed features of individuals classified as mildly impaired (for simplicity referred to as MCI) according to International Working Group31,32 and NIA–AA criteria.3 The proportion of APOE4 carriers among individuals with MCI and SNAP was roughly half that among A+N+ individuals with MCI (32% and 62%, respectively). The rate of progression to clinically defined AD dementia at last follow-up was 21% among individuals with SNAP and MCI, 4% among A−N− individuals with MCI and 59% among A+N+ individuals with MCI. The rate of progression to clinically defined non-AD dementia at last follow-up was 10% among individuals with SNAP and among A−N− individuals with MCI, whereas it was 3% among A+N+ individuals with MCI.
Overall, these studies indicate that the risk of cognitive decline and clinical progression to dementia is greater for individuals with MCI and SNAP than the risk of cognitive decline and progression to either MCI or dementia for clinically normal individuals with SNAP (see Supplementary Table online). The risk profile across biomarker-based groups might also differ between clinically normal and MCI individuals. In individuals with MCI, the risk of cognitive decline is lowest in A−N− and A+N− individuals, intermediate in those with SNAP, and is highest in A+N+ individuals. In clinically normal individuals the risk of decline is lowest in A−N− individuals, intermediate in those with SNAP and in A+N− individuals, and is highest in A+N+ individuals. One exception is the largest study of individuals with MCI,28 in which the risk of cognitive decline was not different between the SNAP and the A+N− MCI groups. The discrepancies in the risk profiles of individuals with MCI reported in different studies might be due to the rarity of A+N− and A−N− individuals with MCI and, therefore, to a lack of power to accurately determine the outcomes of these individuals. Nonetheless, the differences in outcomes observed when the results of the studies are aggregated suggest that a slightly different mix of underlying aetiologies might be present in patients with MCI and SNAP than those present in clinically normal individuals with SNAP.
The number of individuals with MCI and SNAP who progress to what is clinically labelled ‘probable or possible AD dementia’ might seem unusually high as SNAP is a non-AD state. However, two potentially confounding factors must be considered. The first is the frequency of clinical misdiagnosis of AD dementia. Up to a third of APOE4 non-carrier individuals clinically diagnosed as having AD dementia by experts are amyloidosis-negative according to PET scans,33 and thus their dementia results from pathologies other than AD. Given that APOE4 carriers are underrepresented in the SNAP group relative to the A+N− and A+N+ MCI groups, some patients who progressed from having SNAP and MCI to ‘probable or possible AD dementia’ actually had non-AD aetiologies. The second factor is that the levels of amyloid-β in individuals who progress from having MCI and SNAP to clinical AD dementia are more likely to have been very close to the threshold of abnormality at baseline and, therefore, these individuals were more similar to A+N+ individuals than to the rest of the SNAP group.28
Thresholds and cut-off points
All individuals that took part in the studies discussed above were classified categorically as being amyloid-β and neurodegeneration positive or negative. However, we should note that no uniform agreement exists in the field about how to perform these measurements, nor is there agreement on numeric cut-off points denoting normal and abnormal values.34 In fact, the precise methods for classifying individuals according to these biomarker characteristics vary considerably among studies from different centres (see Supplementary Table online). Different assays or platforms used for CSF analyses give different absolute values.35,36 Similarly, the output of quantitative image analyses is heavily dependent on the implementation of image processing pipelines.6 Attempts to standardize imaging and CSF measurements are underway,35,37–39 but standardized methods and agreement on cut-off points have not yet been achieved.
We discuss SNAP and preclinical AD stages in terms of discrete binary classifications of amyloidosis and neurodegeneration, but for many individuals the biomarker values lie near cutoff points. Some individuals classified as having SNAP have a level of neurodegeneration just inside the abnormal range (or have conflicting information from different neurodegeneration biomarkers) and thus do not differ greatly from A−N− individuals. Similarly, some individuals with SNAP whose degree of amyloidosis is very close to the threshold of abnormality can behave clinically more like A+N+ individuals than like SNAP individuals with obviously absent amyloidosis.40 In the studies by Vos et al.,12,28 some clinically normal individuals and some individuals with MCI who progressed to clinical AD dementia had indeed CSF amyloid-β levels very close to the CSF amyloid-β cut-off point that define the presence of amyloidosis.
Pathological basis of SNAP
In addition to AD,41,42 non-AD pathologies are common with advancing age in impaired and clinically normal elderly people.42–46 These pathologies include cerebrovascular disease, α-synucleinopathy, argyrophilic grain disease, TDP-43 proteinopathy and hippocampal sclerosis. Ageing alone (that is, the passage of time) is implicated in brain atrophy and cognitive decline, which probably develop as a result of synapse loss.47,48
Medial temporal tau pathology without amyloidosis might be a major constituent of SNAP.49,50 The term primary age-related tauopathy (PART) has been proposed by Crary et al.51 to describe this phenomenon, although not without controversy.7,52,53 Autopsy studies indicate that medial temporal tau pathology (often without amyloidosis, particularly at young ages) is present in 25% of the population by age 25 years, 50% by age 50 years, and in most individuals aged >75 years.49,50,54,55 Therefore, PART has been argued to be an ageing process separate from AD, the latter requiring amyloidosis.51,56–58 As pointed out by Crary et al.,51 SNAP and PART share some highly salient features: both are common in clinically normal elderly people; APOE4 is underrepresented in both; both increase in prevalence with ageing; and medial temporal lobe pathology features prominently in both. The first autopsy studies in individuals classified antemortem as having SNAP were performed at Washington University.12 Three of the four individuals with SNAP who were studied had low probability of having AD and the fourth did not have AD.58,59 Medial temporal tau pathology without amyloidosis (that is, meeting the criteria of PART51) was detected post-mortem in two of the four individuals. More recent autopsy data from the Mayo Clinic also indicates that individuals in whom imaging findings meet the criteria of a SNAP diagnosis in life uniformly have non-AD diagnoses at autopsy.60
In summary, a variety of non-AD processes are likely to contribute to neurodegeneration in individuals who meet the criteria of SNAP. Developmental factors might also play a part. This lack of specificity could be interpreted as undermining the utility of the SNAP concept; however, many examples of useful constructs with different aetiologies exist in medicine and biology. For example, neurodegeneration is a pathologic condition and MCI and dementia are clinical conditions with many aetiologies.
Defining a non-AD aetiology
The biomarkers of neurodegeneration that are characteristic of AD—medial temporal lobe atrophy assessed by MRI, hypometabolism in temporal–parietal regions assessed by 18F-FDG–PET and abnormally elevated levels of total tau in CSF—also define SNAP. We indicate total tau rather than phosphorylated tau because total tau is a non-specific marker of neuronal injury and neurodegeneration which is elevated in AD, while phosphorylated tau is specific for neurofibrillary tangle pathology of AD.61 We recognize that this similarity might seem incongruous, but not if one views these processes as independent of amyloid-β.
The patterns of atrophy and hypometabolism in non-AD conditions often overlap spatially with the patterns seen in AD. This overlap is probably most obvious in the medial temporal lobe. Hippocampal atrophy is a prominent and early feature in typical AD, but it is also a prominent feature of hippocampal sclerosis,62 ,63,64 TDP-43 pathology,65 argyrophilic grain disease, anoxic–ischaemic injury66 and in ageing48 (Figure 4). Temporoparietal hypometabolism is found in non-AD conditions, such as corticobasal degeneration, primary progressive aphasia,67 and cerebrovascular disease.11 The AD-like hypometabolism in posterior association areas that is observed in PART can be explained by the fact that these areas are highly connected, both structurally and functionally, to the medial temporal lobe.68–71
Figure 4. Topographic atrophy patterns.
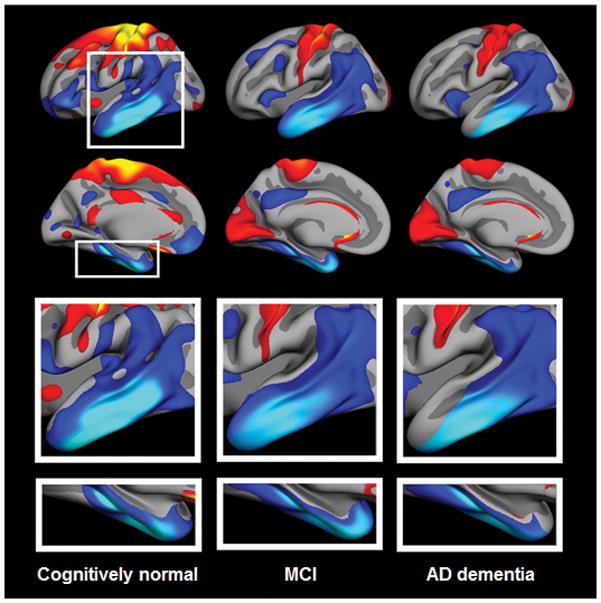
Patterns of atrophy rates in individuals enrolled in the Alzheimer Disease Neuroimaging Initiative, diagnosed as clinically normal, or with MCI or AD dementia. Left column, maps of atrophy rates from serial MRI in clinically normal elderly individuals who were amyloid-β-negative (as assessed by measurement of amyloid-β42 levels in the CSF) and APOE4 negative. Middle and right columns, similar maps from individuals with MCI and AD dementia, respectively. The top-row images are left lateral surface. The bottom-row images are left medial surface views. Atrophy rates are scaled within each group and changes are displayed relative to within-group means. A common topographic pattern of standardized rates of change is present in the lateral and medial temporal lobe across groups. The rates of loss of brain volume in AD-signature regions are not necessarily associated with amyloid-β, nor with APOE4 carrier status, and therefore cannot be ascribed solely to AD but rather seem to be a feature of normal ageing. Abbreviations: AD, Alzheimer disease; MCI, mild cognitive impairment. From Fjell et al. 2013 with permission. 48
The aetiological non-specificity of atrophy and hypopmetabolism observed by MRI and 18F-FDG–PET in areas of the brain associated with has given rise to the concept that the brain networks in these areas can be vulnerable to a variety of insults associated with AD, non-AD disorders and ageing.47,48,56,72,73 The same logic applies to elevated total tau levels in CSF, which are seen in conditions other than AD, including ischemic cerebrovascular disease, traumatic brain injury, and Creutzfeldt–Jacob disease.74
‘A’ for ‘amyloid’ or for ‘AD’?
SNAP was originally coined as an abbreviation for “suspected non-AD pathophysiology”,1 but the term has also been referred to as an abbreviation for “suspected non-amyloid pathophysiology” 26 (even if “non-amyloid” is known, not suspected, in someone with a negative result in the amyloid-β biomarker analysis) These semantic differences define two important points of view. One is that biomarker evidence of β-amyloidosis alone is not sufficient to define AD pathophysiology. The other perspective is that biomarker evidence of β-amyloidosis alone is sufficient to define AD pathophysiology, and thus amyloid-β negative, neurodegeneration positive individuals (those with SNAP) should be classified as having a “non-AD” condition. As the co-authors of this article do not unanimously agree on these points of view, we present the arguments on both sides of the issue.
The argument for defining SNAP as “suspected non-amyloid pathophysiology” has several lines of support. First, the term “non-amyloid” accurately reports an observation about an individual without the assumptions that A+N−, SNAP, both of these conditions, or neither of them represent AD. Second, if preclinical A+N− is AD, whereas preclinical SNAP is not, then the likelihood of progression to more advanced stages of clinical and biomarker-defined AD should be greater for preclinical A+N− than for SNAP; however, this result was not consistently found among the different studies that examined clinical outcomes (see Supplementary Table online). Third, the neuropathological definition of AD requires both β-amyloidosis and tau pathology.58,59 Therefore, both β-amyloidosis and neurodegeneration should be required as biomarker evidence of AD pathophysiology. A+N− does not meet these criteria any more than SNAP. Finally, if the amyloid cascade hypothesis75 is not correct for late-onset AD (that is, if β-amyloidosis is not an upstream driver of the AD pathophysiological cascade that leads to neurodegeneration), then labelling A+N− as preclinical AD is not more reasonable than doing so with SNAP.76–78
The argument for defining SNAP as “suspected non-AD pathophysiology” likewise has several lines of support. First, non-AD processes are prevalent in the elderly population, as seen by autopsy studies,42–44,51 and these processes should be evidenced by neurodegenerative biomarker abnormalities. “Suspected non-AD pathophysiology” seems the only logical label when SNAP is due to one or more of these non-AD processes. Second, medial temporal tau pathology without β-amyloidosis is explicitly defined as an ageing phenomenon separate from AD in the most recent pathological criteria for AD assessment58,59 and in the position paper in which the diagnostic criteria for PART are defined.51 As PART is one of the contributing aetiologies to SNAP, labelling SNAP “non-AD” is appropriate. Finally, if the amyloid cascade hypothesis75 is correct (that is, if β-amyloidosis drives AD-related neurodegeneration in the AD pathological cascade in early-onset and late-onset AD79–81) then imaging and/or biomarker evidence of β-amyloidosis without neurodegeneration should be labelled “AD”, whereas SNAP should be labelled “non-AD”. Genetics provides strong evidence that β-amyloidosis is an upstream driver of the AD pathological cascade. Mutations that increase amyloid-β production or aggregation inevitably lead to clinical and pathological AD82 in young individuals, and a mutation that decreases amyloid-β42 production protects against development of clinical AD and cognitive decline in the elderly.83 By contrast, genetically determined tauopathies do not lead to clinical or pathological AD.84
Whether the “A” in SNAP stands for “amyloid” or “AD” is a semantic difference important to conceptual precision. How SNAP is defined also serves to define AD (and vice-versa), particularly in clinically asymptomatic individuals in whom the full pathophysiological cascade of AD has yet to play out and in whom no clinical indicators of underlying pathophysiology are present. Some researchers who believe SNAP should be included as part of the AD spectrum point to the high prevalence of clinically normal individuals with SNAP (23%) as evidence that the amyloid-centric models of AD biomarkers and the concept of preclinical AD (as now defined2,85,86–87) are flawed. Viewed from the perspective that SNAP is not AD, however, the SNAP concept is completely consistent with Aβ-centric models of AD biomarkers and the current definition of preclinical AD.2 From this second perspective, SNAP represents biomarker evidence of the non-AD pathologies that autopsy data indicate are frequent in the elderly.42–44 Biomarker evidence of non-AD pathologies (that is, SNAP) may or may not precede β-amyloidosis in specific individuals,21,88 but in either instance β-amyloid seems to act as a biological driver of tauopathy.23,57,89 ,90–92 Use of PET for detecting tau, a novel technique that, for the first time, enables in vivo determination of the anatomic distribution of tau pathology,93–95 will shed light on this debate in the future.
Summary
SNAP is a biomarker-based concept that fills a gap in the characterization of cognitively normal and impaired individuals (except those individuals with cognitive impairment in whom the underlying pathology can be confidently inferred from the clinical syndrome, such as those with progressive supranuclear palsy, Lewy Body disease, semantic variant primary progressive aphasia, etc.). The findings that SNAP is common in the population and that clinically normal individuals and those with MCI who have SNAP have a greater risk of clinical or cognitive decline than biomarker-negative (A−N−) individuals have implications for counselling patients with subjective cognitive complaints or MCI in clinical practice.
Supplementary Material
Footnotes
Competing interests
C.R.J.Jr has provided consulting services for Eli Lilly and receives research funding from the NIH and the Alexander Family Alzheimer’s Disease Research Professorship of the Mayo Foundation. D.S.K. is a Deputy Editor for Neurology®.; is on a data safety monitoring board for Lundbeck Pharmaceuticals and for the Dominantly Inherited Alzheimer’s Disease Treatment Unit; is participating in clinical trials sponsored by Lilly Pharmaceuticals and TauRx Pharmaceuticals; and receives research support from the NIH. D.D. receives research support from the NIH (P50-AG016574; P50-NS072187; P01-AG003949) and CurePSP: Foundation for PSP/CBD and Related Disorders; is an Editorial Board Member of Acta Neuropathologica, Annals of Neurology, Brain, Brain Pathology and Neuropathology; and is Editor-in-Chief of the American Journal of Neurodegenerative Disease and the International Journal of Clinical and Experimental Pathology. A.M.F. has provided consulting services for Eli Lilly, Roche, AbbVie, IBL International and Novartis; and receives research funding from the NIH, the DIAN Pharma Consortium and the Alzheimer’s Association. W.J. is a consultant to Synarc–Bioclinica and to Banner Alzheimer’s Institute–Genentech. E.C.M. receives funding from the NIH. R.C.P. is on a data monitoring committee for Pfizer and Janssen Alzheimer Immunotherapy; is a consultant for Merck, Roche, and Genentech; receives royalties from publishing Mild Cognitive Impairment (Oxford University Press, 2003); and receives research support from the NIH. R.A.S. has been a consultant for Janssen Eisai, Lundbeck, Isis, Boehringer Ingelheim, Roche and Genentech; and receives research support from the Alzheimer’s Association, Fidelity Biosciences, Janssen, BrightFocus Foundation and the National Institute on Aging. W.M.v.d.F. has provided consulting services for Boehringer Ingelheim; receives research funding from the Netherlands Organisation for Scientific Research (NWO), ZonMw, Cardiovasculair Onderzoek Nederland, Boehringer Ingelheim, and European Union (EU) 7th Framework Programme (FP7). All funds are paid to her institution. The VUmc Alzheimer Center is supported by Alzheimer Nederland and Stichting VUmc Fonds. Research of the VUmc Alzheimer Center is part of the neurodegeneration research program of the Neuroscience Campus Amsterdam. V.L.V. has provided consulting services for Bayer Healthcare and Novartis; has received speaker’s honoraria from GE Healthcare, Piramal Imaging and Astra Zeneca; and is supported by a Senior Research Fellowship, and receives research funding, from the National Health Medical Research Council of Australia. P.J.V. has provided consulting services for Élan–Wyeth, Ipsen, Bristol–Myers Squibb, and Roche Diagnostics; and receives research funding from EU Joint Programme–Neurodegenerative Disease Research (JPND) and ZonMw, and from EU FP7 and Innovative Medicines Initiative joint resources, which are composed of financial contributions from EU FP7 (FP7/2007-2013) and in-kind contributions from the European Federation of Pharmaceutical Industries and Associations (EFPIA). S.J.B.V. receives research support from the Innovative Medicines Initiative Joint Undertaking under EMIF grant agreement n° 115372, resources that are composed of financial contributions from EU FP7 (FP7/2007-2013) and in-kind contributions from EFPIA. G.C. and G.B.F. declare no competing interests.
Contributor Information
Clifford R. Jack, Jr, Department of Radiology, Mayo Clinic and Foundation, 200 First Street SW, Rochester, Minnesota 55905, USA.
David S. Knopman, Department of Neurology, Mayo Clinic and Foundation, 200 First Street SW, Rochester, Minnesota 55905, USA
Gaël Chételat, INSERM, Université de Caen, EPHE, CHU de Caen, U1077, Caen, France.
Dennis Dickson, Department of Pathology, Mayo Clinic and Foundation, 4500 San Pablo Road South, Jacksonville, Florida 32224, USA.
Anne M. Fagan, Department of Neurology, Knight Alzheimer’s Disease Research Center, Washington University School of Medicine, 4488 Forest Park Avenue, Suite 101, St Louis, Missouri 63108, USA
Giovanni B. Frisoni, University Hospitals and University of Geneva, Rue Gabrielle-Perret-Gentil 4, 1205 Genève, Switzerland
William Jagust, Helen Wills Neuroscience Institute, University of California Berkeley, 175 Li Ka Shing Center, Berkeley, California 94720, USA.
Elizabeth C. Mormino, Department of Neurology, Massachusetts General Hospital, Harvard Medical School, 221 Longwood Avenue, Boston, Massachusetts 02115, USA
Ronald C. Petersen, Department of Neurology, Mayo Clinic and Foundation, 200 First Street SW, Rochester, Minnesota 55905, USA
Reisa A. Sperling, Department of Neurology, Massachusetts General Hospital, Harvard Medical School, 221 Longwood Avenue, Boston, Massachusetts 02115, USA
Wiesje M. van der Flier, Alzheimer Center, Department of Neurology, VU University Medical Center, Neuroscience Campus Amsterdam, PO Box 7057, 1007 MB Amsterdam, Netherlands
Victor L. Villemagne, Department of Molecular Imaging & Therapy, Centre for PET, Austin Health, 145 Studley Road, PO Box 5555 Melbourne, Victoria, Australia 3084
Pieter J. Visser, Department of Psychiatry and Neuropsychology, Institute of Mental Health and Neuroscience, Maastricht University, PO Box 616 MD Maastricht, Netherlands
Stephanie J. B. Vos, Department of Psychiatry and Neuropsychology, Institute of Mental Health and Neuroscience, Maastricht University, PO Box 616 MD Maastricht, Netherlands
References
- 1.Jack CR, Jr, Knopman DS, Weigand SD, et al. An operational approach to NIA-AA crtiteria for preclinical Alzheimer’s disease. Ann Neurol. 2012;71:765–75. doi: 10.1002/ana.22628. [DOI] [PMC free article] [PubMed] [Google Scholar]
- 2.Sperling RA, Aisen PS, Beckett LA, et al. Toward defining the preclinical stages of Alzheimer’s disease: recommendations from the National Institute on Aging-Alzheimer’s Assocation workgroups on diagnostic guidelines for Alzheimer’s disease. Alzheimers Dement. 2011;7:280–92. doi: 10.1016/j.jalz.2011.03.003. [DOI] [PMC free article] [PubMed] [Google Scholar]
- 3.Albert MS, DeKosky ST, Dickson D, et al. The diagnosis of mild cognitive impairment due to Alzheimer’s disease: Recommendations from the National Institute on Aging and Alzheimer’s Association Workgroup. Alzheimers Dement. 2011;7:270–9. doi: 10.1016/j.jalz.2011.03.008. [DOI] [PMC free article] [PubMed] [Google Scholar]
- 4.McKhann GM, Knopman DS, Chertkow H, et al. The diagnosis of dementia due to Alzheimer’s disease: Recommendations from the National Institute on Aging and the Alzheimer’s Assocation Workgroup. Alzheimers Dement. 2011;7:263–9. doi: 10.1016/j.jalz.2011.03.005. [DOI] [PMC free article] [PubMed] [Google Scholar]
- 5.Jack CR, Jr, Albert MS, Knopman DS, et al. Introduction to the recommendations from the National Institute on Aging-Alzheimer’s Association workgroups on diagnostic guidelines for Alzheimer’s disease. Alzheimers Dement. 2011;7:257–62. doi: 10.1016/j.jalz.2011.03.004. [DOI] [PMC free article] [PubMed] [Google Scholar]
- 6.Senjem ML, Gunter JL, Shiung MM, Petersen RC, Jack CR., Jr Comparison of different methodological implementations of voxel-based morphometry in neurodegenerative disease. Neuroimage. 2005;26:600–8. doi: 10.1016/j.neuroimage.2005.02.005. [DOI] [PMC free article] [PubMed] [Google Scholar]
- 7.Duyckaerts C, Braak H, Brion JP, et al. PART is part of Alzheimer disease. Acta Neuropathol. 2015 doi: 10.1007/s00401-015-1390-7. [DOI] [PMC free article] [PubMed] [Google Scholar]
- 8.Knopman DS, Jack CR, Jr, Wiste HJ, et al. Short-term clinical outcomes for stages of NIA-AA preclinical Alzheimer disease. Neurology. 2012;78:1576–82. doi: 10.1212/WNL.0b013e3182563bbe. [DOI] [PMC free article] [PubMed] [Google Scholar]
- 9.Mormino EC, Betensky RA, Hedden T, et al. Synergistic Effect of beta-Amyloid and Neurodegeneration on Cognitive Decline in Clinically Normal Individuals. JAMA Neurol. 2014;71:1379–85. doi: 10.1001/jamaneurol.2014.2031. [DOI] [PMC free article] [PubMed] [Google Scholar]
- 10.Ivanoiu A, Dricot L, Gilis N, et al. Classification of Non-Demented Patients Attending a Memory Clinic using the New Diagnostic Criteria for Alzheimer’s Disease with Disease-Related Biomarkers. J Alzheimers Dis. 2014 doi: 10.3233/JAD-140651. [DOI] [PubMed] [Google Scholar]
- 11.Wirth M, Villeneuve S, Haase CM, et al. Associations Between Alzheimer Disease Biomarkers, Neurodegeneration, and Cognition in Cognitively Normal Older People. JAMA Neurol. 2013 doi: 10.1001/jamaneurol.2013.4013. [DOI] [PMC free article] [PubMed] [Google Scholar]
- 12.Vos SJ, Xiong C, Visser PJ, et al. Preclinical Alzheimer’s disease and its outcome: a longitudinal cohort study. Lancet Neurol. 2013;12:957–65. doi: 10.1016/S1474-4422(13)70194-7. [DOI] [PMC free article] [PubMed] [Google Scholar]
- 13.Roe CM, Fagan AM, Grant EA, et al. Amyloid imaging and CSF biomarkers in predicting cognitive impairment up to 7 5 years later. Neurology. 2013;80:1784–91. doi: 10.1212/WNL.0b013e3182918ca6. [DOI] [PMC free article] [PubMed] [Google Scholar]
- 14.van Harten AC, Smits LL, Teunissen CE, et al. Preclinical AD predicts decline in memory and executive functions in subjective complaints. Neurology. 2013;81:1409–16. doi: 10.1212/WNL.0b013e3182a8418b. [DOI] [PubMed] [Google Scholar]
- 15.Toledo JB, Weiner MW, Wolk DA, et al. Neuronal injury biomarkers and prognosis in ADNI subjects with normal cognition. Acta Neuropathol Commun. 2014;2:26. doi: 10.1186/2051-5960-2-26. [DOI] [PMC free article] [PubMed] [Google Scholar]
- 16.Morris JC, Roe CM, Xiong C, et al. APOE predicts amyloid-beta but not tau Alzheimer pathology in cognitively normal aging. Ann Neurol. 2010;67:122–31. doi: 10.1002/ana.21843. [DOI] [PMC free article] [PubMed] [Google Scholar]
- 17.Vemuri P, Wiste HJ, Weigand SD, et al. Effect of apolipoprotein E on biomarkers of amyloid load and neuronal pathology in Alzheimer disease. Ann Neurol. 2010;67:308–16. doi: 10.1002/ana.21953. [DOI] [PMC free article] [PubMed] [Google Scholar]
- 18.Lim SM, Katsifis A, Villemagne VL, et al. The 18F-FDG PET cingulate island sign and comparison to 123I-beta-CIT SPECT for diagnosis of dementia with Lewy bodies. J Nucl Med. 2009;50:1638–45. doi: 10.2967/jnumed.109.065870. [DOI] [PubMed] [Google Scholar]
- 19.Knopman DS, Jack CR, Jr, Wiste HJ, et al. Brain injury biomarkers are not dependent on beta-amyloid in normal elderly. Ann Neurol. 2013;73:472–80. doi: 10.1002/ana.23816. [DOI] [PMC free article] [PubMed] [Google Scholar]
- 20.Jack CR, Jr, Wiste HJ, Weigand SD, et al. Age-specific population frequencies of cerebral beta-amyloidosis and neurodegeneration among people with normal cognitive function aged 50–89 years: a cross-sectional study. The Lancet Neurology. 2014;13:997–1005. doi: 10.1016/S1474-4422(14)70194-2. [DOI] [PMC free article] [PubMed] [Google Scholar]
- 21.Jack CR, Jr, Wiste HJ, Weigand SD, et al. Amyloid-first and neurodegeneration-first profiles characterize incident amyloid PET positivity. Neurology. 2013;81:1732–40. doi: 10.1212/01.wnl.0000435556.21319.e4. [DOI] [PMC free article] [PubMed] [Google Scholar]
- 22.Villain N, Chetelat G, Grassiot B, et al. Regional dynamics of amyloid-beta deposition in healthy elderly, mild cognitive impairment and Alzheimer’s disease: a voxelwise PiB-PET longitudinal study. Brain. 2012;135:2126–39. doi: 10.1093/brain/aws125. [DOI] [PubMed] [Google Scholar]
- 23.Villemagne VL, Burnham S, Bourgeat P, et al. Amyloid beta deposition, neurodegeneration, and cognitive decline in sporadic Alzheimer’s disease: a prospective cohort study. Lancet Neurol. 2013;12:357–67. doi: 10.1016/S1474-4422(13)70044-9. [DOI] [PubMed] [Google Scholar]
- 24.Jack CR, Jr, Wiste HJ, Lesnick TG, et al. Brain beta-amyloid load approaches a plateau. Neurology. 2013;80:890–6. doi: 10.1212/WNL.0b013e3182840bbe. [DOI] [PMC free article] [PubMed] [Google Scholar]
- 25.Petersen RC, Aisen P, Boeve BF, et al. Criteria for mild cognitive impairment due to alzheimer’s disease in the community. Ann Neurol. 2013 doi: 10.1002/ana.23931. [DOI] [PMC free article] [PubMed] [Google Scholar]
- 26.Caroli A, Prestia A, Galluzzi S, et al. Mild cognitive impairment with suspected nonamyloid pathology (SNAP): Prediction of progression. Neurology. 2015 doi: 10.1212/WNL.0000000000001209. [DOI] [PMC free article] [PubMed] [Google Scholar]
- 27.Prestia A, Caroli A, van der Flier WM, et al. Prediction of dementia in MCI patients based on core diagnostic markers for Alzheimer disease. Neurology. 2013;80:1048–56. doi: 10.1212/WNL.0b013e3182872830. [DOI] [PubMed] [Google Scholar]
- 28.Vos SJ, Verhey F, Frolich L, et al. Prevalence and prognosis of Alzheimer’s disease at the mild cognitive impairment stage. Brain. 2015 doi: 10.1093/brain/awv029. [DOI] [PMC free article] [PubMed] [Google Scholar]
- 29.Duara R, Loewenstein DA, Shen Q, et al. Amyloid positron emission tomography with (18)F-flutemetamol and structural magnetic resonance imaging in the classification of mild cognitive impairment and Alzheimer’s disease. Alzheimers Dement. 2013;9:295–301. doi: 10.1016/j.jalz.2012.01.006. [DOI] [PMC free article] [PubMed] [Google Scholar]
- 30.Lowe VJ, Peller PJ, Weigand SD, et al. Application of the National Institute on Aging-Alzheimer’s Association AD criteria to ADNI. Neurology. 2013;80:2130–7. doi: 10.1212/WNL.0b013e318295d6cf. [DOI] [PMC free article] [PubMed] [Google Scholar]
- 31.Dubois B, Feldman HH, Jacova C, et al. Revising the definition of Alzheimer’s disease: a new lexicon. Lancet Neurol. 2010;9:1118–27. doi: 10.1016/S1474-4422(10)70223-4. [DOI] [PubMed] [Google Scholar]
- 32.Dubois B, Feldman HH, Jacova C, et al. Advancing research diagnostic criteria for Alzheimer’s disease: the IWG-2 criteria. Lancet Neurol. 2014;13:614–29. doi: 10.1016/S1474-4422(14)70090-0. [DOI] [PubMed] [Google Scholar]
- 33.Salloway S, Sperling R, Fox NC, et al. Two phase 3 trials of bapineuzumab in mild-to-moderate Alzheimer’s disease. N Engl J Med. 2014;370:322–33. doi: 10.1056/NEJMoa1304839. [DOI] [PMC free article] [PubMed] [Google Scholar]
- 34.Villeneuve S, Rabinovici GD, Cohn-Sheehy BI, et al. Existing Pittsburgh Compound-B positron emission tomography thresholds are too high: statistical and pathological evaluation. Brain. 2015 doi: 10.1093/brain/awv112. [DOI] [PMC free article] [PubMed] [Google Scholar]
- 35.Mattsson N, Zegers I, Andreasson U, et al. Reference measurement procedures for Alzheimer’s disease cerebrospinal fluid biomarkers: definitions and approaches with focus on amyloid beta42. Biomark Med. 2012;6:409–17. doi: 10.2217/bmm.12.39. [DOI] [PubMed] [Google Scholar]
- 36.Shaw LM, Vanderstichele H, Knapik-Czajka M, et al. Cerebrospinal fluid biomarker signature in Alzheimer’s disease neuroimaging initiative subjects. Ann Neurol. 2009;65:403–13. doi: 10.1002/ana.21610. [DOI] [PMC free article] [PubMed] [Google Scholar]
- 37.Frisoni GB, Jack CR, Bocchetta M, et al. The EADC-ADNI Harmonized Protocol for manual hippocampal segmentation on magnetic resonance: Evidence of validity. Alzheimer’s & Dementia: The Journal of the Alzheimer’s Association. 2014 doi: 10.1016/j.jalz.2014.05.1756. Epub ahead of print. [DOI] [PMC free article] [PubMed] [Google Scholar]
- 38.Klunk WE, Koeppe RA, Price JC, et al. The Centiloid Project: Standardizing quantitative amyloid plaque estimation by PET. Alzheimer’s & dementia. 2015;11:1–15. doi: 10.1016/j.jalz.2014.07.003. [DOI] [PMC free article] [PubMed] [Google Scholar]
- 39.Mattsson N, Andreasson U, Persson S, et al. The Alzheimer’s Association external quality control program for cerebrospinal fluid biomarkers. Alzheimers Dement. 2011;7:386–95. e6. doi: 10.1016/j.jalz.2011.05.2243. [DOI] [PMC free article] [PubMed] [Google Scholar]
- 40.Zwan M, van Harten A, Ossenkoppele R, et al. Concordance between cerebrospinal fluid biomarkers and [11C]PIB PET in a memory clinic cohort. J Alzheimers Dis. 2014;41:801–7. doi: 10.3233/JAD-132561. [DOI] [PubMed] [Google Scholar]
- 41.Savva GM, Wharton SB, Ince PG, Forster G, Matthews FE, Brayne C. Age, neuropathology, and dementia. N Engl J Med. 2009;360:2302–9. doi: 10.1056/NEJMoa0806142. [DOI] [PubMed] [Google Scholar]
- 42.Nelson PT, Head E, Schmitt FA, et al. Alzheimer’s disease is not “brain aging”: neuropathological, genetic, and epidemiological human studies. Acta Neuropathol. 2011;121:571–87. doi: 10.1007/s00401-011-0826-y. [DOI] [PMC free article] [PubMed] [Google Scholar]
- 43.Schneider JA, Aggarwal NT, Barnes L, Boyle P, Bennett DA. The neuropathology of older persons with and without dementia from community versus clinic cohorts. J Alzheimers Dis. 2009;18:691–701. doi: 10.3233/JAD-2009-1227. [DOI] [PMC free article] [PubMed] [Google Scholar]
- 44.Sonnen JA, Santa Cruz K, Hemmy LS, et al. Ecology of the aging human brain. Arch Neurol. 2011;68:1049–56. doi: 10.1001/archneurol.2011.157. [DOI] [PMC free article] [PubMed] [Google Scholar]
- 45.Bennett DA, Schneider JA, Arvanitakis Z, et al. Neuropathology of older persons without cognitive impairment from two community-based studies. Neurology. 2006;66:1837–44. doi: 10.1212/01.wnl.0000219668.47116.e6. [DOI] [PubMed] [Google Scholar]
- 46.Jicha GA, Parisi JE, Dickson DW, et al. Neuropathologic outcome of mild cognitive impairment following progression to clinical dementia. Arch Neurol. 2006;63:674–81. doi: 10.1001/archneur.63.5.674. [DOI] [PubMed] [Google Scholar]
- 47.Jagust W. Vulnerable neural systems and the borderland of brain aging and neurodegeneration. Neuron. 2013;77:219–34. doi: 10.1016/j.neuron.2013.01.002. [DOI] [PMC free article] [PubMed] [Google Scholar]
- 48.Fjell AM, McEvoy L, Holland D, Dale AM, Walhovd KB. Brain changes in older adults at very low risk for Alzheimer’s disease. J Neurosci. 2013;33:8237–42. doi: 10.1523/JNEUROSCI.5506-12.2013. [DOI] [PMC free article] [PubMed] [Google Scholar]
- 49.Braak H, Thal DR, Ghebremedhin E, Del Tredici K. Stages of the pathologic process in Alzheimer disease: age categories from 1 to 100 years. J Neuropathol Exp Neurol. 2011;70:960–9. doi: 10.1097/NEN.0b013e318232a379. [DOI] [PubMed] [Google Scholar]
- 50.Delacourte A, David JP, Sergeant N, et al. The biochemical pathway of neurofibrillary degeneration in aging and Alzheimer’s disease. Neurology. 1999;52:1158–65. doi: 10.1212/wnl.52.6.1158. [DOI] [PubMed] [Google Scholar]
- 51.Crary JF, Trojanowski JQ, Schneider JA, et al. Primary age-related tauopathy (PART): a common pathology associated with human aging. Acta Neuropathol. 2014;128:755–66. doi: 10.1007/s00401-014-1349-0. [DOI] [PMC free article] [PubMed] [Google Scholar]
- 52.Jack CR., Jr PART and SNAP. Acta Neuropathol. 2014;128:773–6. doi: 10.1007/s00401-014-1362-3. [DOI] [PMC free article] [PubMed] [Google Scholar]
- 53.Jellinger KA, Alafuzoff I, Attems J, et al. PART, a distinct tauopathy, different from classical sporadic Alzheimer disease. Acta Neuropathol. 2015 doi: 10.1007/s00401-015-1407-2. Epub ahead of print. [DOI] [PMC free article] [PubMed] [Google Scholar]
- 54.Duyckaerts C, Hauw JJ. Prevalence, incidence and duration of Braak’s stages in the general population: can we know? Neurobiol Aging. 1997;18:362–9. doi: 10.1016/s0197-4580(97)00047-x. discussion 89–92. [DOI] [PubMed] [Google Scholar]
- 55.Duyckaerts C, Uchihara T, Seilhean D, He Y, Hauw JJ. Dissociation of Alzheimer type pathology in a disconnected piece of cortex. Acta Neuropathol. 1997;93:501–7. doi: 10.1007/s004010050645. [DOI] [PubMed] [Google Scholar]
- 56.Delacourte A, Sergeant N, Wattez A, et al. Tau aggregation in the hippocampal formation: an ageing or a pathological process? Exp Gerontol. 2002;37:1291–6. doi: 10.1016/s0531-5565(02)00141-9. [DOI] [PubMed] [Google Scholar]
- 57.Price JL, Morris JC. Tangles and plaques in nondemented aging and “preclinical” Alzheimer’s disease. Ann Neurol. 1999;45:358–68. doi: 10.1002/1531-8249(199903)45:3<358::aid-ana12>3.0.co;2-x. [DOI] [PubMed] [Google Scholar]
- 58.Hyman BT, Phelps CH, Beach TG, et al. National Institute on Aging-Alzheimer’s Association guidelines for the neuropathologic assessment of Alzheimer’s disease. Alzheimers Dement. 2012;8:1–13. doi: 10.1016/j.jalz.2011.10.007. [DOI] [PMC free article] [PubMed] [Google Scholar]
- 59.Montine TJ, Phelps CH, Beach TG, et al. National Institute on Aging-Alzheimer’s Association guidelines for the neuropathologic assessment of Alzheimer’s disease: a practical approach. Acta Neuropathol. 2012;123:1–11. doi: 10.1007/s00401-011-0910-3. [DOI] [PMC free article] [PubMed] [Google Scholar]
- 60.Murray ME, Knopman D, Vemuri P, et al. The relationship of primary age-related tauopathy (PART) to SNAP: controversy or parallel?. AAIC; 2015 July 18–23; Washington, D.C. 2015. [Google Scholar]
- 61.Tapiola T, Alafuzoff I, Herukka SK, et al. Cerebrospinal fluid {beta}-amyloid 42 and tau proteins as biomarkers of Alzheimer-type pathologic changes in the brain. Arch Neurol. 2009;66:382–9. doi: 10.1001/archneurol.2008.596. [DOI] [PubMed] [Google Scholar]
- 62.Jack CR, Jr, Dickson DW, Parisi JE, et al. Antemortem MRI findings correlate with hippocampal neuropathology in typical aging and dementia. Neurology. 2002;58:750–7. doi: 10.1212/wnl.58.5.750. [DOI] [PMC free article] [PubMed] [Google Scholar]
- 63.Nelson PT, Smith CD, Abner EL, et al. Hippocampal sclerosis of aging, a prevalent and high-morbidity brain disease. Acta Neuropathol. 2013;126:161–77. doi: 10.1007/s00401-013-1154-1. [DOI] [PMC free article] [PubMed] [Google Scholar]
- 64.Probst A, Taylor KI, Tolnay M. Hippocampal sclerosis dementia: a reappraisal. Acta Neuropathol. 2007;114:335–45. doi: 10.1007/s00401-007-0262-1. [DOI] [PubMed] [Google Scholar]
- 65.Whitwell JL, Jack CR, Jr, Parisi JE, et al. Does TDP-43 type confer a distinct pattern of atrophy in frontotemporal lobar degeneration? Neurology. 2010;75:2212–20. doi: 10.1212/WNL.0b013e31820203c2. [DOI] [PMC free article] [PubMed] [Google Scholar]
- 66.Di Paola M, Caltagirone C, Fadda L, Sabatini U, Serra L, Carlesimo GA. Hippocampal atrophy is the critical brain change in patients with hypoxic amnesia. Hippocampus. 2008;18:719–28. doi: 10.1002/hipo.20432. [DOI] [PubMed] [Google Scholar]
- 67.Josephs KA, Duffy JR, Fossett TR, et al. Fluorodeoxyglucose F18 positron emission tomography in progressive apraxia of speech and primary progressive aphasia variants. Arch Neurol. 2010;67:596–605. doi: 10.1001/archneurol.2010.78. [DOI] [PubMed] [Google Scholar]
- 68.Villain N, Desgranges B, Viader F, et al. Relationships between hippocampal atrophy, white matter disruption, and gray matter hypometabolism in Alzheimer’s disease. J Neurosci. 2008;28:6174–81. doi: 10.1523/JNEUROSCI.1392-08.2008. [DOI] [PMC free article] [PubMed] [Google Scholar]
- 69.Villain N, Fouquet M, Baron JC, et al. Sequential relationships between grey matter and white matter atrophy and brain metabolic abnormalities in early Alzheimer’s disease. Brain. 2010;133:3301–14. doi: 10.1093/brain/awq203. [DOI] [PMC free article] [PubMed] [Google Scholar]
- 70.Buckner RL, Sepulcre J, Talukdar T, et al. Cortical hubs revealed by intrinsic functional connectivity: mapping, assessment of stability, and relation to Alzheimer’s disease. J Neurosci. 2009;29:1860–73. doi: 10.1523/JNEUROSCI.5062-08.2009. [DOI] [PMC free article] [PubMed] [Google Scholar]
- 71.Sperling RA, Laviolette PS, O’Keefe K, et al. Amyloid deposition is associated with impaired default network function in older persons without dementia. Neuron. 2009;63:178–88. doi: 10.1016/j.neuron.2009.07.003. [DOI] [PMC free article] [PubMed] [Google Scholar]
- 72.Rosenzweig ES, Barnes CA. Impact of aging on hippocampal function: plasticity, network dynamics, and cognition. Prog Neurobiol. 2003;69:143–79. doi: 10.1016/s0301-0082(02)00126-0. [DOI] [PubMed] [Google Scholar]
- 73.Yeoman M, Scutt G, Faragher R. Insights into CNS ageing from animal models of senescence. Nat Rev Neurosci. 2012;13:435–45. doi: 10.1038/nrn3230. [DOI] [PubMed] [Google Scholar]
- 74.Tsitsopoulos PP, Marklund N. Amyloid-beta Peptides and Tau Protein as Biomarkers in Cerebrospinal and Interstitial Fluid Following Traumatic Brain Injury: A Review of Experimental and Clinical Studies. Front Neurol. 2013;4:79. doi: 10.3389/fneur.2013.00079. [DOI] [PMC free article] [PubMed] [Google Scholar]
- 75.Hardy J. The amyloid hypothesis for Alzheimer’s disease: a critical reappraisal. Journal of neurochemistry. 2009;110:1129–34. doi: 10.1111/j.1471-4159.2009.06181.x. [DOI] [PubMed] [Google Scholar]
- 76.Chetelat G. Alzheimer disease: Abeta-independent processes-rethinking preclinical AD. Nat Rev Neurol. 2013;9:123–4. doi: 10.1038/nrneurol.2013.21. [DOI] [PMC free article] [PubMed] [Google Scholar]
- 77.Herrup K. Reimagining Alzheimer’s disease--an age-based hypothesis. J Neurosci. 2010;30:16755–62. doi: 10.1523/JNEUROSCI.4521-10.2010. [DOI] [PMC free article] [PubMed] [Google Scholar]
- 78.Resnick SM. Preclinical Biomarkers in Alzheimer Disease: A Sum Greater Than the Parts. JAMA Neurol. 2014;71:1357–8. doi: 10.1001/jamaneurol.2014.2462. [DOI] [PMC free article] [PubMed] [Google Scholar]
- 79.Jack CR, Jr, Lowe VJ, Weigand SD, et al. Serial PIB and MRI in normal, mild cognitive impairment and Alzheimer’s disease: implications for sequence of pathological events in Alzheimer’s disease. Brain. 2009;132:1355–65. doi: 10.1093/brain/awp062. [DOI] [PMC free article] [PubMed] [Google Scholar]
- 80.Mormino EC, Kluth JT, Madison CM, et al. Episodic memory loss is related to hippocampal-mediated beta-amyloid deposition in elderly subjects. Brain. 2009;132:1310–23. doi: 10.1093/brain/awn320. [DOI] [PMC free article] [PubMed] [Google Scholar]
- 81.Perrin RJ, Fagan AM, Holtzman DM. Multimodal techniques for diagnosis and prognosis of Alzheimer’s disease. Nature. 2009;461:916–22. doi: 10.1038/nature08538. [DOI] [PMC free article] [PubMed] [Google Scholar]
- 82.Goate A, Chartier-Harlin MC, Mullan M, et al. Segregation of a missense mutation in the amyloid precursor protein gene with familial Alzheimer’s disease. Nature. 1991;349:704–6. doi: 10.1038/349704a0. [DOI] [PubMed] [Google Scholar]
- 83.Jonsson T, Atwal JK, Steinberg S, et al. A mutation in APP protects against Alzheimer’s disease and age-related cognitive decline. Nature. 2012;488:96–9. doi: 10.1038/nature11283. [DOI] [PubMed] [Google Scholar]
- 84.Hutton M, Lendon CL, Rizzu P, et al. Association of missense and 5′-splice-site mutations in tau with the inherited dementia FTDP-17. Nature. 1998;393:702–5. doi: 10.1038/31508. [DOI] [PubMed] [Google Scholar]
- 85.Jack CR, Jr, Knopman DS, Jagust WJ, et al. Tracking pathophysiological processes in Alzheimer’s disease: an updated hypothetical model of dynamic biomarkers. Lancet Neurol. 2013;12:207–16. doi: 10.1016/S1474-4422(12)70291-0. [DOI] [PMC free article] [PubMed] [Google Scholar]
- 86.Jack CR, Jr, Knopman DS, Jagust WJ, et al. Hypothetical model of dynamic biomarkers of the Alzheimer’s pathological cascade. Lancet Neurol. 2010;9:119–28. doi: 10.1016/S1474-4422(09)70299-6. [DOI] [PMC free article] [PubMed] [Google Scholar]
- 87.Jack CR, Jr, Vemuri P, Wiste HJ, et al. Evidence for Ordering of Alzheimer Disease Biomarkers. Arch Neurol. 2011;68:1526–35. doi: 10.1001/archneurol.2011.183. [DOI] [PMC free article] [PubMed] [Google Scholar]
- 88.Jack CR, Jr, Holtzman DM. Biomarker modeling of Alzheimer’s Disease. Neuron. 2013;80:1347–58. doi: 10.1016/j.neuron.2013.12.003. [DOI] [PMC free article] [PubMed] [Google Scholar]
- 89.Musiek ES, Holtzman DM. Origins of Alzheimer’s disease: reconciling cerebrospinal fluid biomarker and neuropathology data regarding the temporal sequence of amyloid-beta and tau involvement. Current opinion in neurology. 2012;25:715–20. doi: 10.1097/WCO.0b013e32835a30f4. [DOI] [PMC free article] [PubMed] [Google Scholar]
- 90.Delacourte A, Sergeant N, Champain D, et al. Nonoverlapping but synergetic tau and APP pathologies in sporadic Alzheimer’s disease. Neurology. 2002;59:398–407. doi: 10.1212/wnl.59.3.398. [DOI] [PubMed] [Google Scholar]
- 91.Jack CR, Jr, Wiste HJ, Knopman DS, et al. Rates of beta-amyloid accumulation are independent of hippocampal neurodegeneration. Neurology. 2014;82:1605–12. doi: 10.1212/WNL.0000000000000386. [DOI] [PMC free article] [PubMed] [Google Scholar]
- 92.Knopman DS, Jack CR, Jr, Wiste HJ, et al. Selective worsening of brain injury biomarker abnormalities in cognitively normal elderly persons with beta-amyloidosis. JAMA Neurol. 2013;70:1030–8. doi: 10.1001/jamaneurol.2013.182. [DOI] [PMC free article] [PubMed] [Google Scholar]
- 93.Maruyama M, Shimada H, Suhara T, et al. Imaging of tau pathology in a tauopathy mouse model and in Alzheimer patients compared to normal controls. Neuron. 2013;79:1094–108. doi: 10.1016/j.neuron.2013.07.037. [DOI] [PMC free article] [PubMed] [Google Scholar]
- 94.Chien DT, Bahri S, Szardenings AK, et al. Early Clinical PET Imaging Results with the Novel PHF-Tau Radioligand [F-18]-T807. J Alzheimers Dis. 2013;34:457–68. doi: 10.3233/JAD-122059. [DOI] [PubMed] [Google Scholar]
- 95.Villemagne VL, Furumoto S, Fodero-Tavoletti MT, et al. In vivo evaluation of a novel tau imaging tracer for Alzheimer’s disease. Eur J Nucl Med Mol Imaging. 2014;41:816–26. doi: 10.1007/s00259-013-2681-7. [DOI] [PubMed] [Google Scholar]
Associated Data
This section collects any data citations, data availability statements, or supplementary materials included in this article.