

Abstract
Purpose
To investigate the association between a validated, gene-expression-based, aggressiveness assay, Oncotype Dx RS, and morphological and texture-based image features extracted from magnetic resonance imaging (MRI).
Materials and Methods
This retrospective study received Internal Review Board approval and need for informed consent was waived. Between 2006–2012, we identified breast cancer patients with: 1) ER+, PR+, and HER2− invasive ductal carcinoma (IDC); 2) preoperative breast MRI; and 3) Oncotype Dx RS test results. Extracted features included morphological, histogram, and gray-scale correlation matrix (GLCM)-based texture features computed from tumors contoured on pre- and three postcontrast MR images. Linear regression analysis was performed to investigate the association between Oncotype Dx RS and different clinical, pathologic, and imaging features. P < 0.05 was considered statistically significant.
Results
Ninety-five patients with IDC were included with a median Oncotype Dx RS of 16 (range: 0–45). Using stepwise multiple linear regression modeling, two MR-derived image features, kurtosis in the first and third postcontrast images and histologic nuclear grade, were found to be significantly correlated with the Oncotype Dx RS with P = 0.0056, 0.0005, and 0.0105, respectively. The overall model resulted in statistically significant correlation with Oncotype Dx RS with an R-squared value of 0.23 (adjusted R-squared = 0.20; P = 0.0002) and a Spearman’s rank correlation coefficient of 0.49 (P < 0.0001).
Conclusion
A model for IDC using imaging and pathology information correlates with Oncotype Dx RS scores, suggesting that image-based features could also predict the likelihood of recurrence and magnitude of chemotherapy benefit.
Breast cancer subtypes are increasingly classified based on tumor genotype, which is often predictive of outcome, and molecular characterization is now often used to guide targeted therapy. Luminal A subtype is defined by immunohistochemistry surrogates, including positive estrogen receptor (ER+) and/or positive progesterone receptor (PR+), negative HER2 receptor (HER2−), and a low Ki67 level. This subtype of ER-positive breast cancer is the most common subtype and correlates with the highest probability of long-term disease-free and overall survival compared to luminal B, HER2-overexpressing, and basal-like subtypes.1 However, there is significant intertumoral and intratumoral variability in biological aggressiveness within the luminal A subtype, which has motivated a search for biomarkers and predictive models to more effectively personalize treatment regimes.2–4
The Oncotype Dx (Genomic Health, Redwood City, CA) breast cancer assay incorporates the mRNA expression of 21 genes, resulting in the so-called Recurrence Score (RS), that has been shown to be predictive and prognostic in early-stage ER-positive/HER2-negative invasive breast cancer.5–12 The American Society of Clinical Oncology (ASCO) recommended its clinical use based on data showing that RS correlates with the magnitude of chemotherapy benefit as well as the 10-year risk of distant recurrence, both increasing with higher RS scores.13 Oncotype Dx RS (hereafter, ODxRS) is used clinically to influence decision-making, sometimes preventing unnecessary chemotherapy.5
Correlating imaging phenotype with genomic information (often referred to as “radiogenomics”), in order to better understand genetic variability and the ability to predict prognosis or response to therapy, is a new field of research.14 The overlap between image-based breast cancer phenotype features and genomic characteristics is not currently well established. Breast magnetic resonance imaging (MRI) is the most sensitive imaging modality for tumor characterization and accurate size measurement. Clinical indication includes preoperative evaluation to define extent of disease in newly diagnosed breast cancer.15,16 Tumors are characterized clinically using the Breast Imaging-Reporting and Data System (BI-RADS) Lexicon. However, image features extracted through computer-based automated image analysis are quantitative and may include characteristics that are imperceptible to the eye. Such efforts to discover and use quantitative features are termed “radiomics.”
Types of radiomics features that are often extracted include texture-based features (ie, characteristics associated with “roughness” or “smoothness” and the like). Previous applications of texture analysis for breast cancer have predominantly been for differentiating between benign and malignant lesions as well as differentiating between ductal and lobular breast cancers.17–20 Sophisticated methods using gray-scale correlation matrix (GLCM) textures or variations of the same textures computed from Gabor edge images and temporal kinetics,21 as well as fractal-based textures,22 have been employed for classifying malignant from benign breast tumors. The purpose of this study was to investigate the association between ODxRS and image analysis-based features extracted from MRI scans.
Materials and Methods
Our Institutional Review Board approved this Health Insurance Portability and Accountability Act-compliant retrospective study; the need for informed patient consent was waived.
Patient Cohort
A retrospective search of our electronic hospital information system, for patients treated between 2006 and 2012, was performed to identify patients who met the following inclusion criteria: 1) pathologically proven ER-positive, PR-positive, and HER2-negative invasive ductal breast carcinoma; 2) preoperative bilateral breast MRI performed prior to definitive breast surgery where postbiopsy changes were not substantial; 3) ODxRS is documented; 4) no prior history of cancer; 5) no known breast cancer susceptibility gene (BRCA) mutation; 6) no use of hormonal therapy at time of diagnosis. MRI examinations were ordered for either: i) BRCA negative high-risk (>20% lifetime risk) breast cancer screening or ii) preoperative evaluation to define the extent of disease in newly diagnosed breast cancer. Ninety-five women met the inclusion criteria, with each providing imaging data for a single tumor.
MR Image Acquisition
All images were acquired with a 1.5T (n = 47; 49.50%) or 3.0T (n = 48; 50.50%) MRI system (Signa or Signa HDX; GE Medical Systems, Waukesha, WI). In all patients, a dedicated 8- or 16-channel surface breast coil was used. Sagittal T1-weighted fat-suppressed 2D multislice acquisitions were acquired before and continuously three times after the intravenous administration of 0.1 mmol gadopentetate dimeglumine per kilogram body weight (Magnevist; Berlex Laboratories/Bayer Health Care Pharmaceuticals, Montville, NJ) at a rate of 2 ml/sec with an automatic injector (Medrad, Pittsburgh, PA) and a 20-second scan delay using the following parameters: repetition time (msec)/echo time (msec), 7.4/4.2; flip angle, 10°; bandwidth, 32 kHz; field of view, 18–22 cm; acquisition matrix, 256 × 192; NEX, 1; slice thickness, 3 mm; gap, 0 mm; temporal resolution, ~90 seconds.
Computer-Based Image Analysis
Figure 1 shows an overview of our approach. As shown, the tumors were identified and contoured by the radiologist on a single central slice from the first postcontrast fat-suppressed T1-weighted MR image sequences. Next, image features were extracted from the contoured central tumor single slice on the pre- and three postcontrast sagittal fat-suppressed T1-weighted MR sequences. Once all image features were computed for each patient, the results were combined with clinical, histologic, and pathologic features and analyzed using linear regression to extract the relevant features.
FIGURE 1.
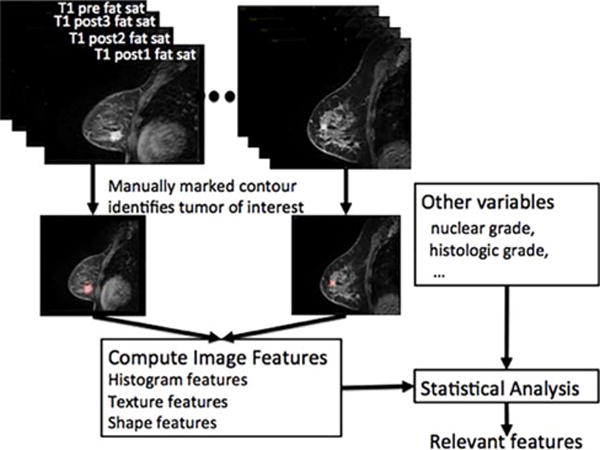
Overview of our approach for extracting features correlated to ODxRS. As shown, each tumor was contoured on a single central slice of the pre- and three postcontrast fat-saturated T1 images; the contour was used to compute various image features. Image features were then combined with the additional clinical and pathological variables in the statistical analysis to extract the most relevant features and to build a predictive model.
Thus, information is extracted from a single slice of the tumor as contoured on the fat-suppressed T1-weighted pre- and three postcontrast images.
Two radiologists (E.J.S. with 3 years and E.A.M. with 19 years experience reading breast MRI) interpreted the breast MRI data in consensus blinded to all protected health information including ODxRS. One radiologist (E.J.S.) contoured the tumor boundary on a central slice that was used as the region of interest (ROI) for extracting the various image-based features. We integrated routines to derive image features including morphological, histogram-based first-order, and GLCM-based second-order texture features into our in-house, open-source software system (Computational Environment for Radiotherapy Research, CERR).23
MORPHOLOGICAL FEATURES
Morphological features capture tumor shape and consist of: 1, eccentricity; 2, Euler number; 3, solidity; and 4, extent. Eccentricity describes the elongatedness of a shape as a measure of its deviation from a circle. A perfectly round tumor will have an eccentricity of 0 while a tumor that is long and thin will have an eccentricity of 1.0. The Euler number describes a structure by the number of holes found inside the structure. For example, the Euler number captures the presence of necrotic regions. Solidity measures the proportion of pixels corresponding to a given structure (ie, tumor) that are also enclosed by the largest possible convex hull for that structure; the convex hull is the best-fitting polygon that can enclose all the pixels corresponding to the given structure (ie, without “dimples”). Solidity measures the degree of concavities in the perimeter of the structure and complements the Euler number. Extent is a measure that is related to solidity but employs a bounding box instead of a convex hull to derive its measurement.
HISTOGRAM-BASED FIRST-ORDER TEXTURE FEATURES
In addition to the shape features, we computed the image-based characteristics of the tumors using intensity-volume histograms. Histograms were computed using the voxel intensities inside the ROI from which statistical measures of the shape of histogram were derived and included: 1, kurtosis; 2, skewness; 3, variance; 4, standard deviation; 5, minimum; and 6, maximum. In the literature, these are also referred to as the first-order textures.
GLCM FEATURES
GLCM-based textures are also frequently referred to as Haralick texture features.24 These are so-called second-order texture features that are computed from a 2D histogram that summarizes the relative intensities of the pixels for one or more spatial offsets (eg, “over one voxel and up one voxel”) measured at specific intensity levels. These features capture the relative variation in the intensities thereby, obtaining a more accurate model of the texture in a given region. The features computed from the GLCM matrix include: 1, energy (or coherence); 2, entropy; 3, contrast; and 4, homogeneity. Energy, computed as the average of the gray level co-occurrences captures the extent of similarity of voxels in a given region. Entropy, on the other hand, captures the amount of variation in the co-occurrence of the different voxels. Correlation captures how the pairs of voxels are correlated to other voxel pairs as positive, zero, or negative correlation. In contrast, inertia or contrast computes the amount of dissimilarity. The Haralick texture features were computed directly from the MR images. The GLCM matrix was computed by discretizing the images into 16 intensity bins. For more information about these image features, see our previous publication focusing on positron emission tomography (PET) images.24
In summary, our MRI analysis included four morphologic features (eccentricity, Euler number, solidity, and extent), which do not change on different sequences. Our MRI analysis also included six histogram (kurtosis, skewness, variance, standard deviation, min, and max) and four GLCM-based (energy, entropy, contrast, and homogeneity) features that were computed for all four MR images, giving a total of 40 different image features. We therefore had a total of 44 image features. Six clinical features were also analyzed and included: 1, age; 2, menopausal status; 3, histologic grade; 4, nuclear grade; 5, pathologic tumor size and 6, axillary lymph node status.
Reference Standard
Clinical data collected included age at diagnosis, menopausal status, and family history of breast cancer, which was defined as breast cancer in a first- or second-degree relative as well as BRCA status. Pathologic data collected included tumor size, histologic grade, nuclear grade, and presence of multifocal/multicentric disease. Surgical data collected included breast operation, axillary procedure, sentinel lymph node pathology results, and re-excision.
Oncotype Dx RS
Tumor specimens were sent to Genomic Health, after definitive surgery and the breast cancer ODxRS score was generated (RS range: 0–100).
Statistical Modeling
Descriptive statistics were used to summarize clinical, imaging, and pathologic parameters. Frequencies and corresponding percentages were used for categorical variables and means, ranges and standard deviations were used for continuous variables. Age was calculated at the time of diagnosis. Clinical and pathological features that were used in the linear regression analysis included: age, menopausal status, histologic grade, nuclear grade, pathologic tumor size and axillary lymph node status. Linear regression analysis was performed to fit ODxRS against predictors, including all clinical, pathological, and imaging features. First, stepwise multiple linear regression analysis was used. In this approach, forward and backward feature selection was performed, repeatedly adding or removing features one at a time until some termination criteria were met with P-value thresholds of 0.05 and 0.1, respectively, for entering a feature into the model and for removing a feature from the model. For comparison, an alternative approach was employed using all features with P < 0.05 on univariate linear regression analysis. Spearman’s rank correlation (Rs) test was performed to investigate the association between ODxRS and the resulting models. All analyses were performed using custom routines written in MatLab (v. 7.14., MathWorks, Natick, MA).
Results
Ninety-five patients with luminal A-like (ER+, PR+, HER2−) breast cancer fit the selection criteria and were included in the study sample. The mean age was 50.3 years (range: 27.4–76.1 years); the median ODxRS score was 16 (range: 0–45) (Table 1). In univariate linear regression analysis, the only significant associations with ODxRS were seen for energy (coherence) in precontrast MRI, kurtosis in the third postcontrast, histologic grade, and the nuclear grade, with P-values of 0.0498, 0.0228, 0.0365, and 0.0064, respectively. Figure 2 depicts the ODxRS association between energy and entropy. These four features were further used in multiple linear regression analysis, resulting in a model with R-squared = 0.195 (adjusted R-squared = 0.152; P = 0.0022), and Rs = 0.437 (P < 0.0001). In this study, histologic grade was coded as 1 (well differentiated), 2 (moderately differentiated), and 3 (poorly differentiated). Age and menopausal status were not statistically significant, with P = 0.353 and 0.156, respectively. Using stepwise multiple linear regression analysis, a slightly better performance was achieved with R-squared = 0.228 (adjusted R-squared = 0.198; P = 0.0002) and Rs = 0.485 (P < 0.0001), depicted in Fig. 3, using three statistically significant independent features: nuclear grade and two kurtosis features in the first and third postcontrast with type 3 P-values of 0.0105, 0.0056, and 0.0005, respectively, based on the F-test. Note that kurtosis in the first postcontrast was not statistically significant in univariate analysis, but became significant in stepwise multiple linear regression analysis. Table 2 depicts univariate and multivariate P-values. A best-fit linear regression model is:
TABLE 1.
Patient, Luminal A-like (ER+, PR+, and HER2-) Invasive Ductal Carcinoma Tumor and MRI Characteristics
| Characteristics | Total (n = 95) n (%) |
|---|---|
| Mean agea | 50.9 (27.4–76.1) |
| Tumor diameter (cm)b | 1.39 (SD 0.59) |
| Oncotypea | 16 (0–45) |
| Menopausal status | |
| Pre | 56 (58.9%) |
| Post | 39 (41.1%) |
| Lymph node status | |
| Negative | 87 (91.6%) |
| Positive | 8 (8.4%) |
| MRI | |
| 1.5-T | 47 (49.50%) |
| 3.0-T | 48 (50.50%) |
Numbers in parentheses represent percent for categorical variables unless otherwise indicated.
Numbers in parentheses represent range.
Numbers in parentheses represent the standard deviation (SD).
FIGURE 2.
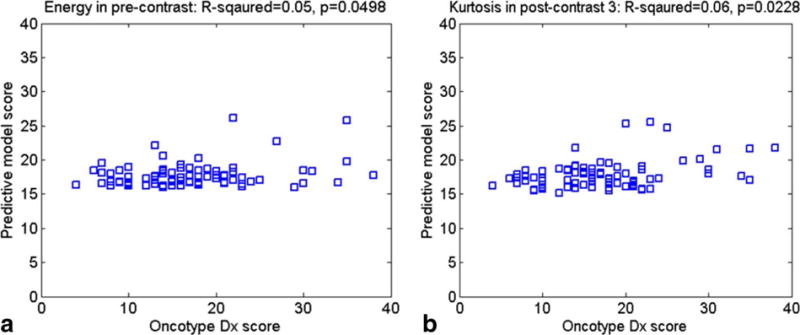
Graph shows the ODxRS association between (a) Energy (precontrast) and (b) Kurtosis (postcontrast).
FIGURE 3.
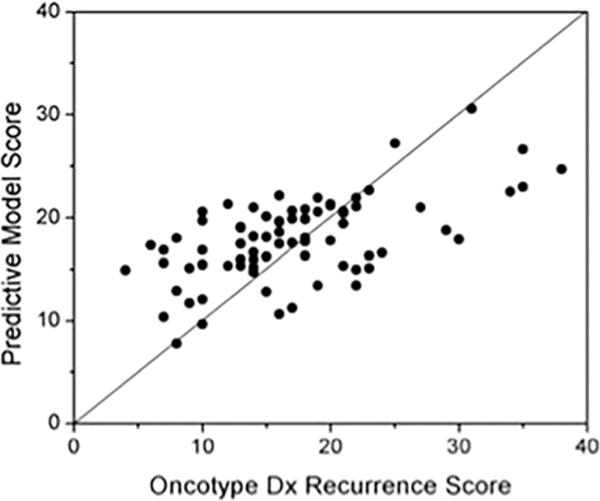
Graph shows correlation between our best-fit linear regression model and Oncotype Dx Recurrence Score.
TABLE 2.
P-values for Univariate and Multivariate 44 Feature Analysis
| Sequence | Feature | Univariate analysis | Multivariate (stepwise) analysis |
|---|---|---|---|
| P-value | P-value | ||
| Pre-contrast | Energy | 0.0498 | 0.2108 |
| Contrast | 0.8754 | 0.5731 | |
| Entropy | 0.1988 | 0.4688 | |
| Homogeneity | 0.5765 | 0.6840 | |
| Min | 0.0670 | 0.4013 | |
| Max | 0.7127 | 0.6378 | |
| Standard deviation | 0.7413 | 0.5647 | |
| Variance | 0.5205 | 0.6396 | |
| Skewness | 0.9775 | 0.4173 | |
| Kurtosis | 0.3985 | 0.6078 | |
| Postcontrast 1 | Energy | 0.9935 | 0.9174 |
| Contrast | 0.4788 | 0.3750 | |
| Entropy | 0.8149 | 0.8424 | |
| Homogeneity | 0.5827 | 0.6004 | |
| Min | 0.1754 | 0.9958 | |
| Max | 0.9815 | 0.8323 | |
| Standard deviation | 0.6339 | 0.2933 | |
| Variance | 0.7188 | 0.9262 | |
| Skewness | 0.9934 | 0.7341 | |
| Kurtosis | 0.5510 | 0.0056 | |
| Postcontrast 2 | Energy | 0.3218 | 0.7608 |
| Contrast | 0.6605 | 0.4359 | |
| Entropy | 0.6018 | 0.9950 | |
| Homogeneity | 0.8398 | 0.7665 | |
| Min | 0.1248 | 0.7339 | |
| Max | 0.9571 | 0.8278 | |
| Standard deviation | 0.7614 | 0.3637 | |
| Variance | 0.5812 | 0.8813 | |
| Skewness | 0.9824 | 0.9391 | |
| Kurtosis | 0.1413 | 0.8997 | |
| Postcontrast 3 | Energy | 0.2089 | 0.7826 |
| Contrast | 0.6860 | 0.4106 | |
| Entropy | 0.4385 | 0.9264 | |
| Homogeneity | 0.9273 | 0.7433 | |
| Min | 0.0727 | 0.7001 | |
| Max | 0.9276 | 0.8404 | |
| Standard deviation | 0.8256 | 0.4211 | |
| Variance | 0.5174 | 0.7672 | |
| Skewness | 0.9873 | 0.7157 | |
| Kurtosis | 0.0228 | 0.0005 | |
| Morphological features | Eccentricity | 0.9191 | 0.5109 |
| Euler Number | 1.0000 | 1.0000 | |
| Solidity | 0.3065 | 0.7391 | |
| Extent | 0.9535 | 0.9030 | |
| Clinical features | Volume | 0.8681 | 0.7837 |
| Menopausal status | 0.1555 | 0.2097 | |
| Histologic grade | 0.0365 | 0.5821 | |
| Nuclear grade | 0.0064 | 0.0105 | |
| Axillary nodes | 0.7677 | 0.4520 | |
| Age | 0.3531 | 0.2757 |
This equation implies that Fig. 3 shows a fair linear relationship between ODxRS and scores predicted by the linear regression model using three predictors. Interestingly, the change in kurtosis seems to be most predictive, with increased kurtosis implying a higher risk. High kurtosis implies a more “peaked” intensity distribution compared to a Gaussian distribution. Roughly speaking, a breast cancer with many voxels that tend to take up contrast at a similar intensity level has a higher ODxRS.
Discussion
In this study, we investigated a broad range of quantitative “radiomic” imaging features of early stage luminal A-like (ER+, PR+, HER2−) IDC and assessed if there was an association with ODxRS. Our results demonstrated that there were two computer-extracted histogram-based kurtosis image features on the first and third postcontrast images that were significantly associated with ODxRS. Roughly, it is the difference in kurtosis following contrast that drives the prediction. An increased kurtosis was found to be a statistically significant factor correlating with ODxRS. In general terms, this means that tumors with many voxels of similar uptake (contributing to a peak in the intensity profile) are likely to be more biologically aggressive. This, in turn, implicates vascularity as a key component in distinguishing biologically aggressive and nonaggressive tumors. To our knowledge, this is one of the first studies to report a quantitative imaging biomarker that is potentially a surrogate for a prognostic and predictive genomic-based test. As noted, ODxRS is supported by level II evidence and ASCO recommends its use in early ER+, HER2− breast cancers.
Related studies include one by Ashraf et al,25 who reported intrinsic imaging phenotypes in 56 breast cancer tumors correlated with their ODxRS. Their results demonstrated a moderate correlation between DCE MRI features and recurrence score; with four dominant imaging phenotypes detected, however, they did not look at kurtosis. Their study included both ductal and lobular pathology as well as variable progesterone status without mention of the tumor HER2 status. HER2-positive tumors are not recommended to undergo this genetic test by ASCO but they often do and are associated with a high Oncotype Dx RS. Our results are in line with their study, which demonstrated more rapid contrast enhancement with increased recurrence score. Our results are also in line with studies by Pickels et al26 and Yi et al,27 wherein increased perfusion for this subtype was associated with decreased disease-free survival. Mazurowski et al 28 compared different breast cancer subtypes and found that luminal B were more likely to have a higher ratio of lesion enhancement to background parenchymal enhancement. The steady-state dynamic contrast-enhanced time-signal intensity curves that are used clinically to assist in differentiate benign and malignant lesions is a related but different parameter than kurtosis. Future investigations are needed to fully explore the relationship between kurtosis and traditional time-signal intensity kinetic parameters, such as the rate of washout.29 Clearly, kurtosis measured too early after contrast injection is not an optimal predictor. Again, kinetic factors in potentially improving the predictive model deserve further consideration.
Computer extracted histogram-based image features have been shown to correlate with phenotypic heterogeneity.15,16 We have also demonstrated that there are characteristics that are not readily appreciated visually but can be ascertained with other methods of image analysis, and that these characteristics correlate with tumor behavior. Breast cancer image feature extraction by computational analysis could potentially quantify important patterns hidden in images and therefore better characterize tumor, by providing reproducible but visually imperceptible data. For example, Ahmed et al30 evaluated the ability of MRI textural analysis in predicting breast cancer response to chemotherapy and concluded that significant texture parameters and groupings were observed and differed between responders and nonresponders. Soares et al22 have used fractal-based methods to extract data to characterize breast cancer spatial complexity. Finally, multiparametric MRI, which is helpful in distinguishing benign and malignant breast pathology, may also prove helpful in generating phenotypic biomarkers.31
In this work, we focused on three different types of image-based features including histogram-based first-order textures, GLCM-based second-order textures, and morphology-based features. Other works have studied the utility of a variety of texture features including edge-based features, fractals, and variations of GLCM features.21,22 In this work, we restricted the analysis to the three types of features, as these capture both the internal and external (shape)-based intensity characteristics of the tumors. The lack of positive predictive power for morphological/edge-based features may be due to our limited quantification of the tumor surface, given our use of a single central tumor slice. We did not pursue fractal-based features because these are closely related to the GLCM features, where multiple regions of different radii are used to compute the features. The main difference is that in GLCM, different offsets between pixels are used for the computation.
Our results of ODxRS being significantly associated with high nuclear grade are consistent with other research. Flanagan et al32 reported in their univariate analysis that ODxRS significantly correlated (P < 0.01) with tubule formation, nuclear grade, mitotic count, ER score, PR score, and HER2 status. Allison et al33 analyzed 174 breast cancers and Mattes et al34 analyzed another 72 breast cancers and concluded that routine pathologic parameters, which included tumor grade and PR receptor status, can predict ODxRS in a subset of ER-positive patients.
The study had several limitations. The major limitation was that we only evaluated tumor features from a single representative slice and not full 3D volumetric analysis. Single slice analysis may miss important features because of intratumor heterogeneity. This was a retrospective analysis of patients who presented over 6 years. There were more patients with low-risk ODxRS and no scores above 45. Results of a clinically validated genetic test were correlated with imaging features instead of performing full gene sequencing. The association between the MRI features and disease-free survival could not be evaluated due to limited follow-up information. To date, no patient has recurred. Although our standard acquisition parameters were the same regardless of magnet strength, subtle variation in protocols in the 1.5T and 3.0T scanners may have affected imaging results. Finally, it is uncertain if this MRI-signal based equation is applicable to variations in machines and imaging protocols without further testing.
In conclusion, it was possible to leverage quantitative MRI phenotypic image-based biomarkers of early-stage luminal A-like breast cancers (ER+/PR+/HER2−) that correlated with their ODxRS. IDC computer-derived imaging features correlated with ODxRS, suggesting that these are image-based biomarkers that reflect the likelihood of recurrence and magnitude of chemotherapy benefit. Further investigation on larger datasets is necessary to validate this observation relative to ODxRS and other factors such as BI-RADS terms, predicting disease-free and overall survival.
The radiogenomic strategy of correlating imaging features with genetic information is one that we believe has a lot of potential for all breast cancer subtypes. Future research will be needed on larger datasets to validate this observation and to see if multiparametric imaging can increase specificity of image-based phenotypic biomarkers of genetic variability.
FIGURE 4.
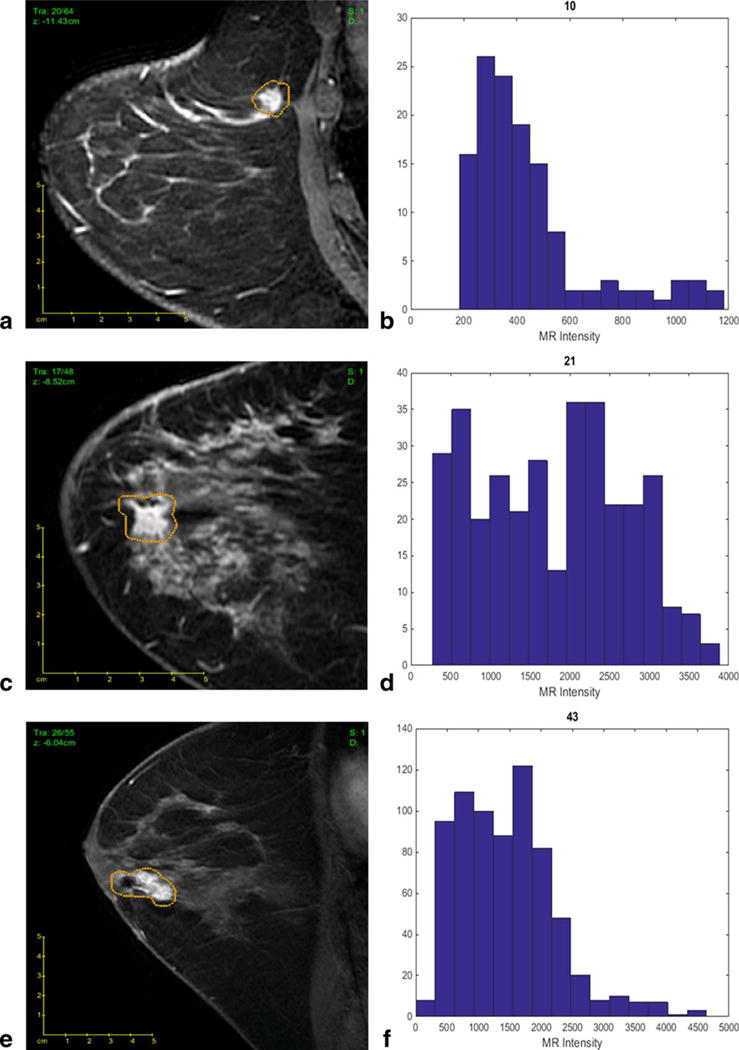
Our best-fit linear regression model allows imaging features to differentiate tumors with different Oncotype Dx Recurrence Score (ODxRS). (a) Sagittal T1-weighted fat-suppressed post-contrast MRI of a invasive ductal nuclear grade 1 carcinoma with an ODxRS of 10 and (b) corresponding kurtosis histogram, which demonstrates the frequency of MR intensity. (c) Sagittal T1-weighted fat-suppressed postcontrast MRI of an invasive ductal nuclear grade 2 carcinoma with an ODxRS of 21 and (d) corresponding kurtosis histogram. (e) Sagittal T1-weighted fat-suppressed postcontrast MRI of an invasive ductal nuclear grade 3 carcinoma with an ODxRS of 43 and (f) corresponding kurtosis histogram.
References
- 1.Perou CM, Sorlie T, Eisen MB, et al. Molecular portraits of human breast tumours. Nature. 2000;406:747–752. doi: 10.1038/35021093. [DOI] [PubMed] [Google Scholar]
- 2.Geyer FC, Rodrigues DN, Weigelt B, Reis-Filho JS. Molecular classification of estrogen receptor-positive/luminal breast cancers. Adv Anat Pathol. 2012;19:39–53. doi: 10.1097/PAP.0b013e31823fafa0. [DOI] [PubMed] [Google Scholar]
- 3.Cancer Genome Atlas N. Comprehensive molecular portraits of human breast tumours. Nature. 2012;490:61–70. doi: 10.1038/nature11412. [DOI] [PMC free article] [PubMed] [Google Scholar]
- 4.Sorlie T, Perou CM, Tibshirani R, et al. Gene expression patterns of breast carcinomas distinguish tumor subclasses with clinical implications. Proc Natl Acad Sci U S A. 2001;98:10869–10874. doi: 10.1073/pnas.191367098. [DOI] [PMC free article] [PubMed] [Google Scholar]
- 5.Paik S, Shak S, Tang G, et al. A multigene assay to predict recurrence of tamoxifen-treated, node-negative breast cancer. N Engl J Med. 2004;351:2817–2826. doi: 10.1056/NEJMoa041588. [DOI] [PubMed] [Google Scholar]
- 6.Paik S, Tang G, Shak S, et al. Gene expression and benefit of chemotherapy in women with node-negative, estrogen receptor-positive breast cancer. J Clin Oncol. 2006;24:3726–3734. doi: 10.1200/JCO.2005.04.7985. [DOI] [PubMed] [Google Scholar]
- 7.Albain KS, Barlow WE, Shak S, et al. Prognostic and predictive value of the 21-gene recurrence score assay in postmenopausal women with node-positive, oestrogen-receptor-positive breast cancer on chemotherapy: a retrospective analysis of a randomised trial. Lancet Oncol. 2010;11:55–65. doi: 10.1016/S1470-2045(09)70314-6. [DOI] [PMC free article] [PubMed] [Google Scholar]
- 8.Mamounas EP, Tang G, Fisher B, et al. Association between the 21-gene recurrence score assay and risk of locoregional recurrence in node-negative, estrogen receptor-positive breast cancer: results from NSABP B-14 and NSABP B-20. J Clin Oncol. 2010;28:1677–1683. doi: 10.1200/JCO.2009.23.7610. [DOI] [PMC free article] [PubMed] [Google Scholar]
- 9.Tang G, Cuzick J, Costantino JP, et al. Risk of recurrence and chemotherapy benefit for patients with node-negative, estrogen receptor-positive breast cancer: recurrence score alone and integrated with pathologic and clinical factors. J Clin Oncol. 2011;29:4365–4372. doi: 10.1200/JCO.2011.35.3714. [DOI] [PMC free article] [PubMed] [Google Scholar]
- 10.Tang G, Shak S, Paik S, et al. Comparison of the prognostic and predictive utilities of the 21-gene Recurrence Score assay and Adjuvant! for women with node-negative, ER-positive breast cancer: results from NSABP B-14 and NSABP B-20. Breast Cancer Res Treat. 2011;127:133–142. doi: 10.1007/s10549-010-1331-z. [DOI] [PMC free article] [PubMed] [Google Scholar]
- 11.Dowsett M, Cuzick J, Wale C, et al. Prediction of risk of distant recurrence using the 21-gene recurrence score in node-negative and node-positive postmenopausal patients with breast cancer treated with anastrozole or tamoxifen: a TransATAC study. J Clin Oncol. 2010;28:1829–1834. doi: 10.1200/JCO.2009.24.4798. [DOI] [PubMed] [Google Scholar]
- 12.Habel LA, Shak S, Jacobs MK, et al. A population-based study of tumor gene expression and risk of breast cancer death among lymph node-negative patients. Breast Cancer Res. 2006;8:R25. doi: 10.1186/bcr1412. [DOI] [PMC free article] [PubMed] [Google Scholar]
- 13.Harris L, Fritsche H, Mennel R, et al. American Society of Clinical Oncology 2007 update of recommendations for the use of tumor markers in breast cancer. J Clin Oncol. 2007;25:5287–5312. doi: 10.1200/JCO.2007.14.2364. [DOI] [PubMed] [Google Scholar]
- 14.Boisserie-Lacroix M, Hurtevent-Labrot G, Ferron S, Lippa N, Bonnefoi H, Mac Grogan G. Correlation between imaging and molecular classification of breast cancers. Diagn Intervent Imaging. 2013;94:1069–1080. doi: 10.1016/j.diii.2013.04.010. [DOI] [PubMed] [Google Scholar]
- 15.Morris EA. Diagnostic breast MR imaging: current status and future directions. Magn Reson Imaging Clin N Am. 2010;18:57–74. doi: 10.1016/j.mric.2009.09.005. [DOI] [PubMed] [Google Scholar]
- 16.Morrow M, Waters J, Morris E. MRI for breast cancer screening, diagnosis, and treatment. Lancet. 2011;378:1804–1811. doi: 10.1016/S0140-6736(11)61350-0. [DOI] [PubMed] [Google Scholar]
- 17.Chen W, Giger ML, Li H, Bick U, Newstead GM. Volumetric texture analysis of breast lesions on contrast-enhanced magnetic resonance images. Magn Reson Med. 2007;58:562–571. doi: 10.1002/mrm.21347. [DOI] [PubMed] [Google Scholar]
- 18.Huang YH, Chang YC, Huang CS, Wu TJ, Chen JH, Chang RF. Computer-aided diagnosis of mass-like lesion in breast MRI: differential analysis of the 3-D morphology between benign and malignant tumors. Comput Methods Progr Biomed. 2013;112:508–517. doi: 10.1016/j.cmpb.2013.08.016. [DOI] [PubMed] [Google Scholar]
- 19.Holli K, Laaperi AL, Harrison L, et al. Characterization of breast cancer types by texture analysis of magnetic resonance images. Acad Radiol. 2010;17:135–141. doi: 10.1016/j.acra.2009.08.012. [DOI] [PubMed] [Google Scholar]
- 20.McLaren CE, Chen WP, Nie K, Su MY. Prediction of malignant breast lesions from MRI features: a comparison of artificial neural network and logistic regression techniques. Acad Radiol. 2009;16:842–851. doi: 10.1016/j.acra.2009.01.029. [DOI] [PMC free article] [PubMed] [Google Scholar]
- 21.Zheng Y, Englander S, Baloch S, et al. STEP: spatiotemporal enhancement pattern for MR-based breast tumor diagnosis. Med Phys. 2009;36:3192–3204. doi: 10.1118/1.3151811. [DOI] [PMC free article] [PubMed] [Google Scholar]
- 22.Soares F, Janela F, Pereira M, Seabra J, Freire MM. 3D lacunarity in multifractal analysis of breast tumor lesions in dynamic contrast-enhanced magnetic resonance imaging. IEEE Trans Image Process. 2013;22:4422–4435. doi: 10.1109/TIP.2013.2273669. [DOI] [PubMed] [Google Scholar]
- 23.Deasy JO, Blanco AI, Clark VH. CERR: a computational environment for radiotherapy research. Med Phys. 2003;30:979–985. doi: 10.1118/1.1568978. [DOI] [PubMed] [Google Scholar]
- 24.El Naqa I, Grigsby P, Apte A, et al. Exploring feature-based approaches in PET images for predicting cancer treatment outcomes. Pattern Recogn. 2009;42:1162–1171. doi: 10.1016/j.patcog.2008.08.011. [DOI] [PMC free article] [PubMed] [Google Scholar]
- 25.Ashraf AB, Daye D, Gavenonis S, et al. Identification of intrinsic imaging phenotypes for breast cancer tumors: preliminary associations with gene expression profiles. Radiology. 2014;272:374–384. doi: 10.1148/radiol.14131375. [DOI] [PMC free article] [PubMed] [Google Scholar]
- 26.Pickles MD, Manton DJ, Lowry M, Turnbull LW. Prognostic value of pre-treatment DCE-MRI parameters in predicting disease free and overall survival for breast cancer patients undergoing neoadjuvant chemotherapy. Eur J Radiol. 2009;71:498–505. doi: 10.1016/j.ejrad.2008.05.007. [DOI] [PubMed] [Google Scholar]
- 27.Yi A, Cho N, Im SA, et al. Survival outcomes of breast cancer patients who receive neoadjuvant chemotherapy: association with dynamic contrast-enhanced MR imaging with computer-aided evaluation. Radiology. 2013;268:662–672. doi: 10.1148/radiol.13121801. [DOI] [PubMed] [Google Scholar]
- 28.Mazurowski MA, Zhang J, Grimm LJ, Yoon SC, Silber JI. Radiogenomic analysis of breast cancer: luminal B molecular subtype is associated with enhancement dynamics at MR imaging. Radiology. 2014;132641 doi: 10.1148/radiol.14132641. [DOI] [PubMed] [Google Scholar]
- 29.Kuhl CK, Mielcareck P, Klaschik S, et al. Dynamic breast MR imaging: are signal intensity time course data useful for differential diagnosis of enhancing lesions? Radiology. 1999;211:101–110. doi: 10.1148/radiology.211.1.r99ap38101. [DOI] [PubMed] [Google Scholar]
- 30.Ahmed A, Gibbs P, Pickles M, Turnbull L. Texture analysis in assessment and prediction of chemotherapy response in breast cancer. J Magn Reson Imaging. 2013;38:89–101. doi: 10.1002/jmri.23971. [DOI] [PubMed] [Google Scholar]
- 31.Jacobs MA. Multiparametric magnetic resonance imaging of breast cancer. J Am College Radiol. 2009;6:523–526. doi: 10.1016/j.jacr.2009.04.006. [DOI] [PubMed] [Google Scholar]
- 32.Flanagan MB, Dabbs DJ, Brufsky AM, Beriwal S, Bhargava R. Histopathologic variables predict Oncotype DX recurrence score. Modern Pathol. 2008;21:1255–1261. doi: 10.1038/modpathol.2008.54. [DOI] [PubMed] [Google Scholar]
- 33.Allison KH, Kandalaft PL, Sitlani CM, Dintzis SM, Gown AM. Routine pathologic parameters can predict Oncotype DX recurrence scores in subsets of ER positive patients: who does not always need testing? Breast Cancer Res Treat. 2012;131:413–424. doi: 10.1007/s10549-011-1416-3. [DOI] [PubMed] [Google Scholar]
- 34.Mattes MD, Mann JM, Ashamalla H, Tejwani A. Routine histopathologic characteristics can predict oncotype DX(TM) recurrence score in subsets of breast cancer patients. Cancer Investig. 2013;31:604–606. doi: 10.3109/07357907.2013.849725. [DOI] [PubMed] [Google Scholar]