

Abstract
The purpose of this article is to gather results of studies on the relationship between median frequency (MF) and mean power frequency (MPF) and the level of muscle contraction, and to use those results to discuss the differences in the trends according to factors related to measurement technique and subject. Twenty-one studies with 63 cases for upper limb muscles and nine studies with 31 cases for lower limb muscles were analysed. Most results showed an increase in parameters with an increased level of muscle contraction, only some studies showed a decrease. The influence on parameters of the level of muscle contraction and factors such as subjects, type of contraction, muscle length and electrodes was analysed for each muscle. It was concluded that when analysing the influence of different factors on MF and MPF, because those factors interact they should be considered together, not separately.
Keywords: median frequency, mean power frequency, power spectrum, muscle contraction, muscle length, electrodes, age and gender groups
1. Introduction
Electromyography (EMG) is broadly used as a non-invasive method for assessing workload and fatigue in the muscular system in various work-related situations.[1,2] Numerous EMG parameters can describe muscle activity; the most commonly used parameters describe the amplitude of the EMG signal (i.e., the time domain) and the power spectral density (i.e., the frequency domain). Past studies analysed different parameters characterizing the power spectrum; mostly mean power frequency (MPF) and median frequency (MF).[3]
Parameters of the EMG signal depend on factors related directly to the test or to the tested person or to the technique of measuring the EMG signal. According to Kellis and Katis[4] and Cechetto et al. [5] the power spectrum, which is characterized by parameters of an EMG signal, is affected by body posture in joints related to corresponding muscles. Factors related to the measurement technique, such as electrode type [6] and inter-electrode distance,[7,8] also influence EMG characteristics. The importance of subject-related factors, such as gender and age, has also been proved.[9,10]
Muscle force involved in operations significantly affects characteristics of the EMG signal. The impact of this factor on EMG parameters is particularly important. When exerted force is considered in relation to the EMG signal detected from the muscle, two factors should be considered: the magnitude of force and the way it is exerted (step or ramp contractions).[11]
The amplitude of the EMG signal depends on the level of muscle force with an increasing trend.[12] Studies on the relationship between force and parameters of surface EMG describing the power spectrum produce conflicting results. Most survey results indicate an increasing trend of parameters with force. There is an increase over the entire range [13] or only up to some level of muscle force.[14,15] However, sometimes there are no changes [16] or decreasing tendencies.[17,18] The impact of subject-related factors, the measurement technique of the EMG signal and the angle in the corresponding joint might explain these differences.
There have been many attempts at determining the influence of various factors on parameters characterizing the amplitude and the power spectrum on the EMG signal. However, many problems related to the influence of the main factors have remained unsolved.
No study has clearly shown how the different factors modify the trends in the values of parameters characterizing the power spectrum with increased external force and increased level of muscle contraction. MF and MPF should increase following an increase in the level of muscle contraction. The question then is why sometimes the relationship is reversed and why sometimes there are no differences resulting from differences in the level of muscle contraction.
The purpose of this article is to gather the results of studies on the relationship between MF and MPF and the level of muscle contraction, and to use those results to discuss the differences in the trends according to factors associated with the measurement technique and subject-related factors. Upper and lower limb muscles are considered.
2. Methods
2.1. Identification
PubMed (Medline), Web of Knowledge (Web of Science) and Cochrane Library (Cochrane Controlled Trials Register) were searched for articles published before March 2014. The following search terms were used: EMG, force, frequency, muscle contraction. The search, which was limited to papers on human studies published in English, produced 823 papers. Abstracts were then analysed to identify papers on healthy adults (≥18 years old), surface electrodes, voluntarily contractions with isometric force and studies in which subjects exerted force on various levels of maximal voluntary contraction (MVC), when EMG activity was registered. In the next step, excluded were studies which did not focus on upper or lower limb muscles, whereas included were studies which expressed quantitatively values of MF and/or MPF in tables or figures in which it was possible to, at least approximately, read those values. When authors cited other papers, they were also analysed. Eventually, 21 studies on upper limb muscles and nine studies on lower limb muscles were selected for analysis.
2.2. Analysis
The analysis focused on comparing values of MF and MPF from tables if they were presented numerically or from figures as approximate values. In each study, individual cases were distinguished; values of MF and MPF in those cases were compared. Results obtained in one study were considered as cases; they were analysed by groups of subjects, electrodes, angle at the knee for the lower limb or the angle at the elbow for the upper limb, or ramp or step contractions. Electrodes were characterized by type (bipolar or array), distance and size. Groups of subjects were described by gender and age.
These selection criteria produced 21 studies with 63 cases for upper limb muscles and nine studies with 31 cases for lower limb muscles. Studies were labelled with a letter; cases within those studies with numbers. Tables 1 and 2 present all selected studies on changes in MF and MPF under the influence of an external force acting on upper or lower limb muscles, respectively. Those studies discussed not only the various ranges of levels of force, but also the various factors that affected the EMG signal.
Table 1. Studies by muscle, parameter, posture in elbow joint, type of contractions and subject-related factors (age and gender).
| Study | Case | Population | Age (years) | Contraction | Angle (°) | Muscle | Parameter | Electrode |
|---|---|---|---|---|---|---|---|---|
| [10] | a1 | 10M | 20–34 | Step | 115 | BB | MF | 1 mm d/10 mm l |
| a2 | 10F | |||||||
| a3 | 10M | 65–78 | ||||||
| a4 | 10F | |||||||
| [13] | c1 | 1A n/a | n/a | Ramp | 90 | BB, TB | MF | 3 mm d/10 mm l |
| c2 | 1A n/a | 9 mm d/40 mm l | ||||||
| c3 | 1B n/a | 3 mm d/10 mm l | ||||||
| c4 | 1B n/a | 9 mm d/40 mm l | ||||||
| [19] | rk1 | 16M | 23–33 | Ramp | 90 | ED | MF, MPF | 5 × 5 mm2/20 mm |
| rk2 | ||||||||
| [18] | ta | 56M + 38F | 5–69 | Step | 90 | BB | MF | 10 mm × 1 mm/10 mm l (4 electrodes) |
| [20] | e1 | 1A n/a | n/a | Step | 90 | BB, ED | MF | 12 mm d/35 mm l |
| e1 | 1A n/a | IN | 9 mm d/35 mm l | |||||
| e2 | 1B n/a | BB, ED | 12 mm d/35 mm l | |||||
| [21] | b1 | 6M | 20–29 | Step | 90 | BB | MF | n/a/10 mm l |
| b2 | 6M | 60–69 | ||||||
| b3 | 6F | 20–29 | ||||||
| b4 | 6F | 60–69 | ||||||
| [22] | p1 | 18 right-handed | n/a | Step | n/a | IN | MF | Non-dominant hand |
| p3 | Dominant hand | |||||||
| p2 | 17 left-handed | Dominant hand | ||||||
| p4 | Non-dominant hand | |||||||
| [23] | be | 3M + 4F | 29.5 ± 6.8 | Step | 90 | BB, AD | MF | n/a |
| [24] | r1 | 7M + 3F | 22.2 ± 2.8 | Step | 115 | BB | MPF | 4 mm d/20 mm l |
| r2 | 4 mm d/40 mm l | |||||||
| r3 | 4 mm d/60 mm l | |||||||
| [15] | m1 | 13M | 29.8 ± 7.1 | Ramp | 90 | TB, AN | MF, MPF | Miniature/6 mm l |
| m2 | 16F | |||||||
| [14] | o1 | 4M + 5F | 32.5 ± 10.5; 25.8 ± 2.9 | Ramp | 90 | AN | MF, MPF | Miniature/6 mm l |
| o2 | ||||||||
| o3 | ||||||||
| o4 | Step | |||||||
| o5 | ||||||||
| o6 | ||||||||
| [11] | l1 | 6M + 8F | M32.2; F28.6 | Step | 90 | TB, AN | MF, MPF | Miniature/6 mm l |
| l2 | 6M + 8F | M32.2; F28.7 | Ramp | 90 | ||||
| [25] | f1 | 13M | 29.8 ± 7.1 | Ramp | 90 | BB, TB, AN | MF, MPF | Miniature/6 mm l |
| f2 | 16F | 28.1 ± 5.8 | ||||||
| [7] | n1 | 6M | 28.5 ± 6.9 | Ramp | 90 | TB, AN | MPF | Miniature/6 mm l |
| n2 | Miniature/30 mm l | |||||||
| [5] | k1 | A | n/a | Step | 50 | BB | MPF | silver-silver chloride Red DotTM (Model 2259, 3M Canada Ltd, Canada) |
| k2 | 70 | |||||||
| k3 | 90 | |||||||
| k4 | 110 | |||||||
| k5 | 130 | |||||||
| [17] | mi | 10M | 30.2 ± 6.1 | Step | 120 | BB | MPF | 4-bara |
| [26] | d1 | 46M | 23 ± 3 | Step | 90 | BB | MPF | 5 mm d/20 mm |
| d2 | 50F | 23 ± 2 | ||||||
| [27] | g1 | 10M | 26.6 ± 3 | Step | 120 | BB | MPF | Array of 8 electrodes/5 mm l |
| g2 | ||||||||
| g3 | ||||||||
| [28] | h1 | 4M + 6F | 28.5 ± 4.8 | Step | 135 | BB | MPF | 4 mm d/11 mm l |
| h2 | 4 mm d/10 mm lb | |||||||
| [16] | i1 | 7M | 25 ± 3.1 | Step | 90 | BB | MPF | 5 mm2/20 mm l 37 °C |
| i2 | 5 mm2/20 mm l 34 °C | |||||||
| i3 | 5 mm2/20 mm l °C | |||||||
| i4 | 5 mm2/20 mm l °C | |||||||
| [29] | j1 | 9F | 30–40 | Step | 90 | BB | MPF | 23 mm2/10 mm l |
| j2 | 23 mm2/20 mm l | |||||||
| j3 | 23 mm2/30 mm l | |||||||
| j4 | Ramp | 90 | BB | MPF | 23 mm2/10 mm l | |||
| j5 | 23 mm2/20 mm l | |||||||
| j6 | 23 mm2/30 mm l |
Note: MF = median frequency; MPF = mean power frequency; Angle = angle between arm and forearm; M = males; F = females; d = diameter of the active surface of electrodes; l = inter-electrode distance; n/a = information not available; A = subject A; B = subject B; BB = biceps brachii; TB = triceps brachii; IN = interseousnoss; ED = extensor digitorum; AN = anconeus; AD = abductor digiti minimi.aA 4-bar electrode system consisting of four silver wire electrodes 10 mm long. b4 mm d/10 mm l (11 Laplacian electrodes).
Table 2. Studies by muscle, parameter, posture in knee joint, type of contractions and subject-related factors (age and gender).
| Study | Cases | Population | Age (years) | Contraction | Angle (°) | Muscle | Parameter | Electrode |
|---|---|---|---|---|---|---|---|---|
| [30] | S | 10M | 21.6 ± 3.6 | Step | 45 | VL, VM, RF | MF | Miniature/20 mm l |
| [31] | t1 | 11M + 11F | 21–34 | Step | 90 | VL, VM, RF | MF | 3 pairs of 7 mm electrodes/30 mm l |
| t2 | ||||||||
| [32] | u1 | 15M | 26.5 ± 4.7 | Step | 120 | VL, VM, RF | MF | 8 mm d/20 mm l |
| u2 | 15F | 24.9 ± 3.7 | ||||||
| [33] | v1 | 10M | 32.7 ± 4.8 | Step | 120 | VL | MF | Electrodes arranged in a 10 × 13 rectangular matrix (45 × 60 mm)/5 mm |
| v3 | ||||||||
| v2 | 33.4 ± 6.6 | |||||||
| v4 | ||||||||
| [4] | x1 | 11M | 20.1 ± 0.4 | Ramp | 180 | BF, SE | MF | 4 mm d/15 mm l |
| x2 | ||||||||
| x3 | 135 | |||||||
| x4 | ||||||||
| x5 | 90 | |||||||
| x6 | ||||||||
| [34] | y1 | 16F | 20.21 ± 1.47 | Balist | 180 | GA | MF | n/a/20 |
| y2 | Ramp | |||||||
| [35] | z1 | 15F | 28.3 ± 3.8 | Step | 180 | TA | MF | Unipolar/20 mm l |
| z2 | 15M | 35.4 ± 7.5 | ||||||
| z3 | 15F | 28.3 ± 3.8 | Bipolar/30 mm l | |||||
| z4 | 15M | 35.4 ± 7.5 | ||||||
| [9] | q1 | 7M | 22–43 | Ramp | 90 | VL,VM, RF | MPF | 8 mm d/20 mm l |
| q2 | 7F | 22–43 | 90 | |||||
| q3 | 7M | 22–43 | 90 | |||||
| q4 | 7F | 22–43 | 90 | |||||
| [36] | w1 | 14M | 23.5 ± 3.2 | Step | 150 | VL, VML, VMO | MPF | 4 array electrodes 1 × 5 mm/10 mm l |
| w2 | 120 | |||||||
| w3 | 90 | |||||||
| w4 | 150 | |||||||
| w5 | 120 | |||||||
| w6 | 90 |
Note: MF = median frequency; MPF = mean power frequency; Angle = angle in knee joint; M = males; F = females; d = diameter of the active surface of electrodes; l = inter-electrode distance; n/a = information not available; VL = vastus lateralis; VM = vastus medialis; VMO = vastus medialis obliquus; VML = vastus medialis longus; RF = rectus femoris; BF = biceps femoris; SE = semitendinosus; TA = tibialis anterior; GA = gastrocnemius.
The present study considered MF and/or MPF of six muscles of the upper limb and seven muscles of the lower limb. For the upper limb, MF was studied in biceps brachii (BB), triceps brachii (TB), interseousnoss (IN), extensor digitorum (ED), anconeus (AN) and abductor digiti minimi (AD). MPF was studied in BB, TB and AN. For the lower limb, MF was studied in vastus lateralis (VL), vastus medialis (VM), rectus femoris (RF), tibialis anterior (TA), gastrocnemius (GA) and semitendinosus (SE), whereas MPF was studied in VL, VM and RF.
The values of MF and MPF are presented in figures as a function of the level of muscle contraction (%MVC). General trends in changes in those parameters with the level of muscle contraction were sought. To compare general values of MF and MPF in different cases, mean values (mean values of median frequency [mMF] and mean values of mean power frequency [mMPF]) averaged over levels of contraction and the relative difference between the lowest and the highest values (relative difference in median frequency [aMF] and relative difference in mean power frequency [aMPF]) were also analysed. On the basis of data thus presented, the influence on MF and MPF of the level of muscle contraction and factors, such as the subjects, type of contraction, muscle length and the electrodes, was analysed for each muscle.
3. Results
Figure 1 presents MF values for BB as a function of %MVC. Most results showed an increase in MF with an increased level of muscle contraction. Only study ta and, in some respects, study b showed a decrease in those values. The difference between study ta and the other studies consisted of the type of electrodes (four electrodes stacked over 10 mm). Study b [21] only considered muscle force over 50%MVC. In studies b2 and b4, there was a decrease in values over 70%MVC. In most cases, MF was highest at 60–80%MVC.
Figure 1.

Median frequency (MF) of biceps brachii by muscle force: (a) males; (b) females; (c) a combined group of males and females. Note: Values obtained from studies listed in Table 1 (letters indicate studies, numbers indicate cases within a study). In cases c1, c2, c3,c4, e1 and e2 information on gender is not available. MVC = maximal voluntary contraction.
Figure 2 presents MF values for TB. All cases showed an increase in MF with increased muscle contraction; values were higher for males than for females. In both males and females, the values were highest at 50–60%MVC. In the combined group of males and females in study c [13] and case l2 in study l,[11] there was an increase in values up to 100%MVC. In case l1, there was a decrease over 20%MVC. Study l showed different tendencies of changes in MF in step and ramp contractions.
Figure 2.
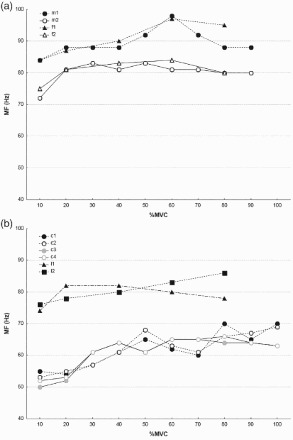
Median frequency (MF) of triceps brachii by muscle force: (a) males (cases f1, m1) and females (cases f2, m2); (b) a combined group of males and females. Note: Values obtained from studies listed in Table 1 (letters indicate studies, numbers indicate cases within a study). In cases c1, c2, c3 and c4 information on gender is not available. MVC = maximal voluntary contraction.
Figure 3 presents MF values in three muscles. MF values in the study of IN were highest, in most cases increasing up to 100%MVC. Only in case p3 did values decrease over 40%MVC. In another study of IN (study e [20]), MF was much lower with a decreasing tendency. Also AD and two out of four cases of ED presented decreasing tendencies. In study be [23] on muscle AD, after a short plateau MF decreased beginning at about 40%MVC.
Figure 3.

Median frequency (MF) by muscle force: (a) interseousnoss (cases e1, p1, p2, p3, p4) and abductor digiti minimi (case be); (b) extensor digitorum (ED) (cases e1, e2, rk1, rk2). Note: Values obtained from studies listed in Table 1 (letters indicate studies, numbers indicate cases within a study). In cases p1, p2, p3,p4, e1 and e2 information on gender is not available. MVC = maximal voluntary contraction.
Figure 4 illustrates MF for AN. Parameters showed an increase in parameters with the highest values at about 60% MVC.
Figure 4.

Median frequency (MF) of anconeus by muscle force: (a) males (cases f1, m1) and females (cases f2, m2); (b) a combined group of males and females (cases o1, o2, o3, o4, o5, o6). Note: Values obtained from studies listed in Table 1 (letters indicate studies, numbers indicate cases within a study). MVC = maximal voluntary contraction.
Figure 5(a) shows mMF, whereas Figure 5(b) shows aMF. The highest values of mMF were recorded in AN and IN. mMF values for AN were about twice the value for BB or TB. When aMF was considered, BB showed strong differences between cases. Even though mMF for AN and IN was twice as high as for the other muscles, when aMF was considered the values for AN and IN were in some cases even lower than for the other muscles. Study c and case a1 presented aMF values about 5-fold higher than the other cases for BB and 2-fold higher than cases for TB.
Figure 5.

Median frequency (MF) of force level by upper limb muscle: (a) mean values of MF averaged over levels of contraction (mMF); (b) relative (dimensionless) difference between the lowest and the highest values of MF (aMF) – only increasing trends over entire range of maximal voluntary contraction were included. Note:  =males;
  =females;
  =ramp contractions;
  =joint angle >90°. BB = biceps brachii; TB = triceps brachii; IN = interseousnoss; ED = extensor digitorum; AN = anconeus; AD = abductor digiti minimi.
In studies a, b and f, mMF for females was lower than mMF for males in BB and TB. In AN, there were no differences by gender. In general, females had lower values of both mMF and aMF than males. However, there were exceptions: in some cases, aMF presented values indicating decreasing tendencies.
Study a showed lower mMF in 65–78-year-olds compared with 20–34-year-olds. However, study b did not show such a relationship between 60–69- and 20–29-year-olds.
Values of mMF for TB were different in studies l and c for a combined group of males and females. The types of electrodes in those studies were different. In study c, cases differed by electrode size and distance.
In Figure 6, which presents MPF of BB by level of muscle contraction, there are observable tendencies of the value of the parameter decreasing with an increase in contraction. In some cases, there were no changes. In study h, in case h2, MPF started to decrease at 40%MVC. In some cases, a plateau was reached after an increase up to 40–50%MVC. Cescon et al. [27] (study p) used array electrodes and showed a decrease in MPF at levels exceeding 50%MVC. Petrofsky and Laymon [16] (study i) showed very small changes in MPF with increased force of BB.
Figure 6.

Mean power frequency (MPF) of biceps brachii by muscle force: (a) males; (b) females; (c) a combined group of males and females. Note: Values obtained from studies listed in Table 1 (letters indicate studies, numbers indicate cases within a study). In cases k1, k2, k3, k4 and k5 information on gender is not available. MVC = maximal voluntary contraction.
Figure 7 shows MPF for TB for various groups of subjects. In this muscle, tendencies of MPF changes with force were ambiguous. In four cases (l1, n1, m2 and f2), there was an obvious decrease with increased muscle contraction.
Figure 7.

Mean power frequency (MPF) of triceps brachii by muscle force: (a) males (cases n1, n2, m1, f1); (b) females (cases f2, m2) and a combined group of males and females (cases l1, l2). Note: Values obtained from studies listed in Table 1 (letters indicate studies, numbers indicate cases within a study). MVC = maximal voluntary contraction.
Figure 8 illustrates MPF of AN by muscle force showing that maximal MPF occurs at about 70%MVC for males and 80%MVC for females. A combined group of males and females differs among cases.
Figure 8.

Mean power frequency (MPF) of anconeus by muscle force: (a) males (cases n1, n2, m1,f1) and females (cases f2, m2); (b) a combined group of males and females. Note: Values obtained from studies listed in Table 1 (letters indicate studies, numbers indicate cases within a study). MVC = maximal voluntary contraction.
Figure 9 illustrates mean values and relative increase in MPF by muscle force and upper limb muscle. The results for MPF were gathered for three muscles (BB, TB and AN). mMPF for AN was about 2-fold higher than for BB and TB. There were differences between cases, especially in aMPF. In general, values of aMPF were close to 0.1, with some cases showing higher values at lower levels of muscle contraction.
Figure 9.

Mean power frequency (MPF) by muscle force of upper limb muscle: (a) mean values of MPF averaged over levels of contraction (mMPF); (b) relative (dimensionless) difference between the lowest and the highest values of MPF (aMPF) – only increasing trends over entire range of maximal voluntary contraction were included. Note: =males; =females; =ramp contractions; =joint angle >90°;  =joint angle <90°. BB = biceps brachii; TB = triceps brachii; AN = anconeus.
Figure 10 illustrates MF for VL, BF, VM and RF. VM had a lower value of MF than RF. For BF the highest value was at about 50–60%MVC, whereas for RF the highest value was at about 60–80%MVC. In VL, in study u, values of MF for males and females were very similar. There were differences at very low and very high levels of muscle contraction only. Some cases presented decreasing tendencies of parameters.
Figure 10.

Median frequency (MF) by muscle force: (a) vastus lateralis for males (cases s, u1, v1, v2, v3, v4) and females (case u2) and a combined group of males and females (cases t1, t2); (b) vastus medialis for males (cases s, u1), females (case u2) and a combined group of males and females (cases t1, t2); (c) rectus femoris for males (cases s, u1), females (case u2) and a combined group of males and females (cases t1, t2); (d) biceps femoris for males. Note: Values obtained from studies listed in Table 2 (letters indicate studies, numbers indicate cases within a study). MVC = maximal voluntary contraction.
Figure 11 presents values for TA, GA and SE. In all muscles and all cases, there were obvious increasing tendencies of MF with increased force. In SE (Figure 11(b)), the maximum occurred at about 60–70%MVC. In all the other cases (Figure 11(a)), MF increased up to 100%MVC.
Figure 11.
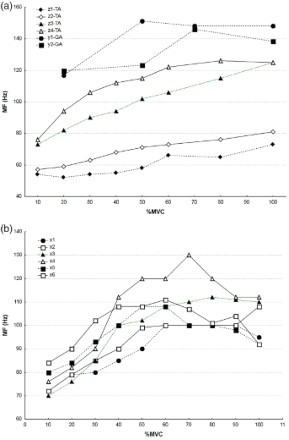
Median frequency (MF) by muscle force: (a) tibialis anterior (TA) for females, TA for males (cases z2, z4) and gastrocnemius (GA) for females (cases y1, y2); (b) semitendinosus for males. Note: Values obtained from studies listed in Table 2 (letters indicate studies, numbers indicate cases within a study). MVC = maximal voluntary contraction.
Figure 12 presents mMF and the relative difference between highest and lowest values (aMF) for lower limb muscles. In general, females had lower values of MF and MPF than males (Figure 12(a)). There were exceptions, though.
Figure 12.

Median frequency (MF) of muscle force by lower limb muscle: (a) mean values of MF averaged over levels of contraction (mMF); (b) relative (dimensionless) difference between the lowest and the highest values of MF (aMF) – only increasing trends over entire range of maximal voluntary contraction were included. Note: =males; =females; =ramp contractions; =joint angle >90°; =joint angle <90°. VL = vastus lateralis; VM = vastus medialis; RF = rectus femoris; BF = biceps femoris; TA = tibialis anterior; GA = gastrocnemius.
When VL was considered, values were much lower in studies v, t and s, than in study u. In study t, three pairs of 7 mm electrodes at a distance of 30 mm were used. In study v, the electrodes were arranged in a 10 × 13 rectangular matrix (4.5 × 6.0 cm2) with an inter-electrode distance of 5 mm. In studies s and u, bipolar electrodes were arranged at a distance of 20 mm. Figure 12(b) presents strong differences in aMF between muscles. Low values of aMF indicating low relative differences depending on the level of muscle contraction were present for RF, VL and VM. High values of aMF were obtained for BF, SE and TA. There were also cases with negative changes, e.g., when an increase in force caused a decrease in MF. In BF and SE, there seemed to be a strong influence of the angle at the knee on aMF. In SE, the angle at the knee influenced aMF in the same manner as in mMF. In BF, changes in the angle at the knee had a different influence on mMF and aMF. Even though mean values were similar in RF and SE, the differences between the highest and lowest values were higher for SE.
Figure 13 presents MPF for VL and RF. The tendencies generally showed an increase in values with an increase in muscle force. The highest values ranged between 40 and 80%MVC depending on the case. In MPF for RF, cases q3 and q4 did not differ by gender. When comparing cases q1 and q2, the values were different.
Figure 13.

Mean power frequency (MPF) by muscle force: (a) vastus lateralis for males (cases w1, w2, w3, w4, w5, w6, q1, q3, s) and females (cases q2, q4); (b) vastus medialis for males (cases w1, w2, w3, w4, w5, w6, q1, q3, s) and females (cases q2, q4); (c) rectus femoris for males (cases q1, q3) and females (cases q2, q4). Note: Values obtained from studies listed in Table 2 (letters indicate studies, numbers indicate cases within a study). MVC = maximal voluntary contraction.
Figure 14 illustrates mMPF and aMPF. Values of mMPF were similar for all muscles. Values of aMPF were mostly under 0.1. However, there were cases (w4 and q3) with aMPF exceeding 0.2.
Figure 14.

Mean power frequency (MPF) of muscle force by lower limb muscle: (a) mean values of MPF averaged over levels of contraction (mMPF); (b) relative (dimensionless) difference between the lowest and the highest values of MPF (aMPF) – only increasing trends over entire range of maximal voluntary contraction were included. Note: =males; =females; =ramp contractions; =joint angle >90°. VL = vastus lateralis; VM = vastus medialis; VM-o = vastus medialis obliquus; VM-l = vastus medialis longus; RF = rectus femoris.
4. Discussion
The analysis focused on the relationship between the values of spectral parameters (MF and MPF) and the level of muscle contraction expressed as %MVC with consideration of confounding factors, such as groups of subjects, type of contraction, muscle length and the electrodes. Most cases showed an increase in both power spectrum parameters, MF and MPF, with muscle contraction. However, there were cases, where the tendencies were opposite. Mathur et al. [31] and Pincivero et al. [32] recorded no changes, or very small ones, in MF in VM and RF. There was a decrease in MF in AD determined by Gelli et al. [23] and in IN and ED by Inbar et al.[20]
It is conceivable that the gradual recruitment of larger and faster MUs, as the level of muscle contraction increases, causes an increase in spectral parameters. An increase in spectral parameters with increased force results from progressive recruitment of MUs in accordance with the size of motor units (MUs). The smaller type I muscle fibres are activated earlier than the larger type II ones. Because propagation of conduction velocity (CV) depends on the diameter of muscle fibre,[37] type II fibres have higher CV, in step with their greater diameter, than type I fibres.[38] An increase in CV implies an increase in EMG characteristic spectral frequencies. That indicates that muscles with a higher proportion of type II fibres should present higher values averaged over the full range of force (mMF and mMPF) and present a stronger increase with force. However, studies show that when averaged MF and MPF (mMF and mMPF, respectively) were higher, the differences between the highest and lowest values (aMF and aMPF) were not necessarily higher. This is exemplified, e.g., by AN, which had the highest mMF among the muscles that were analysed, and the aMF was relatively low. Lower limb muscles such as BF, RF, SE and VL have mMF at a similar level (about 100 Hz). When aMF is considered, RF and VL have very low values compared with the other muscles. Those results reveal an inconsistency between a high level of values of spectral measures and an increase in those measures in accordance with an increase in muscle contraction related to exerted external force.
In the studies reviewed in this article, in most cases there was an increase in MF and MPF with force up to some force level. Then, there was a plateau or even decreasing tendencies. The highest values of MF were recorded at 50–80%MVC, whereas the highest values of MPF were at 40–80%MVC depending on the muscle and case. Muscle force increases by recruiting new MUs and by discharging frequency modulation of activated MUs. The proportion of the recruitment of new MUs and the frequency of discharges in individual muscles depends on the ratio of type I to type II muscle fibres. Because the frequency of MU discharges has little impact on the power spectrum of the EMG signal at higher force levels,[23] there is no increase in the values of MF and MPF. The force at which power spectrum parameters have highest values differs among muscles. There are indications that MU recruitment is completed by 30–40%MVC in small hand muscles and at higher force levels (70–80%MVC) in large arm muscles.[39] In the reviewed studies, the force levels at which a parameter reached the highest value were different for different muscles. This can be related to differences in the proportion of type I and type II muscle fibres. For example, when comparing MF at BF and GA, the values for BF are highest at 50% MVC. In GA, there is continuous growth. Arjunan et al. [21] examined only three levels of force for BB: 50, 70 and 100%MVC. It can be supposed that the maximal value after which discharging frequency modulation of activated MUs started could be 50%MVC. Alway et al. [40] reported the contribution of type I fibres in the soleus, medial GA and lateral GA to be 75, 59 and 52%, respectively.
The proportion of type I and type II muscle fibres, when both their number and area are considered, is influenced by, e.g., differences in gender and age. According to some studies discussed in this article, there are differences between the results obtained for males and females. However, they differed for different muscles. In VM, higher values of MF were obtained for females, whereas in RF for males (cases u1 and u2). Cioni et al. [35] showed an increase in MF in TA with increased force in both females and males, with clearly lower values of MF for females than for males. Bilodeau et al. [9] also reported MPF values obtained for males as higher than those obtained for females. Research by Esposito et al. [10] on BB indicates that both the force corresponding to MVC and the values for MF were lower in older subjects than in younger ones, both for females and for males. Changes in the values of MF were similar in both age groups. However, MPF for females was lower than for males. Arjunan et al. [21] did not arrive at a definite difference between groups of 20–29- and 60–69- year-olds. However, MF obtained in their study was lower than in other studies.
The main difference within gender and within age groups consists of the construction of type I and type II fibres. It has been shown that type II fibres are smaller in females than type II fibres in males.[41] Because of the differences in type I and type II muscle fibres, recruiting type II muscle fibres in females results in a lower increase in CV and, consequently, lower changes in the power spectrum. Aging is considered to have an impact on muscle mass, caused by loss of muscle fibre numbers and a decrease in muscle fibre size.[42] Literature indicates that the size of type I fibres does not change with age, but type II fibres undergo atrophy and greatly reduce in size with aging.[43]
Differences related to age and gender are important for EMG characteristics. However, differences within a gender or age subgroup can also be important. Some differences can result from the relationship between force and EMG spectral parameters being associated with anatomical and geometric factors underlying the generation of EMG signals. According to Farina et al.,[3] not only the proportion and size of muscle fibres but also thickness of the subcutaneous layer plays a significant role in attenuating the EMG signal registered on the skin surface. Those confounding factors can significantly influence the behaviour of power spectrum parameters.[15] In general, biological tissue between the electrodes and the muscle acts like a low-pass filter, which affects negatively the quality of the EMG signal. The subcutaneous layer causes a reduction in the power spectrum in the higher frequency range.[44] This also affects the change in the parameters of the power spectrum under the influence of changes caused by external force and, consequently, the level of muscle contraction. The properties of fat tissue determine the features of the detected EMG signal in terms of amplitude and of frequency characteristics.[2,3]
Spectral parameters obtained from EMG on the skin surface may be related to the activation of fibres located between superficial and deep muscle layers. The greater the distance between MUs and the electrode, the smaller the power spectrum of the EMG signal. Therefore, the recruitment of MUs located in deep layers may not cause an increase in MF and MPF.[2]
Characteristics of the EMG signal can also be influenced by muscle length determined by body posture or the measurement technique, e.g., the distance between the electrodes, their diameter or the type of contraction.
Muscle length determined by the angle in the joint between body segments affects power spectrum parameters. It also affects the maximal force that the muscle can generate.[45] The change may result from the change in the geometry of muscle fibres due to lengthening. Changes in the cross-section of fibres related to muscle lengthening reduce CV as compared with short muscles. That could suggest that muscle lengthening decreases power spectrum parameters. Cechetto et al. [5] studied the influence of the angle at the elbow on MPF of the EMG signal recorded from BB. Tests were performed for five different angles at the elbow (50°, 70°, 90°, 110° and 130°). There was a significant decrease in the value of MPF with increased values of the angle at the elbow, i.e., with an increase in muscle length. Other studies showed changes in parameters characterizing the power spectrum with changes in the joint angle as depending on the muscle. In research on BF and SE for three muscle lengths determined by the knee flexion angle, values of MF and trends of changes were similar in both muscles.[4] Mean values showed that the longer the muscle, the lower the values of MF. It should be noted that muscle lengthening and shortening influences the position of the electrodes in relation to muscle fibres or structures of extending nerves and the connections between them, which produces variation in the power spectrum. That factor, too, can be responsible for ambiguous results.
Bipolar electrodes were used in most cases discussed in this article. The power spectrum of the EMG signal recorded with a bipolar configuration is influenced by the inter-electrode distance. In general, an increase in the inter-electrode distance shifts the power spectrum towards lower frequencies.[14] This is conveniently expressed as a decrease in MF and MPF. Elfving et al. [46] found a significant decrease of about 10% in MF when the inter-electrode distance increased from 20 to 40 mm. In the case of VL, study u [32] and study v [33] differed. The main difference between those two studies consisted of the electrodes. In study v, the electrodes were arranged in a 10 × 13 rectangular matrix (4.5 × 6.0 cm2) with an inter-electrode distance of 5 mm. In study u,[32] the electrodes were bipolar, 8 mm in diameter, with an inter-electrode distance of 20 mm. MF increased in both cases. However, in study u the increase was up to 100%MVC, whereas in study v it was up to 60%MVC. Values obtained by Pincivero et al. [32] in study u differed significantly from the other studies. Array electrodes were also used by Cescon et al. [27] for BB and MPF. MPF values were comparably high for this muscle. Also in study h,[28] cases h1 and h2 for BB showed that Laplacian electrodes presented higher values than bipolar ones. That can be so because a Laplacian configuration increases the spatial resolution of the bioelectrical signal; hence, it attenuates bioelectrical interferences, such as the electrocardiogram (ECG) signal in sEMG recordings.[47] Many recent studies have also addressed the importance of using proper electrode placement when recording the surface EMG signal.[48] However, this article did not consider that issue as a confounding factor.
Studies on both isometric step and ramp contractions have suggested that the type of contraction affects the increase in MPF and MF. Most studies involved step contractions. Bilodeau et al. [11] compared the behaviour of MF and MPF with increasing levels of muscle contraction in the two types of contractions for TR and AN. The study showed no statistically significant differences between the two types of contractions. However, in TR, there were clearly visible differences in the behaviour of both parameters between the increase in force-induced contractions. In step contractions for AN, the values of parameters increased to a certain level, reached a plateau and subsequently decreased. In ramp contractions, there was a continuous increase in MF with the level of muscle contraction. For MPF, in step contractions in TR the values decreased after 20%MVC. In step contractions, there was an increase up to 80%MVC. In AN, mMF and aMF were higher during ramp than during step contractions.[11,14] The situation was different in GA.[34] The use of ramp contractions raises the problem of stationarity of the signal.[11] It is assumed that different strategies control increasing muscle strength in both types of force. Nevertheless, according to Bilodeau et al. [49] the distribution of amplitude and stationarity of the EMG signal is comparable in step and ramp contractions. Thus, it can be assumed that if the differences in the exerted force produced by step and ramp contractions are small, those contractions can be compared.
In summary, the aim of this analysis of studies on changes in MF and MPF with the level of muscle contraction was to find rules and to determine which factors had an unambiguous influence on the relationship between parameters and the level of muscle contraction. The analysis showed that each of the factors considered differentiated MF and MPF. However, no unambiguous relationship was found. The analysis showed that there were differences in terms of the mMF and mMPF, and increasing or decreasing tendencies. All of the confounding factors that were analysed, e.g., groups of subjects, type of contraction, muscle length and electrodes, were shown to have an influence.
It is difficult to see trends common for both muscles and parameters. However, the increase tendencies were more obvious in MF than in MPF. In most cases, MPF did not exceed 0.1, with more values indicating a decrease in values with muscle contraction. Only in two cases for the lower limb and one case for the upper limbs was aMPF greater than 0.2. This can suggest that MPF is less sensitive to changes in muscle contraction.
The differences were muscle related. A different number of studies focused on different muscles. For some muscles, there were more study cases than for other muscles, which could have affected the analysis. That means that the range in the values of parameters could depend on the number of studies of a muscle. However, when a single muscle is considered, there are also differences between study cases.
The differences in the results of individual studies, in addition to the analysed factors, might result from the limited number of subjects, the statistical methods used, the differences in protocols, the location of electrodes and the orientation of muscle fibres with respect to the electrodes. The differences in the results obtained for the same muscle may also depend on whether the muscle acts as an antagonist or antagonist or on the acquired skill in performing tasks.[13]
The common practice is to determine the relationship between the level of muscle contraction and the characteristics of the EMG signal individually for each subject, because of high inter-subject differences. Instead, the conclusion should be that when analysing the influence of different factors on MF and MPF, because those factors interact they should be considered together, not separately.
Acknowledgements
The author would like to thank Jadwiga Kozińska-Korczak for her technical help in the preparation of this article.
Funding
This paper is based on the results of a research task carried out within the scope of the statutory activity of the Central Institute for Labour Protection – National Research Institute (CIOP-PIB) supported by the Ministry of Science and Higher Education.
Disclosure statement
No potential conflict of interest was reported by the author.
References
- Botter A, Lanfranco F, Merletti R, et al. Myoelectric fatigue profiles of three knee extensor muscles. Int J Sports Med. 2009;30(6):408–417. doi: 10.1055/s-0028-1112142. [DOI] [PubMed] [Google Scholar]
- Farina D, Merletti R. Methods for estimating muscle fibre conduction velocity from surface electromyographic signals. Med Biol Eng Comput. 2004;42(4):432–445. doi: 10.1007/BF02350984. [DOI] [PubMed] [Google Scholar]
- Farina D, Fosci M, Merletti R. Motor unit recruitment strategies investigated by surface EMG variables. Eur J Appl Physiol. 2002;92:235–47. doi: 10.1152/jappl.2002.92.1.235. [DOI] [PubMed] [Google Scholar]
- Kellis E, Katis A. Reliability of EMG power-spectrum and amplitude of the semitendinosus and biceps femoris muscles during ramp isometric contractions. J Electromyogr Kinesiol. 2008;18(3):351–358. doi: 10.1016/j.jelekin.2006.12.001. [DOI] [PubMed] [Google Scholar]
- Cechetto AD, Parker PA, Scott RN. The effects of four time-varying factors on the mean frequency of a myoelectric signal. J Electromyogr Kinesiol. 2001;11:347–354. doi: 10.1016/S1050-6411(01)00010-4. [DOI] [PubMed] [Google Scholar]
- Krivickas LS, Nadler SF, Petroski GF, et al. Spectral analysis during fatigue. Surface and fine wire electrode comparison. Am J Med Rehabil. 1996;75(1):15–20. doi: 10.1097/00002060-199601000-00005. [DOI] [PubMed] [Google Scholar]
- Bilodeau M, Arsenault AB, Gravel D, et al. The influence of an increase in the level of force on the EMG power spectrum of elbow extensors. Eur J Appl Physiol Occup Physiol. 1990;61(5–6):461–466. doi: 10.1007/BF00236068. [DOI] [PubMed] [Google Scholar]
- Onishi H, Yagi R, Akasaka K, et al. Relationship between EMG signals and force In human vastus lateralis muscle rusing multiple bipolar wire electrodes. J Electromyogr Kinesiol. 2000;10:59–67. doi: 10.1016/S1050-6411(99)00020-6. [DOI] [PubMed] [Google Scholar]
- Bilodeau M, Schindler-Ivens S, Williams DM, et al. EMG frequency content changes with increasing force and during fatigue in the quadriceps femoris muscle of men and women. J Electromyogr Kinesiol. 2003;13(1):83–92. doi: 10.1016/S1050-6411(02)00050-0. [DOI] [PubMed] [Google Scholar]
- Esposito F, Malgrati D, Veicsteinas A, et al. Time and frequency domain analysis of electromyogram and sound myogram in the elderly. Eur J Appl Physiol. 1996;73:503–510. doi: 10.1007/BF00357671. [DOI] [PubMed] [Google Scholar]
- Bilodeau M, Arsenault AB, Gravel D, et al. EMG power spectra of elbow extensors during ramp and step isometric contractions. Eur J Appl Physiol Occup Physiol. 1991;63(1):24–28. doi: 10.1007/BF00760796. [DOI] [PubMed] [Google Scholar]
- Esposito F, Ce E, Gobbo M, et al. Surface EMG and mechanomyogram disclose isokinetic training effects on quadriceps muscle in elderly people. Eur J Appl Physiol. 2005;94:549–557. doi: 10.1007/s00421-005-1371-y. [DOI] [PubMed] [Google Scholar]
- Bernardi M, Solomonow M, Nguyen G, et al. Motor unit recruitment strategy changes with skill acquisition. Eur J Appl Physiol Occup Physiol. 1996;74(1–2):52–59. doi: 10.1007/BF00376494. [DOI] [PubMed] [Google Scholar]
- Bilodeau M, Arsenault AB, Gravel D, et al. EMG power spectrum of elbow extensors: a reliability study. Electromyogr and Clin Neurophysiol. 1994;34:149–158. [PubMed] [Google Scholar]
- Bilodeau M, Cincerea M, Gervais S, et al. Changes in the electromyographic spectrum power distribution caused by a progressive increase in the force level. Eur J Appl Physiol. 1995;71:113–123. doi: 10.1007/BF00854967. [DOI] [PubMed] [Google Scholar]
- Petrofsky J, Laymon M. Muscle temperature and EMG amplitude and frequency during isometric exercise. Aviat Space Environ Med. 2005;76:1024–1030. [PubMed] [Google Scholar]
- Rainoldi A, Galardi G, Maderna L, et al. Repeatability of surface EMG variables during voluntary isometric contractions of the biceps brachii muscle. J Electromyogr Kinesiol. 1999;9:105–119. doi: 10.1016/S1050-6411(98)00042-X. [DOI] [PubMed] [Google Scholar]
- Kaplanis PA, Pattichis CS, Hadjileontiadis LJ, et al. Surface EMG analysis on normal subjects based on isometric voluntary contraction. J Electromyogr Kinesiol. 2009;19:157–171. doi: 10.1016/j.jelekin.2007.03.010. [DOI] [PubMed] [Google Scholar]
- Roman-Liu D, Konarska M. Characteristics of power spectrum density function of EMG during muscle contraction below 30%MVC. J Electromyogr Kinesiol. 2009;19(5):864–874. doi: 10.1016/j.jelekin.2008.05.002. [DOI] [PubMed] [Google Scholar]
- Inbar GF, Allin J, Paiss O, et al. Monitoring surface EMG spectral changes by the zero crossing rate. Med Biol Eng Comput. 1986;24(1):10–18. doi: 10.1007/BF02441600. [DOI] [PubMed] [Google Scholar]
- Arjunan S, Kumar D, Kalra C, et al. doi: 10.1109/IEMBS.2011.6090957. Effect of age and gender on the surface electromyogram during various levels of isometric contraction. 33rd Annual International Conference of the IEEE EMBS Boston, Massachusetts USA. August 30 – September 3, 2011. [DOI] [PubMed]
- De Luca DJ, Sabbahi MA, Roy SH. Median frequency of the myoelectric signal. Eur J App Physil. 1986;55:457–464. doi: 10.1007/BF00421637. [DOI] [PubMed] [Google Scholar]
- Gelli F, Del Santo F, Popa T, et al. Factors influencing the relation between corticospinal output and muscle force during voluntary contractions. Eur J Neurosci. 2007;25(11):3469–3475. doi: 10.1111/j.1460-9568.2007.05590.x. [DOI] [PubMed] [Google Scholar]
- Beck TW, Housh TJ, Johnson GO, et al. Comparison o Fourier and wavelet transform procedures for examining the mechanomyographic and electromyographic frequency. Electromyogr Clin Neurophysiol. 2005;45:93–103. [PubMed] [Google Scholar]
- Bilodeau M, Arsenaut AB, Gravel D, et al. Influence of gender on the EMG power spectrum during an increasing force level. J Electromyogr Kinesiol. 1992;2:121–129. doi: 10.1016/1050-6411(92)90009-8. [DOI] [PubMed] [Google Scholar]
- Gabriel DA, Kamen G. Experimental and modeling investigation of spectral compression of biceps brachii SEMG activity with increasing force levels. J Electromyogr Kinesiol. 2009;19:437–448. doi: 10.1016/j.jelekin.2007.10.009. [DOI] [PubMed] [Google Scholar]
- Cescon C, Sguazzi E, Merletti R, et al. Non-invasive characterization of single motor unit electromyographic and mechanomyographic activities in the biceps brachii muscle. J Electromyogr Kinesiol. 2006;16(1):17–24. doi: 10.1016/j.jelekin.2005.02.005. [DOI] [PubMed] [Google Scholar]
- Ollivier K, Portero P, Maisetti O, et al. Repeatability of surface EMG parameters at various isometric contraction levels and during fatigue using bipolar and laplacian electrode configurations. J Electromyogr Kinesol. 2005;15:466–473. doi: 10.1016/j.jelekin.2005.01.004. [DOI] [PubMed] [Google Scholar]
- Gerdle B, Eriksson NE, Brundin L. The behaviour of the mean power frequency of the surface electromyogram in biceps brachii with increasing force and during fatigue. With special regard to the electrode distance. Electromyogr Clin Neurophysiol. 1990;30(8):483–489. [PubMed] [Google Scholar]
- Linnamo V, Strojnik V, Komi PV. Electromyogram power spectrum and features of the superimposed maximal M-wave during voluntary isometric actions in humans at different activation levels. Eur J Appl Physiol. 2001;86(1):28–33. doi: 10.1007/s004210100462. [DOI] [PubMed] [Google Scholar]
- Mathur S, Eng JJ, MacIntyre DL. Reliability of surface EMG during sustained contractions of the quadriceps. J Electromyogr Kinesiol. 2005;15:102–110. doi: 10.1016/j.jelekin.2004.06.003. [DOI] [PubMed] [Google Scholar]
- Pincivero DM, Campy R, Salfetnicov Y, et al. Influence of contraction intensity, muscle, and gender on median frequency of the quadriceps femoris. J Appl Physiol. 2001;90:804–810. doi: 10.1152/jappl.2001.90.3.804. [DOI] [PubMed] [Google Scholar]
- Mulder ER, Gerrits KHL, Kleine BU, et al. High-density surface EMG study on the time course of central nervous and peripheral neuromuscular changes during 8 weeks of bed rest with or without resistive vibration exercise. J Electromyogr Kinesiol. 2009;19:208–218. doi: 10.1016/j.jelekin.2007.04.002. [DOI] [PubMed] [Google Scholar]
- Ricard MD, Ugrinowitsch C, Parcell AC, et al. Effects of rate of force development on EMG amplitude and frequency. Int J Sports Med. 2005;26(1):66–70. doi: 10.1055/s-2004-817856. [DOI] [PubMed] [Google Scholar]
- Cioni R, Giannini F, Paradiso C, et al. Sex differences in surface EMG interference pattern power spectrum. J Appl Physiol. 1994;77(5):2163–2168. doi: 10.1152/jappl.1994.77.5.2163. [DOI] [PubMed] [Google Scholar]
- Spairani L, Barbero M, Cescon C, et al. An electromyographic study of the vastii muscles during open and closed kinetic chain submaximal isometric exercises. Int J Sports Phys Ther. 2012;7(6):617–626. [PMC free article] [PubMed] [Google Scholar]
- Blijham PJ, ter Laak HJ, et al. Relation between muscle fiber conduction velocity and fiber size in neuromuscular disorders. J Appl Physiol. 2006;100:1837–1841. doi: 10.1152/japplphysiol.01009.2005. [DOI] [PubMed] [Google Scholar]
- Masuda T, De Luca CJ. Recruitment threshold and muscle fiber conduction velocity of single motor units. J Electromyogr Kinesiol. 1991;1(2):116–123. doi: 10.1016/1050-6411(91)90005-P. [DOI] [PubMed] [Google Scholar]
- Moritz CT, Barry BK, Pascoe MA, et al. Discharge rate variability influences the variation in force fluctuations across the working range of a hand muscle. J Neurophysiol. 2005;93(5):2449–2459. doi: 10.1152/jn.01122.2004. [DOI] [PubMed] [Google Scholar]
- Alway SE, MacDougall JD, Sale DG, et al. Functional and structural adaptations in skeletal muscle of trained athletes. J Appl Physiol. 1988;64(3):1114–1120. doi: 10.1152/jappl.1988.64.3.1114. [DOI] [PubMed] [Google Scholar]
- Jaworowski A, Porter MM, Holmbäck AM, et al. Enzyme activities in the tibialis anterior muscle of young moderately active men and women: relationship with body composition, muscle cross-sectional area and fibre type composition. Acta Physiol Scand. 2002;176(3):215–225. doi: 10.1046/j.1365-201X.2002.t01-2-01004.x. [DOI] [PubMed] [Google Scholar]
- Kent-Braun JA, NG AV. Skeletal muscle contractile and non-contractile components in young and older women and men. J Appl Physiol. 2000;88:662–668. doi: 10.1152/jappl.2000.88.2.662. [DOI] [PubMed] [Google Scholar]
- Porter MM, Vandervoort AA, Lexel J. Aging of human muscle: structure, function and adaptability. Scand J Med Sci Sports. 1995;5:129–142. doi: 10.1111/j.1600-0838.1995.tb00026.x. [DOI] [PubMed] [Google Scholar]
- Minetto MA, Botter A, Šprager S, et al. Feasibility study of detecting surface electromyograms in severely obese patients. J Electromyogr Kinesiol. 2013;23(2):285–295. doi: 10.1016/j.jelekin.2012.09.008. [DOI] [PubMed] [Google Scholar]
- Linnamo V, Strojnik V, Komi PV. Maximal force during eccentric and isometric actions at different elbow angles. Eur J Appl Physiol. 2006;96:672–678. doi: 10.1007/s00421-005-0129-x. [DOI] [PubMed] [Google Scholar]
- Elfving B, Liljequist D, Mattsson E, et al. Influence of interelectrode distance and force level on the spectral parameters of surface electromyographic recordings from the lumbar muscles. J Electromyogr Kinesiol. 2002;12(4):295–304. doi: 10.1016/S1050-6411(02)00027-5. [DOI] [PubMed] [Google Scholar]
- Prats-Boluda GJ, Garcia-Casado JL, Martinez-de-Juan JL, et al. Active concentric ring electrode for non-invasive detection of intestinal myoelectric signals. Med Eng Phys. 2011;33(4):446–455. doi: 10.1016/j.medengphy.2010.11.009. [DOI] [PubMed] [Google Scholar]
- Beck TW, Housh TJ, Mielke M, et al. The influence of electrode placement over the innervation zone on electromyographic amplitude and mean power frequency versus isokinetic torque relationships. J Neurosci Methods. 2007;162:72–83. doi: 10.1016/j.jneumeth.2006.12.009. [DOI] [PubMed] [Google Scholar]
- Bilodeau M, Cincera M, Arsenault AB, et al. Normality and stationarity of EMG signals of elbow flexor muscle during ramp and step isometric contractions. J Electromyogr Kinesiol. 1997;7:87–96. doi: 10.1016/S1050-6411(96)00024-7. [DOI] [PubMed] [Google Scholar]