

ABSTRACT
Epidemiological studies have demonstrated clear associations between specific dietary and environmental risk factors and incidence of colorectal cancer, but the mechanisms responsible for these associations are not known. An animal model could facilitate such an understanding. Both genotoxic and nongenotoxic carcinogens induce aberrant crypt foci (ACF) in the colons of F344 rats. F344 rats were provided with diets that contained putative risk factors for CRC: low calcium and low vitamin D, high iron, high fructose, and decreased light (UV) exposure or a control diet for 14 wk. The rats were then assessed with biochemical measures and by topological examination for evidence of colon abnormalities. Circulating ionized calcium was decreased from 2.85 to 1.69 mmol/L, and ACF were increased from 0.7 to 13.6 lesions/colon (both P < 0.001). Rats exposed to the multiple environmental conditions associated with colon cancer, developed ACF similar to the heterogeneous or ill-defined ACF in the human colon. Heterogeneous ACF are the most frequently seen in humans and are also seen in rats shortly after exposure to the non-genotoxic colon carcinogen, dextransulfate sodium. The rodent model could be used to assess the pathways from diet and environment to colon cancer and to provide guidance for clinical studies.
Introduction
Epidemiology studies have shown that the incidence of colorectal cancer (CRC) is associated with dietary and lifestyle risk factors. The associations have been evaluated by the World Cancer Research Fund/American Institute of Cancer Research in their Expert Report (1). The report judged as “convincing” or “probable” CRC risk with increased consumption of red meat, processed meat and alcoholic beverages; with decreased consumption of calcium, dairy products, garlic and foods containing dietary fiber; and with physical inactivity, increased adult attained height and increased body and abdominal fatness. Obesity itself was found to be associated with consumption of energy-dense foods and sugary drinks (1). In addition, recent cohort studies have demonstrated a strong association of CRC risk with low circulating 25-hydroxyvitamin-D (2,3). How does such a diverse group of largely dietary risk factors initiate CRC? How do these factors produce the mutations that result in the widespread genetic damage that is so characteristic of CRC?
Results of experimental animal studies could explain several of the risk factors: First, calcium supplementation inhibited the promoting effect of a high fat diet on azoxymethane-induced aberrant crypt foci (ACF) (4), through a process that was thought to occur through the formation of calcium soaps (5,6). The increased concentration of colonic calcium supported the maintenance of the colonic barrier by decreasing the effect of bile and fatty acids. A diet presumed to simulate the Western diet—a diet with low calcium and vitamin D, and high fat and phosphate—increased colonic epithelial proliferation and foci of hyperproliferation in mice after 12 wk (7). A similar diet with decreased methyl donors and fiber, provided for 18 to 24 mo, induced colonic tumors (8). Calcium supplementation of the latter diet decreased the yield of tumors markedly (9). Second, high meat diets with heme iron promoted the growth of induced ACF in rats under conditions in which dietary calcium was decreased in a process that increased oxidative stress (10,11). Third, high energy-dense diets led to hyperinsulinemia and promotion of the growth of azoxymethane-induced ACF in rats (12).
McKeown-Eyssen et al. proposed a model that involved the interaction of these risk factors (13). They suggested that: 1) calcium deficiency leads to focal failures of tight junctions (14), decreased colonic barrier function, foci of hyperproliferation, inflammation and oxidative stress; 2) ferrous iron as from meat consumption increases the toxicity of the oxidative stress through the formation of the highly reactive hydroxyl radical (15); and 3) energy substrate excess increases circulating insulin and cell proliferation. It also increases the levels of short chain sugars involved in glycolysis (e.g., glyceraldehyde, methylglyoxal, dihydroxyacetrone and glyoxal) (16), which result in the formation of the highly cytotoxic and genotoxic reactive carbonyl species (RCS) in the presence of oxidative stress (17–19). These endogenous toxins form DNA adducts (20) and may be the presumed carcinogens responsible for the formation of colonic polyps and cancers.
We sought a model to test these proposals. F344 rats exposed to genotoxic colon carcinogens, such as azoxymethane, develop preneoplastic ACF and CRC (21,22). These ACF are discrete, well-defined lesions consisting of clusters of large intensely stained crypts with slit-like lumens that contrast sharply with the uniform surrounding normal crypts and are typically dysplastic on histologic examination. Similar, though more heterogeneous and ill-defined, lesions are also induced when animals are exposed to non-genotoxic colon carcinogens such as dextransulfate sodium (DSS) (22) and are also associated with increased risk of colon cancer in humans (23). ACF can be assessed with fewer animals in a much shorter time than cancers in rats or other rodents (22) and could be possible endpoints, as they can also be observed in the human colon, frequently associated with colonic tumors. ACF have been criticized as surrogate end points for cancer because of an implied assumption that they are the only lesions directly on the path to cancer and that only one pathway leads to malignancy. We now know that multiple pathways from risk factors to cancers are likely the norm and that the effects of those risk factors likely interact (13). To assess these pathways and interactions, we need rapid assessments of possible colonic cell damage, such as could be available with measures of colonic aberrations.
We therefore asked do F344 rats develop ACF as seen in humans when they are fed a diet and exposed to an environment that simulates risk factors for CRC in man? We report here that F344 rats fed a diet and exposed to an environment that decreased calcium and vitamin D (calcium, dairy products), increased iron (meat and processed meat), and increased fructose (energy dense foods and energy substrate excess), developed ACF in a period of 14 wk. The ACF we observed were unlike those observed with genotoxic carcinogens, but resembled the frequent heterogeneous, and typically nondysplastic ACF seen in the human colon (22). We also report laboratory measures of each of the proposed environmental risk factors (13). We suggest that the formation of heterogeneous, nondysplastic ACF in rodents could provide a biomarker for assessing the individual and combined effects of possible environmental risk factors for CRC.
Materials and methods
Animal study design
One hundred to 150 g male F-344 rats were obtained from Charles River Laboratories (Senneville, QC, Canada), randomly assigned to the groups of each of the 3 studies, and were tagged individually. Rats were housed in pairs in ventilated cages and provided with acidified, demineralized water ad libitum and cornhusk bedding. Fluorescent lighting was on a 12-h on and off cycle with a 1 h fade in and out, simulating sunrise and sunset. After an acclimatization period of 2 or more weeks, they were given the presumed low- and high-risk diets as described in Table 1.
Table 1.
Ingredients of control Diet A and presumed high-risk Diet B, both based on AIN-76A.
| Ingredients | AIN-76A diet (g) | Diet A (g) | Diet B (g) | ||
|---|---|---|---|---|---|
| Grams per 1000 grams of diet | |||||
| Sucrose | 500 | 0 | 0 | ||
| Dextrose (glucose) | 0 | 560 | 0 | ||
| Fructose | 0 | 0 | 560 | ||
| Corn starch | 150 | 0 | 0 | ||
| Maltodextrin | 0 | 90 | 90 | ||
| As in AIN-76A except as noted here | |||||
| Iron (as ferric chloride) | 0.05 | 0.05 | 0.6 | ||
| Calcium | 5.2 | 5.2 | 0.4 | ||
| Phosphate | 5.4 | 5.3 | 5.3 | ||
| Vitamin D3, IU | 1000 | 1000 | 100 | ||
| Sodium | 1 | 2 | 2 | ||
Diet A = control diet based on AIN-76 with glucose, maltodextrin; Diet B = as Diet A with low calcium, low vitamin D3, and high iron, with fructose rather than glucose (high oxidative and carbonyl stress); The Research Diets products codes for the diets are: D10001, D11011301, and D10102604, respectively.
Study 1
Twelve rats were assigned to 2 groups of 6 rats each. One was allocated to Diet A and the second to the presumed high-risk Diet B (Table 1). At 14 wk, both groups were sacrificed, under isoflurane anesthesia for collection of blood for plasma and serum, and after euthanasia (CO2) for collection of colons.
Study 2
Sixty-five rats were assigned to 2 groups, 1 of 20 rats allocated to the control Diet A and the second of 45 rats to Diet B. Both groups were sacrificed at 40 wk with collection of colons after euthanasia for surface, topologic measures.
Study 3
Thirty-six rats were assigned to 2 groups of 18 rats each allocated to Diets A or B. Illumination of the room was decreased 10-fold as assessed by light meter, with a fluorescent light controller (Lutron Control, Coopersburg, PA). At 14 wk, the rats were sacrificed as before for plasma and serum, and for colon collection. Colons were also assessed for surface and histological measures as noted in the Results section. All rat experiments were approved by the University of Toronto Animal Care Committee, and met federal and provincial guidelines and standards for the care and use of animals in research.
Animal diets
Diets were provided by Research Diets (New Brunswick, NJ), color-coded and pelleted with content as described in Table 1. The diets on receipt were bagged and sealed in quantities sufficient for 1 week and were held at -80°C until thawed and distributed to the cage hoppers.
Laboratory methods
Chemicals
Trichloroacetic acid, thioglycolic acid, hydrochloric acid, ferric ammonium citrate, bathophenanthroline disulfonate, sodium acetate, phosphate buffered saline (PBS) solution, radio-immunoprecipitation assay (RIPA) buffer, and Hank's balanced salt solution were purchased from Sigma-Aldrich (Oakville, ON, Canada). OxiSelect™ methylglyoxal ELISA kits were purchased from Cell Biolabs, Inc. (San Diego, CA). Thiobarbituric acid reactive substances (TBARS) assay kits were purchased from Cayman Chemical Company (Ann Arbor, MI). Bicinchoninic acid (BCA) protein assay kits were purchased from Cedarlane (Burlington, ON, Canada).
Sample preparation
Blood for plasma and serum was collected in heparin-coated syringes or plain syringes, respectively, and then transferred into collection tubes and stored on ice. The tubes were inverted 5 times and stored at room temperature for 30 min. The serum and plasma were collected following centrifugation at 2000 × g for 15 min at 4°C. Supernatants were removed and stored at 80°C. Colon epithelial cells were prepared with modification to a previously used method (24). The excised colons were rinsed with cold PBS solution, cut into 3 pieces, placed on filter paper, opened longitudinally, and placed in a Petri dish with 25 mmol/L EDTA in PBS (without calcium or magnesium) for 10 min with gentle swirling every minute, after which time the epithelial cells had separated from the colon wall at the basement membrane and were gently scraped off, and, after rinsing with PBS to remove contaminants, transferred into plastic tubes for analysis. The samples were homogenized in 1.5 mL 50 mmol/L phosphate, pH 6.7, containing 1 mmol/L EDTA buffer. The tissue samples prepared for malondialdehyde (MDA) assay were homogenized in RIPA buffer. The homogenate was centrifuged at 10,000 × g for 15 minutes at 4°C. The supernatant was removed and stored at −80°C. The protein content was determined using the BCA protein assay kit (25).
Determination of iron content
The total iron content of serum and tissue homogenates was determined using bathophenanthroline disulphonate (26). One mL of samples with 2 mg/mL protein content was co-incubated with 1 mL of buffer A (10% trichloroacetic acid, 3% thioglycolic acid, 2M HCl) on ice. After 10 min, the precipitated protein was removed by centrifugation; the supernatant was combined with 1 mL of chromogen solution (0.42 mol/L bathophenanthroline disulphonate, 2 mol/L sodium acetate) and incubated for 30 min at room temperature. Absorbance at 540–570 nm was determined on duplicate samples and quantified by interpolation from a standard curve constructed from ferric ammonium citrate diluted in buffer A and carried through the assay in parallel.
Determination of blood glucose and insulin
Plasma glucose was measured using a glucose analyzer (Analox GM9D Analyser, Analox Instruments, Hammersmith, UK). Plasma insulin concentrations were determined by radioimmunoassay (Millipore, Billerica, MA) (27).
Determination of oxidative stress using MDA as a biomarker
The serum and tissue MDA concentrations were measured using the TBARS kit from Cayman Chemical Company (Ann Arbor, MI) (28). Samples were thawed and diluted to 10 µg protein/mL in RIPA buffer. One hundred µL of sample or standard was placed in a 5 mL vial. One hundred µL of SDS solution and 4 mL of the color reagent were added to each vial. The vials were placed in boiling water for 1 h, and then immediately placed in an ice bath for 10 min. The samples were centrifuged at 1600 × g at 4oC for 10 min and allowed to stabilize at room temperature for 30 min. Fluorescence at an excitation wavelength of 530 nm and an emission wavelength of 550 nm was determined on duplicate samples and was quantified by interpolation from a standard curve constructed from MDA diluted in RIPA buffer and carried through the assay in parallel.
Determination of carbonyl stress using methylglyoxal derived advanced glycation end products (MG-AGEs) as a biomarker
The MG-AGEs levels of serum and tissue homogenates were analyzed using the OxiSelect™ methylglyoxal ELISA kit. Samples were thawed and diluted to 10 µg protein/mL in 1× PBS. One hundred µL of the diluted samples and prepared methylglyoxal derived bovine serum albumin (MG-BSA) standards were loaded onto the 96-well protein binding plate. Samples were incubated overnight at 4°C and then washed with 250 µL PBS solution. Samples were then incubated with 200 µL assay diluent for 2 h at room temperature on an orbital shaker, then washed 3 times with 250 µL 1× wash buffer (diluted with deionized water) and were incubated with 100 µL of diluted anti-MG antibody for 1 h. The samples were washed again with 1× wash buffer and 100 µL of diluted secondary antibody-HRP conjugate (diluted 1:1000 with assay diluent) was added. After 1 h of incubation, the samples were washed 5 times with 1× washed buffer and allowed to react with 100 µL of substrate solution for 20 min at room temperature. The reaction was stopped by adding 100 µL of stopping solution and absorbance was immediately determined at 450 nm on duplicate samples and quantified by interpolation from a standard curve constructed from MG-BSA diluted in buffer and carried through the assay in parallel (29).
Determination of clinical biochemical measures and serum vitamin D content
Serum samples were assessed for clinical chemistry at IDEXX laboratory (Markham, ON, Canada) and 25-hydroxyvitamin D measures at the Diagnostic Center for Population and Animal Health, Michigan State University, Lansing, MI.
Colon preparation for surface mucosal assessment
Colons were cleaned, opened longitudinally, and cut in 3 approximately equal lengths. In Study 2, colons were fixed in Bouin's, which stained the colons so as to provide a permanent image of the mucosal surface crypt structure. The advantage of easy repeatability of crypt viewing was offset by the brittleness of the specimens that made detailed histological preparations difficult. In Study 3, colons were fixed in formalin and stained later with Methylene Blue (0.1%).
Colonic mucosal microscopic assessment
The microscopic topological examination assessed the entire colonic mucosa for ACF and lymphoid follicles using the following criteria: Discrete or well-defined ACF are typically observed after a carcinogen such as azoxymethane (AOM) (4). They consisted of clusters of large intensely stained crypts with slit-like lumens and contrast sharply with the uniform surrounding normal crypts (an example is shown in Fig. 1). Heterogeneous or ill-defined ACF are the most frequently observed ACF in the human colon (21, 23) and also observed in the present study in the rat. They consisted of clusters of large, darkly staining crypts, with no sharp demarcation from the surrounding crypts, and with variability in crypt size. Roncucci et al. observed that when the crypt openings were round or oval, the ACF were usually found to be nondysplastic, but in contrast when they were slit-like, they are usually dysplastic (23). In the present study heterogeneous ACF were counted when they contained clusters of 4 or more crypts with an area of greater than 4-times that occupied by normal crypts, criteria adopted by Roncucci et al. and Whiteley et al. (Figure 2 and 3) (22, 23). Colons were also examined for mucin-depleted foci (MDF). These colonic lesions have also been observed in the human colon and in the rat colon after genotoxic carcinogens. They consist of foci of crypts that had either an absence or very small production of mucins identified by high-iron diamine Alcian Blue stain (30). We observed typical isolated lymphoid follicles (ILF). Lymphoid follicles were also associated with heterogeneous ACF (Figs. 2B and 3B). These were not scored as ILF. Large lymphoid follicles (gut-associated lymphoid tissue) were observed at similar sites in all animals.
Figure 4.

An example of the histological appearance at low and high power of an inflammatory/hyperproliferative focus observed in Study 3. On histologic examination of the colons that had been “Swiss rolled,” the foci were noted by their narrow caliber, mucin, and Goblet cell-depleted crypts (yellow arrow in Fig. 4A), and then by the frequent mitotic figures (red arrows in Fig. 4B), the damaged luminal surface of the aberrant crypt focus, and the many acute and chronic inflammatory cells. The large crypts, so evident on the topologic en face preparation, were not as evident in this histological section.
Figure 1.

An example of the very few discrete (or well defined) aberrant crypt foci (ACF) observed in animals on Diet B in Study 3. Note the slit-like lumens likely indicative of a dysplastic histology. (The mucosal field is 1.7 × 0.8 mm.)
Figure 2.

Two examples of heterogeneous (or ill-defined) aberrant crypt focus (ACF) as observed on the colonic mucosal surface after Bouin's fixation in Study 2. The ACF are the foci of large, darkly staining enlarged crypts bordering an infolding pattern over what appears to be a lymphoid follicle. Faint outlines of the openings of small crypts are seen at the center of both ACF. (The mucosal fields are 1.7 × 0.8 mm and 2.7 × 1.3 mm.)
Figure 3.
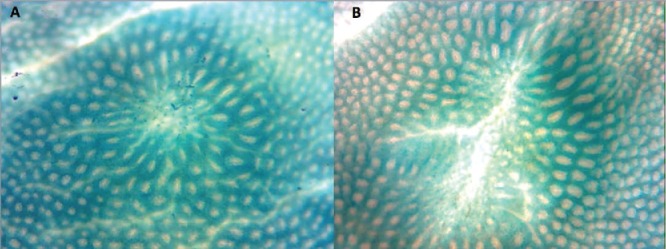
Two examples of heterogeneous (or ill-defined) aberrant crypt focus (ACF) as observed on the colonic mucosal surface following formalin fixation and staining with Methylene Blue in Study 3. Again, a faint outline of the openings of small crypts can be seen at the center of the ACF. We suggest that these changes follow the loss of clusters of crypts and are an early response to the loss of adjacent crypts (The mucosal fields are 1.7 × 0.8 mm.).
Histological methods
A small number of colon specimens were examined histologically. In Study 3, eight representative complete colons, four from treated animals with heterogeneous ACF visible on topological examination and four from control animals, were “Swiss-rolled”, fixed in formaldehyde, sectioned, stained with Hematoxylin and Eosin, and examined for mucosal abnormalities. In a few cases, sections were labeled with antibody to Ki67 and counterstained with Hematoxylin with appropriate positive and negative controls.
Statistical methods
Data are expressed as mean ±SD, and comparisons among treatment groups were made using 2-way analysis of variance. When only 2 groups of treatment means were evaluated, 2-sample t-tests were used. For count data, the square root transformation was used to stabilize the variance before performing the t-test (P < 0.05 was considered significant), as indicated in the text where applicable.
Results
Study 1
To assess the effect of the dietary intervention on metabolic, biochemical, and clinical chemistry measures, animals were assigned to either the high-risk Diet B or the control Diet A, and the measures were assessed at 14 wk (Table 2). The weight gains of the animals on Diet B were decreased (101 vs. 140 g, P < 0.001); fasting glucose was increased (9.2 vs 8.0 mmol/L, P = 0.012); and fasting insulin was increased (95 vs. 35 picoM, P = 0.046). The high-risk diet increased serum and colonic iron (13.4 vs. 0.1 μmol/L, P < 0.03 and 216 vs. 52 μmol/L, p = 0.001, respectively) and cholesterol (3.1 vs 1.9 mmol/L, P = 0.001), but the measure of oxidative stress, MDA in serum and colon, were not significantly affected; the measure of carbonyl stress was increased in the serum (270 vs. 208 μg/L, P = 0.045) but not in the colon (95 vs. 72 mg/L).
Table 2.
Metabolic, biochemical and clinical measures for rats after 14 weeks on Diet A and B (Study 1).
| Dietary groups | Diet A (Control) | Diet B (Carbonyl stress and oxidative stress) |
|---|---|---|
| Number of animals | 6 | 6 |
| Metabolic measures | ||
| Weight gain (g) | 140 ± 7 | 101 ± 5 |
| Fasting blood glucose (mmol/L) | 8.0 ± 0.3 | 9.2 ± 0.2 |
| Fasting insulin (picoM) | 35.2 ± 4.4 | 95.0 ± 33.6 |
| Biochemistry measures | ||
| Iron concentration (μmol/L) | ||
| Serum | 0.1 ± 0.1 | 13.4 ± 4.6 |
| Colon | 52.4 ± 6.5 | 216.2 ± 23.8 |
| MDA concentration (μmol/L) | ||
| Serum | 3.0 ± 1.0 | 1.3 ± 0.6 |
| Colon | 0.2 ± 0.2 | 2.2 ± 1.1 |
| MG-derived AGEs (μg/L) | ||
| Serum | 207.7 ± 17.2 | 270.8 ± 20.0 |
| Colon | 71.6 ± 14.7 | 94.9 ± 13.5 |
| Clinical chemistry measures | ||
| Total protein (g/L) | 64 ± 1 | 63 ± 1 |
| Albumin (g/L) | 42 ± 1 | 42 ± 1 |
| ALP (IU/L) | 77 ± 3 | 160 ± 12 |
| ALT (IU/L) | 75 ± 6 | 91 ± 4 |
| CK (IU/L) | 774 ± 425 | 435 ± 71 |
| Amylase (IU/L) | 2577 ± 445 | 2040 ± 152 |
| Cholesterol (mmol/L) | 1.9 ± 0.1 | 3.1 ± 0.1 |
| Glucose (mmol/L) | 9.5 ± 0.9 | 10.0 ± 0.5 |
| Creatinine (mmol/L) | 30 ± 3 | 28 ± 2 |
| Sodium (mmol/L) | 144 ± 1 | 143 ± 1 |
| Potassium (mmol/L) | 3.9 ± 0.3 | 3.6 ± 0.2 |
| Na/K Ratio (mmol/L) | 37 ± 3 | 40 ± 2 |
| Chloride (mmol/L) | 97 ± 1 | 97 ± 0 |
| Calcium (mmol/L) | 2.63 ± 0.03 | 2.13 ± 0.17 |
| Phosphorus (mmol/L) | 2.0 ± 0.2 | 2.8 ± 0.2 |
MDA = malondialdehyde; MG-derived AGEs = methylglyoxal derived advanced glycation end products.
Diets A, and B as defined in Table 1.
Values are shown as means ± SEM.
Significant as compared to animals on diet A based on nonparametric 2-tailed t-tests (P ≤ 0.05).
Significant as compared to animals on diet A based on nonparametric 2 tailed t-tests (P ≤ 0.01).
Significant as compared to animals on diet A based on nonparametric 2-tailed t-tests (P ≤ 0.001).
Study 2
To determine whether the intervention had a biological effect on colonic epithelium, animals were assigned to either the high-risk Diet B or the control Diet A, and sacrificed at 40 wk to assess topological measures of the colonic mucosa (Table 3). The weight gains of the 41 animals that received Diet B and survived were 16% lower than the 20 animals that received the control diet (224 vs. 266 g, P < 0.01). One surviving rat on the high-risk diet had an invasive 8 × 6 mm adenocarcinoma in the sigmoid colon. On examination of the mucosal surface: Discrete ACF of the type seen with AOM were infrequent and did not differ in number between the 2 diets (0.22 vs. 0.07). Heterogeneous ACF were observed as clusters of large, darkly staining crypts frequently bordering lymphoid follicles (Fig. 1A and 1B). An outline of small crypt openings was seen at the center of some of these heterogeneous ACF (6 of 22 we photographed) (Fig. 1A) (the small crypts were not seen at the time the colons were scored). Heterogeneous ACF were more frequent in the colons of animals on the high risk than the control diet (6.2 vs. 2.8 heterogeneous ACF/colon, P = 0.048). MDF were observed in only a few animals (0.10 vs. 0.06). ILFs appeared to be more frequent in animals on Diet B (1.67 vs. 0.67/colon, P = 0.20). The rats on the high-risk diet also showed significant co-morbidities: 2 died with congestive heart failure and 2 were euthanized after suffering bone fractures.
Table 3.
Colonic mucosal surface measures for rats after 40 weeks on Diet A and B (Study 2).
| Dietary groups | Diet A (control) | Diet B (carbonyl stress and oxidative stress) |
|---|---|---|
| Number of animals | 20 | 41 |
| Weight gain (g) | 266 ± 6 | 224 ± 4 |
| Discrete ACF (AOM-like) | 0.30 ± 0.13 | 0.20 ± 0.06 |
| Heterogeneous ACF/colon | 4.15 ± 1.12 | 9.05 ± 1.79 |
| ILF/colon | 1.40 ± 0.45 | 3.80 ± 0.98 |
| MDF | 0.06 ± 0.05 | 0.10 ± 0.05 |
Diets A and B as defined in Table 1. ILF = isolated lymphoid follicles; ACF = aberrant crypt foci; AOM = azoxymethane; MDF = mucin-depleted foci. Values are shown as means ± SEM per animal.
The ACFs per colon per animal as scored for exogenous carcinogens such as azoxymethane.
The ACFs per colon per animal as scored by criteria of Whiteley et al. (22).
Fraction of rats with MDF.
Significant as compared to animals on diet A based on nonparametric 2-tailed t-tests (P ≤ 0.05).
Significant as compared to animals on diet A based on nonparametric 2-tailed t-tests (P ≤ 0.01).
Study 3
These results suggested that circulating calcium should be further decreased by adding an additional risk factor to the dietary intervention—a 10-fold decrease in the ambient fluorescent light levels, measured in lux, to limit the degree of endogenous vitamin D formation. To assess the effects of the dietary risk factors on biochemical and colon topological measures, animals were provided with either the high-risk Diet B and decreased lighting or the control Diet A, and assessed for the measures 14 wk later (Table 4). Topologic measures were made as in Study 2 but with a stain that permitted subsequent histological assessments (Fig. 2A and 2B). The high-risk diet with decreased light exposure decreased weight gain, 25-hydroxyvitamin D (12.0 vs. 42.5 nmol/L), and calcium (1.69 vs. 2.85 mmol/L), but increased cholesterol, phosphorus, magnesium, and ALP (all P < 0.001). Circulating and colon MDAs and MG-AGEs measures were not affected (P > 0.05). As with Study 2, there was a significant increase in the numbers of heterogeneous ACF in the colons of animals on the high-risk diet (13.6 vs. 0.7 per colon, P < 0.001) (Fig. 2A and B). ILF were also increased (7.4 vs. 0.6, P < 0.001). As seen in Study 1, the outline of small crypt openings was present at the center of some of the heterogeneous ACF (9 of 21 we photographed) (Fig. 2A).
Table 4.
Metabolic, biochemical, clinical, and colonic mucosal surface measures for rats after 14 weeks on Diet A and B with decreased fluorescent light (UV) (Study 3).
| Dietary groups | Diet A (control) | Diet B (carbonyl stress and oxidative stress) |
|---|---|---|
| Number of animals | 18 | 18 |
| Metabolic measures | ||
| Weight gain (g) | 180 ± 4 | 118 ± 4 |
| Biochemistry measures | ||
| MDA concentration (mmol/L) | ||
| Serum | 0.1 ± 0.0 | 0.1 ± 0.0 |
| MG-derived AGEs (μg /L) | ||
| Serum | 217 ± 16 | 241 ± 15 |
| Clinical chemistry measures* | ||
| Total protein (g/L) | 66 ± 0 | 68 ± 1 |
| Albumin (g/L) | 43 ± 0 | 43 ± 1 |
| ALP (IU/L) | 104 ± 3 | 203 ± 11 |
| ALT (IU/L) | 52 ± 1 | 57 ± 2 |
| CK (IU/L) | 389 ± 52 | 644 ± 68 |
| Amylase (IU/L) | 2723 ± 21 | 2468 ± 54 |
| Cholesterol (mmol/L) | 2.2 ± 0.0 | 3.2 ± 0.1 |
| Glucose (mmol/L) | 8.3 ± 0.1 | 8.8 ± 0.1 |
| Creatinine (mmol/L) | 24.7 ± 0.5 | 31.0 ± 1.3 |
| Sodium (mmol/L) | 142.0 ± 0.5 | 142.7 ± 0.7 |
| Potassium (mmol/L) | 4.7 ± 0.1 | 4.3 ± 0.0 |
| Na/K Ratio (mmol/L) | 30.7 ± 0.4 | 33.3 ± 0.4 |
| Chlorine (mmol/L) | 97.3 ± 0.3 | 93.7 ± 0.6 |
| Calcium (mmol/L) * | 2.85 ± 0.09 | 1.69 ± 0.03 |
| Phosphorus (mmol/L) | 2.1 ± 0.0 | 4.2 ± 0.2 |
| Bicarbonate (mmol/L) | 23.8 ± 0.6 | 17.7 ± 0.8 |
| Magnesium (mmol/L) | 0.7 ± 0.0 | 0.9 ± 0.0 |
| 25-hydroxyvitamin D * (nmol/L) | 42.5 ± 3.2 | 12.0 ± 0.7 |
| Colon mucosal surface measures | ||
| Heterogeneous ACF/colon | 0.7 ± 0.4 | 13.6 ± 3.5 |
| Isolated lymphoid follicles/colon | 0.6 ± 0.4 | 7.4 ± 1.4 |
Diets A and B as defined in Table 1. ILF = isolated lymphoid follicles; ACF = aberrant crypt foci. Values are shown as means ± SEM. Two sample 2-tailed test was performed. Heterogeneous ACF and isolated lymphoid follicles are scored per colon per animal.
Sample size 6 + 6 for all Clinical chemistry, except calcium (12 + 12) and 25-hydroxyvitamin D (4 + 4).
Significant as compared to animals on diet A based on nonparametric 2-tailed t-tests (p ≤ 0.05).
Significant as compared to animals on diet A based on nonparametric 2-tailed t-tests (P ≤ 0.01).
Significant as compared to animals on diet A based on nonparametric 2-tailed t-tests (P ≤ 0.001).
Colons from animals of both groups were examined histologically. Those from animals on the control Diet A were unremarkable. In contrast, those from animals on Diet B were punctuated by clusters of 2 to 8 crypts, which differed from normal crypts by a notable loss of goblet cells and smaller crypt diameter (Fig. 4A and Fig. 4B), presumably corresponding to the small crypt openings observed topologically (Fig. 3A and Fig. 3B). Mitotic figures were frequently observed from the base of the crypt well into the upper third (Fig. 4B). The hyperproliferative state was confirmed with immunohistochemistry (Ki67 stain). The epithelial layer at the luminal surface was frequently ragged and damaged. Within some of the foci, the lamina propria was infiltrated by acute and chronic inflammatory cells (Fig 3A and 3B). All hyperproliferative foci examined had no evidence of dysplasia, enlarged or vesicular nuclei, stratification, or loss of polarity, indicating that the ACF at this time were nondysplastic, as in the early phase of DSS carcinogenesis (22). The number of foci of hyperproliferating crypts was less frequent than the number of heterogeneous ACF observed by the topological examination. For instance, the colon that contained such crypts shown in Fig. 3A or Fig. 3B, had 5 such regions in the serial sections, but 48 heterogeneous crypts on topological examination.
Discussion
The rats exposed for 14 wk to environmental risk factors for CRC in humans had, as expected, significantly decreased serum ionized calcium and 25-hydroxyvitamin D, and increased serum iron, serum phosphate and cholesterol, and colonic iron. Their colons on topological examination had a 20-fold increased number of ACF. The ACF were unusual. Rather than the usual discrete and compact structures with slit-like lumens observed after an exposure to genotoxic carcinogens, the ACF were heterogeneous with crypts of various sizes, frequently with no clear border between normal and ACF crypts, and with round or oval open lumens. For the most part, the colons on histological examination were unremarkable, although occasionally the surface epithelium appeared ragged, associated with focal active colitis with hyperproliferation and apoptosis, but no evidence of dysplasia.
The heterogeneous, nondysplastic ACF induced in rats with the presumed high-risk diet and decreased UV exposure, resemble the most common ACF observed in the normal human colon (23). In humans, heterogeneous, nondysplastic ACF of this type make up about 90% of ACF, which includes the serrated ACF with their luminal serrated or saw-tooth contour that are thought to develop into the less-aggressive hyperplastic polyps (31). They have frequently (23,32–35), though not always (36), been found to be increased in individuals with adenomas and carcinomas though their relationship to colon carcinogenesis has remained obscure. They do not appear to represent permanent alterations to the epithelium. In a clinical study in which all ACF were removed, colons were repopulated with ACF in 1 year, with the numbers of ACF after repopulation significantly correlated with the baseline number (37). Also interesting is the association of lymphoid follicles with ACF and colonic neoplasms in the human colon (40,41).
The heterogeneous ACF that we observed in rats exposed to CRC risk factors not only resemble human ACF, they also resemble the nondysplastic ACF as described in rats after intermittent oral exposures to the non-genotoxic colon carcinogen, DSS (22). DSS is known to deplete the skeleton of calcium (42), and levels of dietary calcium are known to markedly affect DSS-induced inflammation (43). These observations are perhaps not surprising because DSS is known to act as a polyanion that binds calcium covalently replacing it with sodium (44,45). Oral DSS, by diverting bound calcium to the fecal stream, could have an effect on colonic ionized calcium similar to that of dietary calcium restriction. Both oral DSS and restricted calcium can induce colon cancer (9,22), but the early effects of the intermittent oral DSS appeared to be much more marked than the continuous calcium restriction. Epithelial cell damage was more severe, inflammation was more advanced (46, 47), and the appearance of dysplasia was more prompt (22). Some of the difference may be a consequence of the intermittent exposure to DSS. The periods between each exposure could allow recovery from the general toxicity of calcium deficiency while the genetic damage induced by the exposure to DSS persists.
The early sequential clinicopathological changes induced by oral DSS have been described in detail for mice by Cooper et al. (47). Initially there was damage to the surface epithelial cells with a loss of cells and increased proliferation of crypt cells. With time, foci of a few crypts became shortened and detached from the basement membrane, presumably a result of a loss of proliferative capacity to provide cells for the surface. With the loss of crypts, there was the possibility for a surface epithelial defect and subsequent focal inflammation and in some cases, lymphoid follicles. Indeed, inflammation was only observed when local crypts were apparently missing. A similar sequence appeared to occur in the human colon after pharmacological doses of sodium phosphate. The treatment decreased local ionized calcium over a period of a few hours (48) and induced “aphthoid ulcers” with underlying lymphoid follicles by 24 h, but left no evidence of colonic damage in patients at later periods of 1 to 8 wk (49).
We suggest that these events could be reflected in the topological view of the affected colons. The loss of crypts would be recognized as a distortion of the usual regular crypt pattern. In the affected areas there would be a smaller number of crypt openings on the surface due to the loss of crypts, producing a pattern with apparently larger crypts at the surface, resembling heterogeneous ACF. A loss of the surface cells of crypts would result in loss of barrier function, aphthoid ulcers with focal inflammation and the appearance of lymphoid follicles. With time and a repopulation of new crypts, the surface would be repaired though the lymphoid follicles would remain as ILF. This suggests that the ACF described here, heterogeneous with round or oval lumens, are not biomarkers for a discrete step in the development of cancer, as discrete ACF have been assumed to be. Instead, they are a response to a loss of adjacent crypts as described above (47) and potentially complicated exposures to cytokines, cytotoxins, and mutagens. The small crypt openings observed on the surface may represent the small, hyperproliferating crypts observed histologically and could be a step in the development of discrete, well-defined ACF. Repeated exposures to agents that led to such a “landscape” of changes in the colonic epithelium (50), could result in the eventual formation of adenomatous polyps and CRC. This interpretation could explain the results of a clinical study in which all ACF were removed from an area of the bowel but was found 1yr later to be repopulated again with ACF with numbers significantly correlated with those at baseline (37). It would also explain how heterogeneous ACF with lymphoid follicles could, on their return to normal appearance or on their progression to tumors, leave evidence of the previous inflammatory event as the ILF. The interpretation could perhaps be studied most efficaciously with the brief intense calcium decrease produced by pharmacological doses of sodium phosphate rather than the long-term depletion with dietary or DSS studies.
The laboratory measures of the environmental risk factors showed that the rats had decreased levels of calcium and vitamin D, increased levels of colonic iron, and evidence of insulin resistance (elevated blood glucose), but these changes did not increase the measures of oxidative stress or carbonyl stress, MDA and MG-AGEs. One explanation for the failure to observe these stress products is that the products are formed in very small foci in ACF. The cells at the base of dysplastic crypts have been found to contain fluorescent lipofuscin protein degradation products in lysosomes (51). Another explanation for the failure to observe a significant effect of the diet on these stress measures is that weight gains were markedly decreased by the diet—not increased as expected. Calcium was decreased extensively (by 10-fold), which might have affected weight gain. But previous studies that utilized diets with similarly decreased levels of calcium (7–9) noted no significant decrease in growth rate. Our choice of fructose as a source of excess calories, hyperinsulinemia, and presumed increase in glyceraldehyde was based on in vitro studies that did not examine energy accumulation (18). Future studies could test the effects of diets in which dietary fat replaced fructose as the agent to promote energy accumulation and weight gain as was used in the earlier study (9). A still further explanation is that our initial hypothesis for the central importance of reactive carbonyls derived from sugars is unsupported. Reactive carbonyl species could be derived from lipids rather than sugars, or reactive nitrogen species could be involved rather than reactive carbonyls (52). Short-term studies with heterogeneous ACF in rodents could clarify the relative importance of these dietary factors on early colonic pathology.
In summary, we have described an experimental rodent model in which a diet typifying the risk factors for CRC induced a type of ACF that is common in the human colon and associated in most studies with the development of CRC. We suggest that the heterogeneous ACF described here be considered as exposure biomarkers for a focal environmental exposure to cytokines and mutagens. Repeated exposure to an environment creating such lesions could increase the burden of mutations in the colonic epithelium and could result in the formation of adenomatous polyps and CRC. The results of studies based on these lesions could provide guidance for the design of future clinical studies.
Funding
This study was funded by the Environment-Cancer Fund of the Cancer Research Society. We thank Ranjana Bhattacharjee, Jenn Martin and Frank Giuliano for help with the animal studies, Salomon Minkin with the statistical analyses, and George Krepinsky for discussions about the chemistry of acidic polyanions.
References
- World Cancer Research Fund/American Institute for Cancer Research . Food, Nutrition, Physical Activity and the Prevention of Cancer: a global perspective. Washington, DC: American Institute for Cancer Research; 2007. http://www.dietandcancerreport.org/cup/index.php Continuous updates are available at. [Google Scholar]
- Jenab M, Buenoe-de-Mesquita HB, Ferrari P, van Duijnhoven FJ, Norat T. Association between pre-diagnostic circulating vitamin D concentration and risk of colorectal cancer in european populations:A nested case-control study. BMJ. 2010:b5500. doi: 10.1136/bmj.b5500. [DOI] [PMC free article] [PubMed] [Google Scholar]
- Wu K, Feskanich D, Fuchs CS, Willett WC, Hollis BW. A nested case control study of plasma 25-hydroxyvitamin D concentrations and risk of colorectal cancer. J Natl Cancer Inst. 2007:1120–1129. doi: 10.1093/jnci/djm038. [DOI] [PubMed] [Google Scholar]
- Wargovich MJ, Allnutt D, Palmer C, Anaya P, Stephens LC. Inhibition of the promotional phase of azoxymethane-induced colon carcinogenesis in the F344 rat by calcium lactate: Effect of simulating two human nutrient density levels. Cancer Lett. 1990:17–25. doi: 10.1016/0304-3835(90)90005-i. [DOI] [PubMed] [Google Scholar]
- Gacs G, Barltrop D. Significance of ca-soap formation for calcium absorption in the rat. Gut. 1977:64–68. doi: 10.1136/gut.18.1.64. [DOI] [PMC free article] [PubMed] [Google Scholar]
- Newmark HL, Wargovich MJ, Bruce WR. Ions and neoplastic development. In: Mastromarino AJ, Brattain MG, editors. Large Bowel Cancer: Clinical and Basic Science Research. Cancer Research Monographs 3. New York: Praeger Scientific Press; 1985. pp. 102–130. [Google Scholar]
- Newmark HL, Lipkin M, Maheshwari N. Colonic hyperproliferation induced in rats and mice by nutritional-stress diets containing four components of a human Western-style diet (series 2) Am J Clin Nutr. 1991;(1 Suppl):209S–214S. doi: 10.1093/ajcn/54.1.209S. [DOI] [PubMed] [Google Scholar]
- Newmark HL, Yang K, Lipkin M, Kopelovich L, Liu Y. A Western-style diet induces benign and malignant neoplasms in the colon of normal C57Bl/6 mice. Carcinogenesis. 2001:1871–1875. doi: 10.1093/carcin/22.11.1871. [DOI] [PubMed] [Google Scholar]
- Newmark HL, Yang K, Kurihara N, Fan K, Augenlicht LH. Western-style diet-induced colonic tumors and their modulation by calcium and vitamin D in C57Bl/6 mice: a preclinical model for human sporadic colon cancer. Carcinogenesis. 2009:88–92. doi: 10.1093/carcin/bgn229. [DOI] [PMC free article] [PubMed] [Google Scholar]
- Pierre F, Tache S, Petit CR, Van der Meer R, Corpet DE. Meat and cancer: Haemoglobin and haemin in a low-calcium diet promote colorectal carcinogenesis at the aberrant crypt stage in rats. Carcinogenesis. 2003:1683–1690. doi: 10.1093/carcin/bgg130. [DOI] [PMC free article] [PubMed] [Google Scholar]
- Pierre F, Peiro G, S Taché, Cross AJ, Bingham SA. New marker of colon cancer risk associated with heme intake: 1,4-dihydroxynonane mercapturic acid. Cancer Epidemiol Biomarkers Prev. 2006:2274–2279. doi: 10.1158/1055-9965.EPI-06-0085. [DOI] [PubMed] [Google Scholar]
- Tran TT, Naigamwalla D, Oprescu AI, Lam L, McKeown-Eyssen G. Hyperinsulinemia, but not other factors associated with insulin resistance, acutely enhances colorectal epithelial proliferation in vivo. Endocrinology. 2006:1830–1837. doi: 10.1210/en.2005-1012. [DOI] [PubMed] [Google Scholar]
- McKeown-Eyssen G, Bruce J, Lee O, O'Brien PJ, Bruce WR. Lifestyle, endogenous toxins and colorectal cancer risk. In: O'Brien PJ, Bruce WR, editors. Endogenous Toxins: targets for disease treatment and prevention. Weinheim: Wiley-VCH; 2010. pp. 673–694. [Google Scholar]
- Ma TY, Tran D, Hoa N, Nguyen D, Merryfield M, Tarnawski A. Mechanism of extracellular calcium regulation of intestinal epithelial tight junction permeability: role of cytoskeletal involvement. Microsc Res Tech. 2000:156–168. doi: 10.1002/1097-0029(20001015)51:2<156::AID-JEMT7>3.0.CO;2-J. [DOI] [PubMed] [Google Scholar]
- Carrier J, Adhgassi G, Platt I, Cullen J, Allard JP. Effect of oral iron supplementation on oxidative stress and inflammation in rats with induced colitis. Aliment Pharmacol Ther. 2001:1989–1999. doi: 10.1046/j.1365-2036.2001.01113.x. [DOI] [PubMed] [Google Scholar]
- O'Brien PJ, Feng CY, Lee O, Rhea M, Bruce J. Fructose-derived endogenous toxins. In: O'Brien PJ, Bruce WR, editors. Endogenous Toxins: targets for disease treatment and prevention. Weinheim: Wiley-VCH; 2010. pp. 173–212. [Google Scholar]
- Fujita Y, Wakabayashi K, Nagao M, Sugimura T. Implication of hydrogen peroxide in the mutagenicity of coffee. Mutat Res. 1985:227–230. doi: 10.1016/0165-7992(85)90055-7. [DOI] [PubMed] [Google Scholar]
- Lee O, Bruce WR, Dong Q, Bruce J, Mehta R. Fructose and carbonyl metabolites as endogenous toxins. Chem Biol Interact. 2009:332–339. doi: 10.1016/j.cbi.2008.10.011. [DOI] [PubMed] [Google Scholar]
- Benov L, Beema AF. Superoxide-dependence of the short chain sugars-induced mutagenesis. Free Radic Biol Med. 2003:429–433. doi: 10.1016/s0891-5849(02)01331-x. [DOI] [PubMed] [Google Scholar]
- Prestwich EG, Dedon PC. Endogenus DNA damage. In: O'Brien PJ, Bruce WR, editors. Endogenous Toxins: targets for disease treatment and prevention. Weinheim: Wiley-VCH; 2010. pp. 5–42. [Google Scholar]
- Bird RP. Observation and quantification of aberrant crypts in the murine colon treated with a colon carcinogen: Preliminary findings. Cancer Lett. 1987:147–151. doi: 10.1016/0304-3835(87)90157-1. [DOI] [PubMed] [Google Scholar]
- Whiteley LO, Hudson L, Jr., Pretlow TP. Aberrant crypt foci in the colonic mucosa of rats treated with a genotoxic and nongenotoxic colon carcinogen. Toxicol Pathol. 1996:681–689. doi: 10.1177/019262339602400602. [DOI] [PubMed] [Google Scholar]
- Roncucci L, Stamp D, Medline A, Cullen JB, Bruce WR. Identification and quantification of aberrant crypt foci and microadenomas in the human colon. Hum Pathol. 1991:287–294. doi: 10.1016/0046-8177(91)90163-j. [DOI] [PubMed] [Google Scholar]
- Bjerknes M, Cheng H. Methods for the isolation of intact epithelium from the mouse intestine. Anat Rec. 1981:565–574. doi: 10.1002/ar.1091990412. [DOI] [PubMed] [Google Scholar]
- Smith PK, Krohn RI, Hermanson GT, Mallia AK, Gartner FH. Measurement of protein using bicinchoninic acid. Anal Biochem. 1985:76–85. doi: 10.1016/0003-2697(85)90442-7. [DOI] [PubMed] [Google Scholar]
- Messner DJ, Sivam G, Kowdley KV. Curcumin reduces the toxic effects of iron loading in rat liver epithelial cells. Liver Int. 2009:63–72. doi: 10.1111/j.1478-3231.2008.01793.x. [DOI] [PMC free article] [PubMed] [Google Scholar]
- Pereira S, Yu WQ, Frigolet ME, Beaudry JL, Shpilberg Y, Park E. Duration of rise in free fatty acids determines salicylate's effect on hepatic insulin sensitivity. J Endocrinol. 2013:31–43. doi: 10.1530/JOE-12-0214. [DOI] [PMC free article] [PubMed] [Google Scholar]
- Yagi K. Simple assay for the level of total lipid peroxides in serum or plasma. Methods Mol Biol. 1998:101–106. doi: 10.1385/0-89603-472-0:101. [DOI] [PubMed] [Google Scholar]
- Shamsi FA, Partal A, Sady C, Glomb MA, Nagaraj RH. Immunological evidence for methylglyoxal-derived modifications in vivo. Determination of antigenic epitopes. J Biol Chem. 1998:6928–6936. doi: 10.1074/jbc.273.12.6928. [DOI] [PubMed] [Google Scholar]
- Femia AP, Giannini A, Fazi M, Tarquini E, Salvadori M. Identification of mucin depleted foci in the human colon. Cancer Prev Res (Phila) 2008:562–567. doi: 10.1158/1940-6207.CAPR-08-0125. [DOI] [PubMed] [Google Scholar]
- Jass JR, Whitehall VLJ, Young J, Leggett BA. Emerging concepts in colorectal neoplasia. Gastroenterology. 2002:862–876. doi: 10.1053/gast.2002.35392. [DOI] [PubMed] [Google Scholar]
- Adler DG, Gostout CJ, Sorbi D, Burgart LJ, Wang L. Endoscopic identification and quantification of aberrant crypt foci in the human colon. Gastrointest Endosc. 2002:657–662. doi: 10.1067/mge.2002.128540. [DOI] [PubMed] [Google Scholar]
- Rudolf RE, Dominitz JA, Lampe JW, Levy L, Qu P. Risk factors for colorectal cancer in relation to number and size of aberrant crypt foci in humans. Cancer Epidemiol Biomarkers Prev. 2005:605–608. doi: 10.1158/1055-9965.EPI-04-0058. [DOI] [PubMed] [Google Scholar]
- Sakai E, Takahashi H, Kato S, Uchiyama T, Hosono K. Investigation of the prevelance and number of aberrant crypt foci associated with human colorectal neoplasm. Cancer Epidemiology Biomarkers Prev. 2011:1918–1924. doi: 10.1158/1055-9965.EPI-11-0104. [DOI] [PubMed] [Google Scholar]
- Anderson JC, Swede H, Rustagi T, Protiva P, Pleau D. Aberrant crypt foci as predictors of colorectal neoplasia on repeat colonoscopy. Cancer Causes Control. 2012:355–361. doi: 10.1007/s10552-011-9884-7. [DOI] [PubMed] [Google Scholar]
- Mutch MG, Schoen RE, Fleshman JW, Rall CJN, Dry S. A multicenter study of prevelance and risk factors for aberrant crypt foci. Clin Gastroent Hepatol. 2009:568–574. doi: 10.1016/j.cgh.2009.01.016. [DOI] [PubMed] [Google Scholar]
- Pinsky PF, Fleshman J, Mutch M, Rall C, Charabaty A. One year recurrence of aberrant crypt foci. Cancer Prev Res. 2010:839–843. doi: 10.1158/1940-6207.CAPR-09-0257. [DOI] [PMC free article] [PubMed] [Google Scholar]
- Shpitz B, Hay K, Medline A, Bruce WR, Bull SB. Natural history of aberrant crypt foci. A surgical approach. Dis Colon Rectum. 1996;39:763–767. doi: 10.1007/BF02054441. [DOI] [PubMed] [Google Scholar]
- Bjerknes M, Cheng H. Colossal crypts bordering colon adenomas in Apc(Min) mice express full-length Apc. Am J Pathol. 1999:1831–1834. doi: 10.1016/S0002-9440(10)65439-9. [DOI] [PMC free article] [PubMed] [Google Scholar]
- Glick SN, Teplick SK, Ross WM. Colonic lymphoid follicles associated with colonic neoplasms. Radiology. 1988:603–607. doi: 10.1148/radiology.168.3.3406391. [DOI] [PubMed] [Google Scholar]
- Shpitz B, Bomstein Y, Mekori Y, Cohen R, Kaufman Z. Aberrant crypt foci in human colons: distribution and histomorphologic characteristics. Hum Pathol. 1998:469–475. doi: 10.1016/s0046-8177(98)90062-4. [DOI] [PubMed] [Google Scholar]
- Hamdani G, Gabet Y, Rachmilewitz D, Karmeli F, Bab I. Dextran sodium sulfate-induced colitis causes rapid bone loss in mice. Bone. 2008:945–950. doi: 10.1016/j.bone.2008.06.018. [DOI] [PubMed] [Google Scholar]
- Pele LC, Thoree V, Mustafa F, He S, Tsaprouni L. Low dietary calcium levels modulate mucosal caspase expression and increase disease activity in mice with dextran sulfate sodium induced colitis. J Nutr. 2007:2475–2480. doi: 10.1093/jn/137.11.2475. [DOI] [PubMed] [Google Scholar]
- Joshi YM, Kwak JC. The binding of divalent metal ions to polyelectrolytes in mixed counterion systems. II. dextransulfate-Mg2+ and dextransulfate-Ca2+ in solutions containing added NaCl or KCl. Biophys Chem. 1981:65–75. doi: 10.1016/0301-4622(81)80026-9. [DOI] [PubMed] [Google Scholar]
- Maki H, Miyajima T. Linear charge density dependence of polyelectrolyte phase volume of ionic dextransulfate as a strong acidic polyion. Macromolecules. 2011:5027–5035. [Google Scholar]
- Okayasu I, Hatakeyama S, Yamada M, Ohkusa T, Inagaki Y, Nakaya R. A novel method in the induction of reliable experimental acute and chronic ulcerative colitis in mice. Gastroenterology. 1990:694–702. doi: 10.1016/0016-5085(90)90290-h. [DOI] [PubMed] [Google Scholar]
- Cooper HS, Murthy SN, Shah RS, Sedergran DJ. Clinicopathologic study of dextran sulfate sodium experimental murine colitis. Lab Invest. 1993:238–249. [PubMed] [Google Scholar]
- Lien YH. Are oral sodium phosphate products for bowel cleansing safe for the general population? Am J Med. 2008:931–932. doi: 10.1016/j.amjmed.2008.07.018. [DOI] [PubMed] [Google Scholar]
- Driman DK, Preiksaitis HG. Colorectal inflammation and increased cell proliferation associated with oral sodium phosphate bowel preparation solution. Hum Pathol. 1998:972–978. doi: 10.1016/s0046-8177(98)90203-9. [DOI] [PubMed] [Google Scholar]
- Vogelstein B, Papadopoulos N, Velculescu VE, Zhou S, Diaz LA. Cancer genome landscapes. Science. 2013:1546–1548. doi: 10.1126/science.1235122. [DOI] [PMC free article] [PubMed] [Google Scholar]
- DaCosta RS, Andersson H, Cirocco M, Marcon NE, Wilson BC. Autofluorescence characterisation of isolated whole crypts and primary cultured human epithelial cells from normal, hyperplastic, and adenomatous colonic mucosa. J Clin Pathol. 2005:766–774. doi: 10.1136/jcp.2004.023804. [DOI] [PMC free article] [PubMed] [Google Scholar]
- Dedon PC, Tannenbaum SR. Reactive nitrogen species in the chemical biology of inflammation. Arch Biochem Biophys. 2004:12–22. doi: 10.1016/j.abb.2003.12.017. [DOI] [PubMed] [Google Scholar]