Abstract
Background The transition of whole-exome and whole-genome sequencing (WES/WGS) from the research setting to routine clinical practice remains challenging.
Objectives With almost no previous research specifically assessing interface designs and functionalities of WES and WGS software tools, the authors set out to ascertain perspectives from healthcare professionals in distinct domains on optimal clinical genomics user interfaces.
Methods A series of semi-scripted focus groups, structured around professional challenges encountered in clinical WES and WGS, were conducted with bioinformaticians (n = 8), clinical geneticists (n = 9), genetic counselors (n = 5), and general physicians (n = 4).
Results Contrary to popular existing system designs, bioinformaticians preferred command line over graphical user interfaces for better software compatibility and customization flexibility. Clinical geneticists and genetic counselors desired an overarching interactive graphical layout to prioritize candidate variants—a “tiered” system where only functionalities relevant to the user domain are made accessible. They favored a system capable of retrieving consistent representations of external genetic information from third-party sources. To streamline collaboration and patient exchanges, the authors identified user requirements toward an automated reporting system capable of summarizing key evidence-based clinical findings among the vast array of technical details.
Conclusions Successful adoption of a clinical WES/WGS system is heavily dependent on its ability to address the diverse necessities and predilections among specialists in distinct healthcare domains. Tailored software interfaces suitable for each group is likely more appropriate than the current popular “one size fits all” generic framework. This study provides interfaces for future intervention studies and software engineering opportunities.
Keywords: exome, decision support systems, clinical, software design, genomics, medical informatics, cognitive science
INTRODUCTION
As the cost of DNA sequencing continues to decrease, whole-exome sequencing (WES) and whole-genome sequencing (WGS) have become important clinical tools for identifying deleterious alleles in Mendelian and complex diseases.1,2 Since its introduction in 2009,3 more than 1980 papers highlighting WES clinical uses have been published (see Supplementary S1 for a brief comparative overview contrasting WES/WGS with other clinical genetic tests). However, the effective realization of moving WES and WGS from research to routine clinical practice remains challenging, in part due to the need for noncomputational clinicians to analyze and interpret the large-scale data in a time efficient manner.4–6 At this early stage, clinical access to WES/WGS analysis occurs principally on a research basis in academic health research centers where informatics teams are available to assist with data analysis.7 As the utility of WES/WGS analysis increases and costs decline, the transition from bench to bedside will require new generations of genome analysis software to empower genetics professionals to perform clinical interpretation.8,9
The prospect of full genome sequencing, compounded by the continual growth in genetic knowledge base, is overwhelming for the healthcare professional; computerization for interpreting and acting on this information is essential for clinician support and ultimately patient care.10 The capacity of software to assist a specialist in reaching a diagnosis (defined as “a contextual, continuous, and evolving process, where data are gathered, interpreted, and evaluated in order to select an evidence-based choice of action”11) is dependent on appropriate design and attaining a high level of usability. Careful evaluations of health information technologies are necessary to ensure sufficient system efficiency, effectiveness, and satisfaction for target users, minimizing workflow interruptions, unnecessary cost, and healthcare errors.12–15 For research-focused WES/WGS analysis, distinct software architectures with different engineering emphasis have been introduced, all ultimately sharing the same goal to assist in the identification of key gene(s)/variant(s). The nature of the analysis process includes 5 steps: (1) read mapping of short DNA sequences onto a reference genome, (2) identification of differences between the sample and reference, (3) quality control of candidate variants (including data visualization methods), (4) annotation of the properties of observed variations, (5) prioritization or filtering variations as candidates for the observed phenotype/disorder (reviewed in7,16). Existing software programs address differing portions of the analysis process, with emphasis tending to fall either on categories 1-2, 3-4 or 5 (example software discussed in Supplementary S1).
Many of the early WES/WGS software packages placed greater emphasis on the computationally oriented users, as clinical use was rare.17,18 In a previous study of a cohort of clinical geneticists, we evaluated the usability of exome analysis software based on think-aloud protocols in a study where participants were presented with simulated clinical cases to analyze.19 While our results highlighted deficiencies of the software for clinical geneticists, such users rarely work in isolation. An interdisciplinary team comprising of informaticians, clinical/biochemical geneticists, subspecialist pediatricians, laboratory scientists, and genetic counselors are often involved. This is exemplified by 2 programs at the National Institutes of Health (Clinical Sequencing Exploratory Research and Clinical Center Genomics Opportunity), seeking to bring together clinicians, genomic researchers, bioinformaticians, and ethicists to tackle challenges in WES/WGS analysis.20,21 Despite the expectation of the groups working together, presumably through a shared computational framework, the diversity of perspectives, and preferences regarding software design remains undetermined. As the community moves to adoption of WES/WGS as a standard clinical test, it is unclear if the design of analysis software needs to be tailored to domain-specific users.
As far as we are aware, this work represents the first research looking at cognitive insights between distinct domains of medical professionals that most closely interact with genomic data. We surveyed three major groups of specialists that most closely interact with genomic data at the patient-oriented level: data-intensive informatics specialists (a newly emerging clinical role), clinical geneticists, and genetic counselors. In this report, we specifically addressed 3 key research questions:
Are there major cognitive differences and patterns among different user groups?;
What do the optimal designs envisioned by informaticians, clinical biochemists, and genetic counselors look like?3) How do the designs desired by the different user groups compare with existing designs?
Bearing in mind of the broad range of clinical applications of genomic data, we focus our research questions primarily in the context of difficult to diagnose germline rare diseases, or diseases with suspected genetic etiology. Through narrative discussions and digital prototypes, we revealed major patterns that distinguish between classes of specialists. We identified properties perceived by users to play a critical role in determining efficacy and efficiency of an analysis software. The results of the study will inform clinical interface design as WES/WGS move into the mainstream.
METHODS
Setting
All focus groups were conducted in the Child and Family Research Institute at BC Children’s Hospital in Vancouver, Canada. Sessions were conducted within a conference room with a round table, chairs, a white board with markers, a video recorder (a mounted Sony HandyCam High definition camcorder (HDR)-SR1 + ECM-HW1R Wireless Microphone), and a digital projector connected to a Macbook Pro laptop.
Recruitment
Participants were recruited from across various institutions located within the greater Vancouver region. Twenty-six individuals from 4 different healthcare professions were recruited; each individual was categorized into 1 of the 4 user classes: bioinformatician, clinical geneticist, genetic counselor, and nonspecialist physician (see Supplementary S2). The first 3 user groups represent the current healthcare professionals that most closely interact with patient genomic data for clinical decision-making in precision medicine (we define precision medicine as “the ability to tailor diagnostic and treatment decisions for individual patients,” see8). The last group (general physicians) represents the baseline within clinicians that do not have experience working with genomic data.
Focus groups assignment
Each homogenous focus group consisted of participants from the same professional category, and group sizes ranged from 4 to 5. There was no overlap between the group assignments such that each individual participated only once in a focus group. The participants for each group were randomly assigned. The focus groups were conducted in 2 rounds: 6 first-round sessions took place between February and June of 2014, and 6 second-round sessions took place between September and October of 2014.
Focus group structure
Participants filled out a demographic survey and consented by signing a project participation form at the beginning of each focus group session. Each focus group lasted between 90 and 120 min. The sessions were audio-recorded in their entirety and drawings made by participants on a whiteboard were digitally captured. Key matters that were repeatedly referred to in the focus groups were typed on a laptop by the moderator (Casper Shyr (CS)) and projected on a big screen via a projector. Throughout the session, participants had access to drinks and snacks.
The structure of the focus groups was built around the various processing stages of patient exome data (e.g., generation of alignment and variant calls, data annotation and visualization, variant/gene prioritizations). To guide the flow, many of the questions were structured around a hypothetical scenario involving a patient suffering from an undiagnosed rare metabolic disorder (see Supplementary S12 for discussion of study limitations), but participants were encouraged to think and discuss beyond the scenario. Some parts of the focus groups were scripted to raise issues including examining data quality and screening for technical and/or biological abnormalities, filtering exome variant calls at the genetic level, prioritizing mutations at the gene level, and smoothing out the technical challenges when collaborating across multiple researchers, and sharing the clinical findings with patients (see Supplementary S3 for more details).
Analysis
Focus group transcripts were generated from recordings and notes and coded in Microsoft Word. Content analysis was conducted to describe participants’ views and perspectives on WES/WGS data.22,23 A set of initial codes was formulated based on the research questions and prior studies.19,24–26 Additional emergent themes and codes were identified from the data using an inductive approach.27–29 The whiteboard drawings were analyzed from the video footages, and were digitally translated using GUI Design Studio Version 4.6. Themes and sub-themes identified from the coded transcripts were used to highlight key features on the digital prototypes. Findings were summarized through tables, figures, and narrative discussion.
Approvals
This study was approved by the University of British Columbia Behavioural Research Ethics Board (H13-02034).
RESULTS
1. User groups demonstrate dissimilar focus in the analysis pipeline
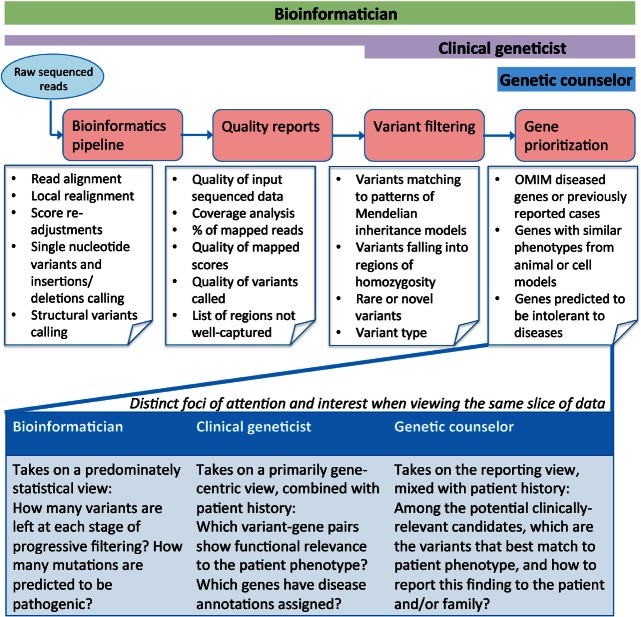
The diverse WES/WGS analysis software tends to emphasize specific points in the analysis pipeline, in a package specific manner. We sought to understand whether the focal point of the software packages tends to reflect distinct user community desires. To ascertain preferential starting points in WES/WGS analysis, participants were asked to choose between working with raw unaligned sequenced reads, or to work with variants called with an external informatics pipeline. These 2 choices represent typical options offered by sequencing centers and commercial companies.30,31 The preferences from each participant were immediately reflective of the domain they represented, and it was apparent that the same genomic data were treated differently by each of the 3 user classes (Figure 1).
Figure 1:
Beginning with raw sequenced reads, the exome analysis pipeline can be conceptualized into 4 distinct compartments: generation of alignments and variant calls, assessment of data quality, filtering of variants based on genetic models, and prioritization of genes based upon biological functions. The details of the components are annotated largely in the context of genetic diagnosis for rare/complex disorders (refer to Supplementary S12 for discussion on other clinical uses of genomic data). The bars above represent the intensity of user engagement at each step. Bioinformaticians preferred to be involved in every step, with equal attention devoted to all compartments. Clinical geneticist, despite placing heavier emphasis on the final 2 stages, indicated they would ideally like to be involved in every step too, but they faced difficulties in carrying out the first and second steps (e.g., pipeline execution and quality assessment), which may be attributed to software usability. Genetic counselors (and general physicians, not shown) indicated they would focus on the final output of candidate variants, to which they could apply their domain knowledge to select clinically relevant genes. The text in the lower portion of the figure highlights how the same step in the informatics pipeline (e.g., variant data) can be viewed differently across domain experts.
Bioinformaticians desired to start with raw sequence data, but also indicated that having access to both raw data and externally provided variant lists would be ideal:
“I prefer to work with raw sequence data because it gives me greater flexibility. If I don’t see any interesting candidate from my output, I can re-analyze the data using different thresholds, or try a different genome aligner, or a different variant caller. Having the variant calls is a bonus—I can go to the variants right away while the pipeline is still processing raw reads. This is especially important when I have multiple whole genomes where the processing time is expected to be long.” [Bioinformatician 02]
“Ideally I would like to have both [raw data and variant data]. But having the raw sequence data means I can go back and re-do the analysis as future algorithms improve, or as genome annotations get updated…or if I need to investigate other types of genetic variations like large structural inversions or deletions or duplications.” [Bioinformatician 05]
Similarly, clinical geneticists preferred both raw sequence data and variant calls, but with a stronger partiality for working with variant calls over raw reads because they believed working with the already aligned and annotated data gave them a better chance to identify clear causal variants quickly.
“If we are dealing with a recessive disorder, then mosaicism and de novo dominant models are less of a concern. I do not have to worry about twiddling different variant quality scores that is often so important when searching for bona fide heterozygous mutations.” [Clinical geneticist 05]
“Starting with only the variant data generally means that the data I am given has already been filtered by some kind of threshold so I am restricted to play within the limit of that threshold. I have yet to find a user-friendly interface that would allow a non-computer savvy clinician such as myself to process an exome data from beginning to end. For now, I am limited to getting only the final sorted list from the bioinformaticians.” [Clinical geneticist 03]
Genetic counselors and general physicians expressed no desire for raw sequences, indicating that they did not consider it as part of their professional role (Supplementary S4). There were also differences on the preferred file formats between bioinformaticians vs the geneticists and counselors (Supplementary S5).
2. Separate interfaces required for data quality assessment
A. Desired statistics
Participants were asked to discuss issues regarding quality examination of WES/WGS dataset(s).
Genetic counselors and general physicians stated this entire topic was of no relevance to their line of work.
“I don’t think it is up to me to inspect data quality. I don’t even know where to begin! That is not what I am trained to do. When I receive the data, I expect it to have already been quality-checked.” [Genetic counselor 02]
There was a strong overlap between the bioinformaticians and clinical geneticists when commenting on the quality measures desired, and some mentioned quality measurements are not commonly available in current toolkits (Supplementary S6). Both user groups wanted to see a list of genes (or sub-segments of genes) whose exomes were not sufficiently covered, to compare against a list of genes relevant to their study.
“It is important for me to know what genes are included in a capture kit so if there is an insufficient coverage for a set of genes, I can decide if simply re-sequencing the data with the same platform would guarantee more reads at those locations, or if I need to explore alternatives like whole genome sequencing.” [Bioinformatician 02]
“I want to know what genes are not sufficiently covered in my exome because currently, all that is given to me is a list of variants. From that list, if I don’t see any mutations in those genes, I would be mistaken to think those genes are normal when they could be not.” [Clinical geneticist 04]
B. Visual presentation
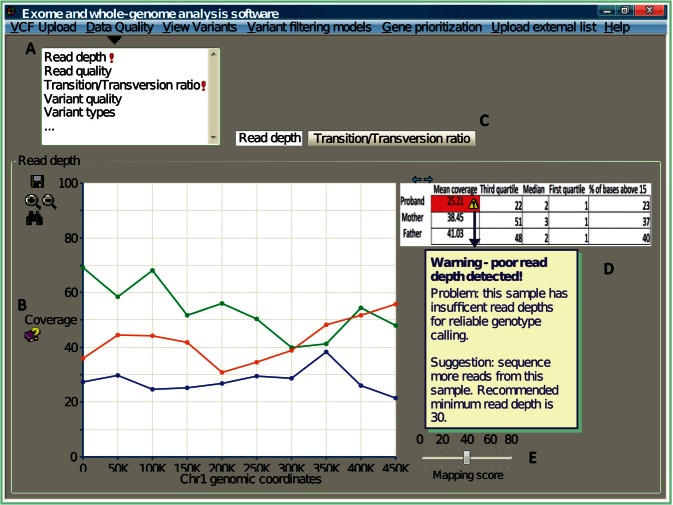
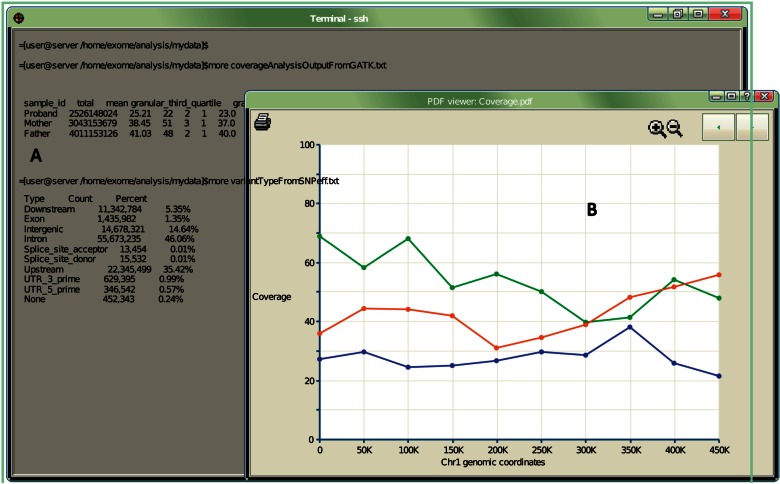
While the desired metrics and functionalities overlapped highly between the bioinformaticians and clinical geneticists, the preferred methods of presentation differed between them. Figures 2 and 3 outline the key differences.
Figure 2:
A graphical representation of key features desired by clinical geneticists for inspection of data quality. (A) Measurements associated with data quality should be grouped together into a common theme (e.g., a drop-down panel). Quality scores deviating from the norm should be automatically highlighted (e.g., exclamation mark). (B) Computational jargon (e.g., coverage) need to be appropriately explained to a noncomputational user. (C) Details on different quality measurements should be displayed separately, but still contained within the same user interface. The example here uses tabs to access different perspective views. (D) Data are best represented both visually (e.g., as a graph) and numerically (e.g., summarized in tabulated form). Simply presenting the quality metrics is not sufficient; software must further describe the nature of the problem, and provide recommendations. (E) The user needs flexibility to explore the distribution of quality scores, and visualize how different thresholds impact the data results. Here, a bar representing the mapping threshold is introduced for the user to dynamically adjust, and the expectation is the interface will update the coverage accordingly.
Figure 3:
A graphical representation of key features desired by bioinformaticians. (A) Terminal interface is the most utilized environment, as it connects with many other command-line software and scripts. Tabulated data quality summaries are displayed directly on the terminal. (B) Graphical summaries are also desired, but no intensive graphical user interface app is needed, as bioinformatics users tend to prefer features already available via the terminal display.
3. Filtrations and prioritizations
A. Variant-level filtration
For genetic counselors and general physicians, there were few comments about filtering at the variant level. When the data reached their hands, they expected it to have been filtered based on specified genetic model(s) and allelic frequencies, allowing them to focus on prioritizing candidate genes.
We found a set of filters selected by both bioinformaticians and clinical geneticists, the majority commonly cited in the exome literature (e.g., sort alleles by allelic frequencies, mutation type, and impact prediction.32,33). The variants were preferred to be displayed within a table or spreadsheet—a design that is already implemented in many exome analysis systems.
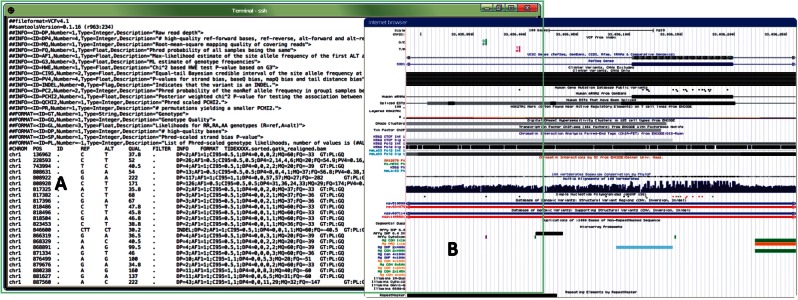
In accordance with how they inspected data quality, bioinformaticians preferred to prioritize variants within the terminal interface (Figure 4). Bioinformaticians also displayed the largest diversity in terms of what is desired about each variant (examples discussed in Supplementary S7). The diversity in which bioinformaticians interact with WES/WGS data likely explains why they preferred to work with a command-line rather than to be limited to a graphical tool where the functionalities are by nature more constrained and less flexible to be tailored to context-specific needs.
Figure 4:
A graphical representation of the key features desired by bioinformaticians when visualizing/filtering variant sets. (A) Analyzing variants within a terminal environment by informaticians allows manipulation of the variant files via custom scripts and/or external command-line programs. (B) Variants are preferred to be visualized within a genome browser (e.g., University of California, Santa Cruz (UCSC) Genome Browser73) where genomic neighborhood landmarks and any additional relevant biological information (e.g., SNPs, conservation) can be displayed alongside.
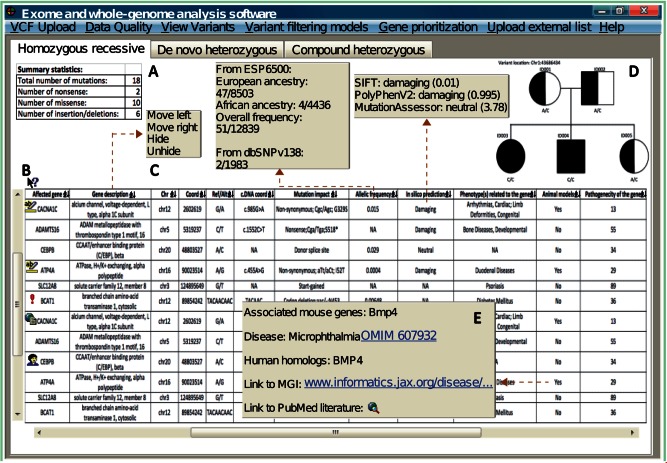
In contrast, clinical geneticists preferred a graphical user interface that is highly dynamic and user-interactive (Figure 5). Microsoft Excel spreadsheets were the prevalent choice of clinical geneticists and genetic counselors for viewing variant lists, despite acknowledging it as not being optimized for the purpose.
“The problem with Excel is it starts crashing when I try to feed in more than 65,000 rows of mutation, and that’s just with an exome.” [Clinical geneticist 01]
Figure 5:
A graphical representation of the key features desired by clinical geneticists when performing variant visualization/analysis. Brown dotted arrows point to additional information from specific columns that is available when clicked upon. For instance, clicking the “mutation impact” column would reveal different impact predictions by mainstream prediction software and shows the level of congruency across multiple algorithms. (A) Classical Mendelian models should be built into the system with tabulated summaries automatically available. Outputs from each Mendelian model should be available under separate layouts (e.g., navigated by tabs). (B) Software should provide a quick explanation about the information contained within each column and how to interpret it. (C) The variant table needs to be ranked by evidence (e.g., clinically interesting variants appear at the top of the list). Variants with obvious pathogenic associations need to be automatically highlighted (e.g., flashing red notice). Aside from automated cues, clinical users wanted capabilities to highlight variants that were perceived to be of high interest, to store personal comments for specific variants (e.g., update if a variant is confirmed by Sanger sequencing), or to upload a scientific article related to a particular gene. (D) An integrated pedigree to visualize how the variants are segregated across a given set of related exomes, and automatically update the genotypes as users browse across different variants. (E) Hyperlinks that link to external databases should be discouraged. Geneticists complained that the current state of the software relies too much on external references where cross-referencing between different resources on separate interfaces is very distracting. Instead, key clinically relevant information (e.g., the phenotype of a gene knock-out experiment from animal model column) should be computationally compiled and presented within one interface, and only the technical details (e.g., how the experiment was performed) are directed to external sites.
B. Gene-level prioritization:
This section discusses the desired prioritization strategies and executions for clinical exomes at the genic level (rather than variant level).
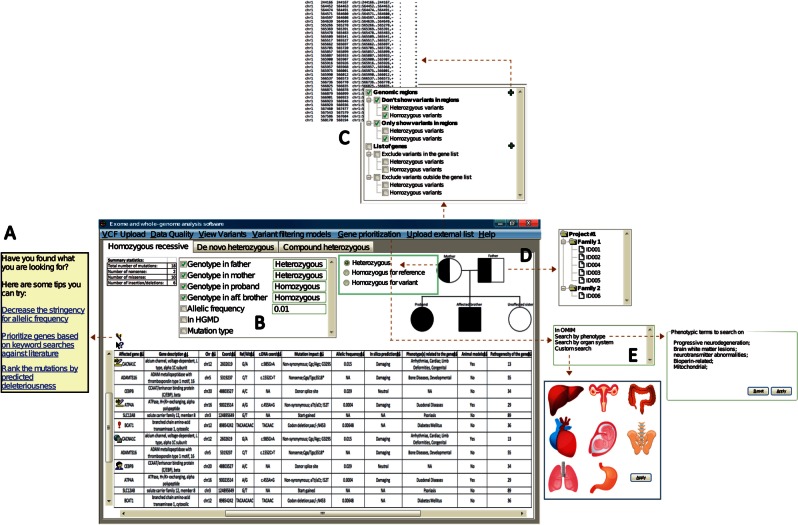
All user groups emphasized a desire for informatics algorithms that conduct automated literature mining or pathway analysis (the overview of such algorithms are introduced in Supplementary S8). The core difference between the user groups is that bioinformaticians wanted such analysis to be integrated with the rest of their command-line based pipeline, while noncomputational users wished this functionality to be accessed graphically (Figure 6).
Figure 6:
A graphical representation of the key features desired by clinical geneticists for genetic and genic prioritizations. (A) When the user fails to identify any variants of clinical interest, software should provide recommendations on alternative strategies based on what the user has already explored. (B) The software should provide easy tracking of the filters currently applied and allow quick adjustments (in this case, via checkboxes to turn a filter on/off). (C) Software should allow incorporation of external files containing either genomic coordinates or list of genes to filter against variant set. (D) Software with an embedded dynamic pedigree would allow clinicians to graphically upload multiple exomes (e.g., trio) and assign family memberships via the pedigree. Custom inheritance models could also be setup via the pedigree by specifying expected genotype in a given model. (E) Ability to import free-text clinical descriptors, or access terms from a defined ontology (e.g., Human Phenotype Ontology) against which to filter for genes/variants that relate to the specified descriptions. Alternatively, a novel feature emerging from focus groups was the ability to prioritize based on organ systems.
Clinicians emphasized that while there are tools that offer online software applications to obtain candidate genes based upon keyword queries (e.g., MeSHOP,34 Genie,35 Ingenuity [http://www.ingenuity.com]), these capabilities are not consistently accessible to integrated WES/WGS analysis software and the output cannot be combined with exome data without additional manipulation. Expanding beyond keywords as input, clinicians further requested graphical search functionalities. One such request is the ability to filter by organ system visually where the user can click on the organ/system of interest in an anatomy diagram (Figure 6). Finally, the clinicians expressed frustration that many gene-ranking software failed to provide the primary literature when returning the results (or it was difficult to retrieve that literature).
“When the program predicts this gene to be related to this particular disease, I want to know how accurate it is. And not just from some kind of confidence score, but I want to see the primary literature. For instance, if the strength of association is based on GWAS literature, then I’m probably not going to treat it seriously.” [Clinical geneticist 08]
4. Data sharing with collaborators and patients
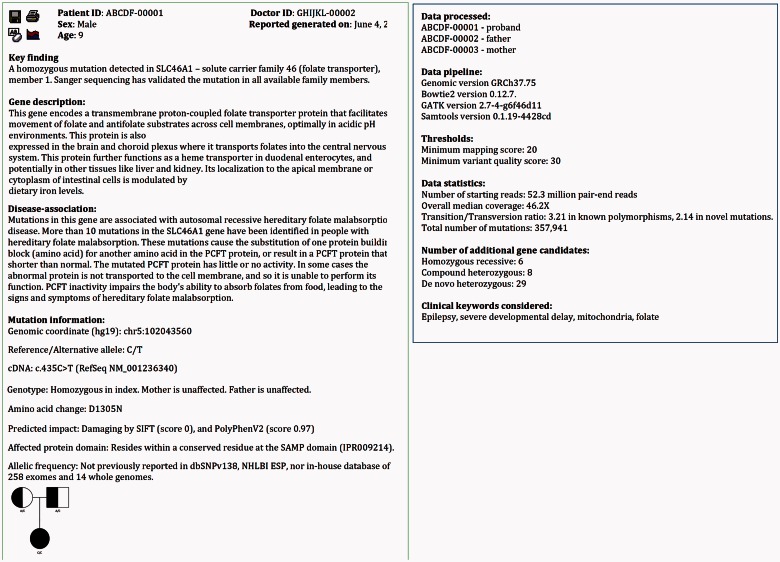
A key bottleneck to routine clinical exome analysis was identified to be the preparation of clinical reports for inclusion in medical records and delivery to other physicians. Reports should be concise and automated as much as possible including only clinical information that can be directly extracted from exome data or external databases. Figure 7 illustrates an example report separating the clinical genetic findings from technical summaries. Additionally, to streamline exchanges with patients, clinicians wanted the ability to flag genes that have been disclosed by the patients as a set they do not need to be notified about.
Figure 7:
An example of automated clinical reporting summarizing the clinical findings from WES/WGS. (A) The system should allow clinicians to save, edit text, and insert custom images to the report. The report is designed to be a skeleton for clinicians to build on. (B) Key genetic findings related to the clinical phenotype should be stated right on the front page. These include known clinical relevance about the mutated gene (e.g., what is the biological role of the gene, what phenotype does a person exhibit when the gene is mutated) (C), the type and nature of the mutation (e.g., what is the genomic and transcript coordinate of the mutation, what type of mutation is it, has the mutation been previously reported in clinical literature, what is the allelic frequency, and how is it transmitted across the given family) (D and E) All other information not directly related to the key finding (e.g., the thresholds used by the bioinformatics pipeline that generated the dataset) should be discussed in subsequent pages.
DISCUSSION
Next-generation WES/WGS sequencing is revolutionizing the study of genetic disorders, with considerable potential for successful application in clinical practice. With large-scale sequencing projects like ClinSeq36 and Exome Aggregation Consortium (http://exac.broadinstitute.org), and collaborative efforts of sequencing consortiums (e.g., Global Alliance for Genomics and Health, http://genomicsandhealth.org) under way, the global community is in the midst of a multi-year process that will ultimately transition WES/WGS from research labs to clinical labs.37–39 Despite the continuous flow of new software to assist in the translation process, WES/WGS analysis software for clinical genetic diagnosis is not yet in widespread use.5,40 As bioinformaticians have been key processors of WES/WGS sequences in the research setting, they are starting to migrate into emerging clinical laboratory roles. The nature of an interdisciplinary healthcare team necessitates that the software systems and interfaces accommodate the greater diversity of participants to ensure the usability of health information and to provide the requisite utility to diverse clinical users.41,42
This report initiates the comparative study of cognitive patterns between healthcare professionals that closely interact with genomic data from multiple domains. Excluding the general physicians included in this study as a control group, the specialist groups represent the three classes of healthcare professionals that currently most closely interact with patient genomic data at the clinical level. While previous focus groups have studied preferences within a general population for results delivery from WES/WGS,43,44 in this study, we interviewed bioinformaticians, clinical geneticists, genetic counselors, and general physicians to study how domain knowledge influences the cognitive patterns for the analysis of WES/WGS data, and the consequent meaning for software design.
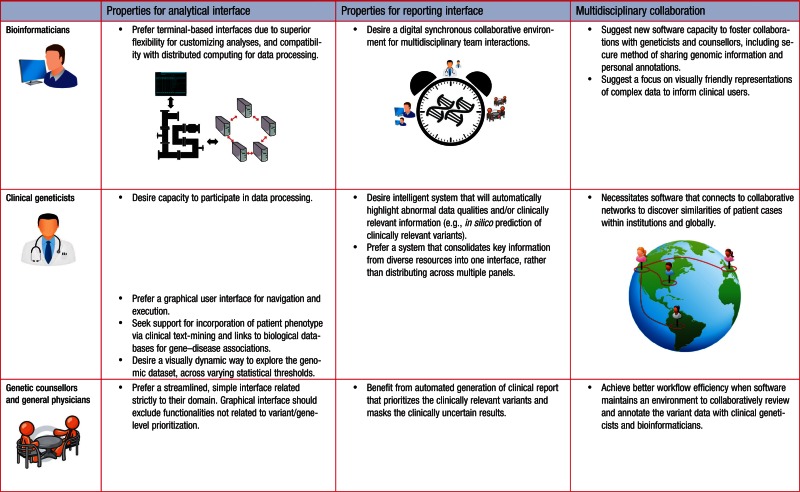
Through a series of scenario-driven focus groups, we found that despite a common goal, the discovery of a causal candidate variant/gene, the user groups exhibit clear differences, and divergent patterns among user behaviors. Table 1 summarizes and distinguishes the software requirements from each user group.
Table 1:
An overall summary of the desired software features and design architectures across bioinformaticians, clinical geneticists, genetic counselors, and physicians.
 |
It is our interpretation that no single interface will adequately address the needs of all users, necessitating the capacity of future WES/WGS systems to provide interface options to best meet the needs and expectations of the diverse users. The existing academic and commercial software (Supplementary S1) places emphasis upon graphical user interface that are viewed by bioinformaticians as too rigid and not customizable for distributed network analysis. While some tools may be designed to create user-friendly workflows, the lack of design-focus on clinical target users (i.e., geneticists and genetic counselors) impedes their adoption in clinical settings (Supplementary S1). The importance of user-centric themes is consistent with emerging models of care and medical decision-making support systems, such as observed for breast cancer diagnosis and management,45,46 early recognition of sepsis,47 antibiotics prescriptions,48,49 and interpretation of medical images50,51 where extensive evaluations on physicians’ and nurses’ interactions in work practices reveal similar concepts surrounding issues of sharing information across collaborative settings, and tensions between integration and standardization.
Given the complexities involved, software which attempts to address all possible tasks that arise in clinical genomics is less likely to be incorporated into practice than software specific to exome/whole-genome analytical tasks. To be successful, a medical decision support system should be compatible to an existing clinical workflow,52,53 and actionable outputs intelligently filtered and presented at appropriate times.54,55 In WES/WGS, we found this workflow scope includes a system’s capacity to incorporate clinical keywords and genetic hypotheses pertinent to each unique patient (also cited in Luo and Liang 201456 and Masino et al. 20145 7), and results delivered at specific workflow stages with respect to the disparate foci of counselors, physicians, geneticists, and bioinformaticians (e.g., Figure 1). Clinical geneticists expressed desire for an encompassing graphical design that gives them more control over the technical aspects of the pipeline, integrating genomic information with patient history but at the same time removes them from the realm of scripting and the command-line. Meanwhile, genetic counselors (and general physicians) wished to solely focus on gene prioritization and efficient delivery of final results without distraction by functionalities irrelevant to their work processes. The results highlight a need for systems to facilitate the generation of clinical reports, including the appropriate distribution of technical vs clinical details, sharing of notes between clinical staff about specific variants, overview of genes not covered by WES, and the family structure. The format of the prioritized report (Figure 7) mirrors the precedent of prioritized information in other modes of clinical reports, e.g., a radiologist’s X-ray report separating clinical impressions from descriptive details of radiographic appearance of specific organs.58
Strong community observations should be noted by system developers. Our study confirms that an ultimate clinical WES/WGS systems will need to be well connected to online resources, such as animal model phenotypes,59,60 biological system annotations,61,62 and disease-focused databases.63–65 This is concordant with earlier work that demonstrated the importance of rich access to external resources and databases.19,66,67 The integration of metadata and diverse biological annotations to patient electronic health records will require strict compliance to standards (examples discussed in Supplementary S11). Our study further highlighted the need to integrate access within a single system, sparing users from mastering diverse interfaces.
Our results suggest future software should provide separate interfaces for each target user group. One can envision “purpose-driven” interface options, allowing users to focus on the aspect of the analysis and interpretation relevant to their duties. While the tailored software is fitted to individual domains, it must at the same time facilitate collaboration, as increasingly diverse expertise is key requirement for WES/WGS interpretation. The informatics specialists may be charged with reporting on data linking candidate genes to specific biological processes, clinical geneticists will evaluate specific mutations for a causal role in disease/phenotype, and genetic counselors will indicate the variations that need to be conveyed. These activities are interactive and may require cycles of expert attention. Insights to overcome socio-technical challenges can be drawn from research in Computer-Supported Cooperative Work,68 including themes surrounding information credibility,69 coping with narrative and numeric data,70 scalable methods for managing increasingly large datasets,71 and caution surrounding interpretation of automated systems72 (discussed further in Supplementary S10). As WES/WGS analysis software matures, it will empower clinicians with more automated procedures, which we anticipate will decrease dependency on bioinformaticians for data processing. These experts will continue to be closely involved, developing and applying new approaches for the discovery and interpretation of additional genetic alterations. Advances over the coming years will result in new requirements for collaborative interactions, for instance, as the current focus on alterations in protein coding sequences expands to include regulatory sequence alterations. Expansion of the cooperative capacity of the software will assist the diverse users as the field matures.
CONCLUSIONS
As high-throughput WES/WGS technologies continue to mature, healthcare providers need efficient software to facilitate interpretation for clinical decision-making. By conducting multiple focus groups of diverse healthcare classes active in clinical genetics, our present study reveals there are distinct types of WES/WGS analysis needs for different classes of domain specialists. The results presented illustrate the cognitive processes and tentative designs envisioned by the range of clinical professionals key to the process. A natural follow-up for future work is to implement the features into a prototype software package and conduct intervention trials to evaluate effectiveness and performance within clinic sites.
LIMITATIONS
The limitations to this study are discussed in Supplementary S12.
CONTRIBUTORS
C.S., A.K., and W.W.W. designed the study. C.S. carried out the experiment and data analysis. A.K. and W.W.W. assisted with the data analysis. C.V.K. assisted with the experiment setup. C.S. wrote the manuscript. All authors read, edited, and approved the final manuscript.
FUNDING
This work was supported by Canadian Institutes of Health Research grant number MOP-82875, Natural Sciences and Engineering Research Council of Canada grant number RGPIN355532-10, Omics2TreatID, and Genome Canada/Genome BC 174DE (ABC4DE project).
COMPETING INTERESTS
The authors have no competing interests to declare.
Acknowledgments
We are indebted to all the participants who took part in this study. We especially thank the Treatable Intellectual Disability Endeavor in B.C. (TIDEX) (www.tidebc.org) team for supplying the data and advising on various aspects of clinical DNA sequencing analysis. We thank the entire Wasserman laboratory, particularly Cynthia Ye, Maja Tarailo-Graovac, and Jessica Lee for manuscript feedback. Special thanks to Dr Jehannine Austin for assistance in recruiting study participants, and to Michael Hockertz for supplying video recording equipment. Icons and graphic arts incorporated into the figures and tables are modified from open repositories freely available for academic use.
SUPPLEMENTARY MATERIAL
Supplementary material is available online at http://jamia.oxfordjournals.org/.
REFERENCES
- 1.Flintoft L. Clinical genetics: exomes in the clinic. Nat Rev Genet. 2013;14(12):824. [DOI] [PubMed] [Google Scholar]
- 2.Xuan J, Yu Y, Qing T, Guo L, Shi L. Next-generation sequencing in the clinic: promises and challenges. Cancer Lett. 2013;340(2):284–295. [DOI] [PMC free article] [PubMed] [Google Scholar]
- 3.Choi M, Scholl UI, Ji W, et al. Genetic diagnosis by whole exome capture and massively parallel DNA sequencing. Proc Natl Acad Sci U S A 2009;106(45):19096–19101. [DOI] [PMC free article] [PubMed] [Google Scholar]
- 4.Lecroq T, Soualmia LF. Managing large-scale genomic datasets and translation into clinical practice. Yearb Med Inform. 2014;9(1):212–214. [DOI] [PMC free article] [PubMed] [Google Scholar]
- 5.Henderson GE, Wolf SM, Kuczynski KJ, et al. The challenge of informed consent and return of results in translational genomics: empirical analysis and recommendations. J Law, Med Ethics. 2014;42(3):344–355. [DOI] [PMC free article] [PubMed] [Google Scholar]
- 6.Coiera E, Lau AY, Tsafnat G, Sintchenko V, Magrabi F. The changing nature of clinical decision support systems: a focus on consumers, genomics, public health and decision safety. Yearbook Med Inform. 2009;2009(1):84–95. [PubMed] [Google Scholar]
- 7.Bao R, Huang L, Andrade J, et al. Review of current methods, applications, and data management for the bioinformatics analysis of whole exome sequencing. Cancer Inform. 2014;13(Suppl 2):67–82. [DOI] [PMC free article] [PubMed] [Google Scholar]
- 8.Huser V, Sincan M, Cimino JJ. Developing genomic knowledge bases and databases to support clinical management: current perspectives. Pharmacogenomics Pers Med. 2014;7:275–283. [DOI] [PMC free article] [PubMed] [Google Scholar]
- 9.Evers AW, Rovers MM, Kremer JA, et al. An integrated framework of personalized medicine: from individual genomes to participatory health care. Croat Med J. 2012;53(4):301–303. [DOI] [PMC free article] [PubMed] [Google Scholar]
- 10.Welch BM, Kawamoto K. Clinical decision support for genetically guided personalized medicine: a systematic review. JAMIA 2013;20(2):388–400. [DOI] [PMC free article] [PubMed] [Google Scholar]
- 11.Tiffen J, Corbridge SJ, Slimmer L. Enhancing clinical decision making: development of a contiguous definition and conceptual framework. J Prof Nurs. 2014;30(5):399–405. [DOI] [PubMed] [Google Scholar]
- 12.Abugessaisa I, Saevarsdottir S, Tsipras G, et al. Accelerating translational research by clinically driven development of an informatics platform–a case study. PLoS One 2014;9(9):e104382. [DOI] [PMC free article] [PubMed] [Google Scholar]
- 13.Moja L, Liberati EG, Galuppo L, et al. Barriers and facilitators to the uptake of computerized clinical decision support systems in specialty hospitals: protocol for a qualitative cross-sectional study. Implement Sci. 2014;9:105. [DOI] [PMC free article] [PubMed] [Google Scholar]
- 14.Devine EB, Lee CJ, Overby CL, et al. Usability evaluation of pharmacogenomics clinical decision support aids and clinical knowledge resources in a computerized provider order entry system: a mixed methods approach. Int J Med Inform. 2014;83(7):473–483. [DOI] [PMC free article] [PubMed] [Google Scholar]
- 15.Thyvalikakath TP, Dziabiak MP, Johnson R, et al. Advancing cognitive engineering methods to support user interface design for electronic health records. Int J Med Inform. 2014;83(4):292–302. [DOI] [PMC free article] [PubMed] [Google Scholar]
- 16.Biesecker LG, Green RC. Diagnostic clinical genome and exome sequencing. New Engl J Med. 2014;371(12):1170. [DOI] [PubMed] [Google Scholar]
- 17.Yen PY, Bakken S. Review of health information technology usability study methodologies. JAMIA. 2012;19(3):413–422. [DOI] [PMC free article] [PubMed] [Google Scholar]
- 18.Pabinger S, Dander A, Fischer M, et al. A survey of tools for variant analysis of next-generation genome sequencing data. Brief Bioinform. 2014;15(2):256–278. [DOI] [PMC free article] [PubMed] [Google Scholar]
- 19.Shyr C, Kushniruk A, Wasserman WW. Usability study of clinical exome analysis software: top lessons learned and recommendations. J Biomed Inform. 2014;51:129–136. [DOI] [PubMed] [Google Scholar]
- 20.Gray SW, Martins Y, Feuerman LZ, et al. Social and behavioral research in genomic sequencing: approaches from the Clinical Sequencing Exploratory Research Consortium Outcomes and Measures Working Group. Genet Med. 2014;16(10):727–735. [DOI] [PMC free article] [PubMed] [Google Scholar]
- 21.Dewey FE, Grove ME, Pan C, et al. Clinical interpretation and implications of whole-genome sequencing. JAMA. 2014;311(10):1035–1045. [DOI] [PMC free article] [PubMed] [Google Scholar]
- 22.Denzin NK, Lincoln YS. The Sage Handbook of Qualitative Research, 4th edn Thousand Oaks, CA: Sage; 2011. [Google Scholar]
- 23.Crabtree BF, Miller WL. Doing Qualitative Research, 2nd edn Thousand Oaks, CA: Sage Publications; 1999. [Google Scholar]
- 24.Kushniruk A. Evaluation in the design of health information systems: application of approaches emerging from usability engineering. Comput Biol Med. 2002;32(3):141–149. [DOI] [PubMed] [Google Scholar]
- 25.Kushniruk AW, Patel VL, Cimino JJ. Usability testing in medical informatics: cognitive approaches to evaluation of information systems and user interfaces. Proceedings: a conference of the American Medical Informatics Association/AMIA Annual Fall Symposium AMIA Fall Symposium 1997:218–222. [PMC free article] [PubMed] [Google Scholar]
- 26.Daniels J, Fels S, Kushniruk A, Lim J, Ansermino JM. A framework for evaluating usability of clinical monitoring technology. J Clin Monitor Comput. 2007;21(5):323–330. [DOI] [PubMed] [Google Scholar]
- 27.Morgan DL. Qualitative content analysis: a guide to paths not taken. Qual Health Res. 1993;3(1):112–121. [DOI] [PubMed] [Google Scholar]
- 28.Vaismoradi M, Turunen H, Bondas T. Content analysis and thematic analysis: implications for conducting a qualitative descriptive study. Nurs Health Sci. 2013;15(3):398–405. [DOI] [PubMed] [Google Scholar]
- 29.Moretti F, van Vliet L, Bensing J, et al. A standardized approach to qualitative content analysis of focus group discussions from different countries. Patient Educ Couns. 2011;82(3):420–428. [DOI] [PubMed] [Google Scholar]
- 30.Oliver GR, Hart SN, Klee EW. Bioinformatics for clinical next generation sequencing. Clin Chem. 2015;61(1):124–135. [DOI] [PubMed] [Google Scholar]
- 31.Glusman G, Cox HC, Roach JC. Whole-genome haplotyping approaches and genomic medicine. Genome Med. 2014;6(9):73. [DOI] [PMC free article] [PubMed] [Google Scholar]
- 32.Carson AR, Smith EN, Matsui H, et al. Effective filtering strategies to improve data quality from population-based whole exome sequencing studies. BMC Bioinformatics. 2014;15:125. [DOI] [PMC free article] [PubMed] [Google Scholar]
- 33.Maranhao B, Biswas P, Duncan JL, et al. exomeSuite: whole exome sequence variant filtering tool for rapid identification of putative disease causing SNVs/indels. Genomics. 2014;103(2-3):169–176. [DOI] [PMC free article] [PubMed] [Google Scholar]
- 34.Cheung WA, Ouellette BF, Wasserman WW. Compensating for literature annotation bias when predicting novel drug-disease relationships through Medical Subject Heading Over-representation Profile (MeSHOP) similarity. BMC Med Genomics. 2013;6 (Suppl 2):S3. [DOI] [PMC free article] [PubMed] [Google Scholar]
- 35.Fontaine JF, Priller F, Barbosa-Silva A, Andrade-Navarro MA. Genie: literature-based gene prioritization at multi genomic scale. Nucleic Acids Res. 2011;39(Web Server issue):W455–W461. [DOI] [PMC free article] [PubMed] [Google Scholar]
- 36.Biesecker LG, Mullikin JC, Facio FM, et al. The ClinSeq Project: piloting large-scale genome sequencing for research in genomic medicine. Genome Res. 2009;19(9):1665–1674. [DOI] [PMC free article] [PubMed] [Google Scholar]
- 37.Sekiyama K, Takamatsu Y, Waragai M, Hashimoto M. Role of genomics in translational research for Parkinson's disease. Biochem Biophys Res Commun. 2014;452(2):226–235. [DOI] [PubMed] [Google Scholar]
- 38.Razzouk S. Translational genomics and head and neck cancer: toward precision medicine. Clin Genet. 2014;86(5):412–421. [DOI] [PubMed] [Google Scholar]
- 39.Jung S, Main D. Genomics and bioinformatics resources for translational science in Rosaceae. Plant Biotechnol Reports. 2014;8:49–64. [DOI] [PMC free article] [PubMed] [Google Scholar]
- 40.Muenke M. Individualized genomics and the future of translational medicine. Mol Genet Genomic Med. 2013;1(1):1–3. [DOI] [PMC free article] [PubMed] [Google Scholar]
- 41.Pilbrow A, Arora P, Martinez-Fernandez A. Top advances in functional genomics and translational biology for 2013. Circul Cardiovasc Genet. 2014;7(1):89–92. [DOI] [PubMed] [Google Scholar]
- 42.Zimmern RL, Brice PC. Realizing the potential of genomics: translation is not translational research. Genet Med. 2009;11(12):898–899; author reply 899. [DOI] [PubMed] [Google Scholar]
- 43.Yu JH, Crouch J, Jamal SM, Bamshad MJ, Tabor HK. Attitudes of non-African American focus group participants toward return of results from exome and whole genome sequencing. Am J Med Genet. Part A 2014;164A(9):2153–2160. [DOI] [PMC free article] [PubMed] [Google Scholar]
- 44.Wright MF, Lewis KL, Fisher TC, et al. Preferences for results delivery from exome sequencing/genome sequencing. Genet Med. 2014;16(6):442–447. [DOI] [PMC free article] [PubMed] [Google Scholar]
- 45.Atkinson NL, Massett HA, Mylks C, Hanna B, Deering MJ, Hesse BW. User-centered research on breast cancer patient needs and preferences of an Internet-based clinical trial matching system. J Med Internet Res. 2007;9(2):e13. [DOI] [PMC free article] [PubMed] [Google Scholar]
- 46.Mirkovic J, Kaufman DR, Ruland CM. Supporting cancer patients in illness management: usability evaluation of a mobile app. JMIR mHealth uHealth. 2014;2(3):e33. [DOI] [PMC free article] [PubMed] [Google Scholar]
- 47.Amland RC, Hahn-Cover KE. Clinical Decision Support for Early Recognition of Sepsis. Am J Med Qual. 2014 Nov 10. pii: 1062860614557636. [Epub ahead of print]. [DOI] [PMC free article] [PubMed] [Google Scholar]
- 48.Gierl L, Steffen D, Ihracky D, Schmidt R. Methods, architecture, evaluation and usability of a case-based antibiotics advisor. Comput Methods Programs Biomed. 2003;72(2):139–154. [DOI] [PubMed] [Google Scholar]
- 49.Xie M, Weinger MB, Gregg WM, Johnson KB. Presenting multiple drug alerts in an ambulatory electronic prescribing system: a usability study of novel prototypes. Appl Clin Inform. 2014;5(2):334–348. [DOI] [PMC free article] [PubMed] [Google Scholar]
- 50.Kohli M, Dreyer KJ, Geis JR. Rethinking radiology informatics. Am J Roentgenol. 2015;204(4):716–720. [DOI] [PubMed] [Google Scholar]
- 51.Rosenkrantz AB, Doshi AM. Continued evolution of clinical decision support tools for guiding imaging utilization. Acad Radiol. 2015;22(4):542–543. [DOI] [PubMed] [Google Scholar]
- 52.Hovenga EJ, Grain H. Health information systems. Stud Health Technol Inform. 2013;193:120–140. [PubMed] [Google Scholar]
- 53.Yuan MJ, Finley GM, Long J, Mills C, Johnson RK. Evaluation of user interface and workflow design of a bedside nursing clinical decision support system. Interact J Med Res. 2013;2(1):e4. [DOI] [PMC free article] [PubMed] [Google Scholar]
- 54.Horsky J, Phansalkar S, Desai A, Bell D, Middleton B. Design of decision support interventions for medication prescribing. Int J Med Inform. 2013;82(6):492–503. [DOI] [PubMed] [Google Scholar]
- 55.Sacchi L, Fux A, Napolitano C, et al. Patient-tailored workflow patterns from clinical practice guidelines recommendations. Stud Health Technol Inform. 2013;192:392–396. [PubMed] [Google Scholar]
- 56.Luo J, Liang S. Prioritization of potential candidate disease genes by topological similarity of protein-protein interaction network and phenotype data. J Biomed Inform. 2014;53:229–236. [DOI] [PubMed] [Google Scholar]
- 57.Masino AJ, Dechene ET, Dulik MC, et al. Clinical phenotype-based gene prioritization: an initial study using semantic similarity and the human phenotype ontology. BMC Bioinformatics. 2014;15:248. [DOI] [PMC free article] [PubMed] [Google Scholar]
- 58.Fatahi N, Krupic F, Hellstrom M. Quality of radiologists' communication with other clinicians-As experienced by radiologists. Patient Educ Counsel. 2015;98(6):722–727. [DOI] [PubMed] [Google Scholar]
- 59.Eppig JT, Blake JA, Bult CJ, Kadin JA, Richardson JE; The Mouse Genome Database G. The Mouse Genome Database (MGD): facilitating mouse as a model for human biology and disease. Nucleic Acids Res. 2015;43:D726–D736. [DOI] [PMC free article] [PubMed] [Google Scholar]
- 60.Washington NL, Haendel MA, Mungall CJ, et al. Linking human diseases to animal models using ontology-based phenotype annotation. PLoS Biol. 2009;7(11):e1000247. [DOI] [PMC free article] [PubMed] [Google Scholar]
- 61.Du J, Yuan Z, Ma Z, Song J, Xie X, Chen Y. KEGG-PATH: Kyoto encyclopedia of genes and genomes-based pathway analysis using a path analysis model. Mol Biosyst. 2014;10(9):2441–2447. [DOI] [PubMed] [Google Scholar]
- 62.Roncaglia P, Martone ME, Hill DP, et al. The Gene Ontology (GO) Cellular Component Ontology: integration with SAO (Subcellular Anatomy Ontology) and other recent developments. J Biomed Semant. 2013;4(1):20. [DOI] [PMC free article] [PubMed] [Google Scholar]
- 63.Amberger JS, Bocchini CA, Schiettecatte F, Scott AF, Hamosh A. OMIM.org: Online Mendelian Inheritance in Man (OMIM(R)), an online catalog of human genes and genetic disorders. Nucleic Acids Res. 2015;43:D789–D798. [DOI] [PMC free article] [PubMed] [Google Scholar]
- 64.Stenson PD, Ball EV, Mort M, Phillips AD, Shaw K, Cooper DN. The Human Gene Mutation Database (HGMD) and its exploitation in the fields of personalized genomics and molecular evolution. Curr Protoc Bioinformatics. 2012;Chapter 1:Unit1 13. [DOI] [PubMed] [Google Scholar]
- 65.Landrum MJ, Lee JM, Riley GR, et al. ClinVar: public archive of relationships among sequence variation and human phenotype. Nucleic Acids Res. 2014;42(Database issue):D980–D985. [DOI] [PMC free article] [PubMed] [Google Scholar]
- 66.Dib-Hajj SD, Waxman SG. Translational pain research: Lessons from genetics and genomics. Sci Transl Med. 2014;6(249):249sr244. [DOI] [PubMed] [Google Scholar]
- 67.Overby CL, Tarczy-Hornoch P. Personalized medicine: challenges and opportunities for translational bioinformatics. Pers Med. 2013;10(5):453–462. [DOI] [PMC free article] [PubMed] [Google Scholar]
- 68.Fitzpatrick G, Ellingsen G. A Review of 25 years of CSCW research in healthcare: contributions, challenges and future agendas. Comput Supp Coop W J. 2013;22(4-6):609–665. [Google Scholar]
- 69.Cavusoglu H, Frisch L, Fels S. Sociotechnical challenges and progress in using social media for health. J Med Internet Res. 2013;15(10):1–1. [DOI] [PMC free article] [PubMed] [Google Scholar]
- 70.Monsted T, Reddy MC, Bansler JP. The use of narratives in medical work: a field study of physician-patient consultations. Ecscw 2011: Proceedings of the 12th European Conference on Computer Supported Cooperative Work ; 2011:81–100. [Google Scholar]
- 71.Papagelis M, Rousidis I, Plexousakis D, Theoharopoulos E. Incremental collaborative filtering for highly-scalable recommendation algorithms. Foundations Intell Syst, Proc. 2005;3488:553–561. [Google Scholar]
- 72.Cain J. Online social networking issues within academia and pharmacy education. Am J Pharm Educ. 2008;72(1): Article 10. [DOI] [PMC free article] [PubMed] [Google Scholar]
- 73.Rosenbloom KR, Armstrong J, Barber GP, et al. The UCSC Genome Browser database: 2015 update. Nucleic Acids Res. 2015;43:D670–D681. [DOI] [PMC free article] [PubMed] [Google Scholar]


