

Abstract
Background
Previous studies have indicated that intake of dietary flavonoids or flavonoid subclasses is associated with the ovarian cancer risk, but presented controversial results. Therefore, we conducted a meta-analysis to derive a more precise estimation of these associations.
Methods
We performed a search in PubMed, Google Scholar and ISI Web of Science from their inception to April 25, 2015 to select studies on the association among dietary flavonoids, flavonoid subclasses and ovarian cancer risk. The information was extracted by two independent authors. We assessed the heterogeneity, sensitivity, publication bias and quality of the articles. A random-effects model was used to calculate the pooled risk estimates.
Results
Five cohort studies and seven case-control studies were included in the final meta-analysis. We observed that intake of dietary flavonoids can decrease ovarian cancer risk, which was demonstrated by pooled RR (RR = 0.82, 95% CI = 0.68–0.98). In a subgroup analysis by flavonoid subtypes, the ovarian cancer risk was also decreased for isoflavones (RR = 0.67, 95% CI = 0.50–0.92) and flavonols (RR = 0.68, 95% CI = 0.58–0.80). While there was no compelling evidence that consumption of flavones (RR = 0.86, 95% CI = 0.71–1.03) could decrease ovarian cancer risk, which revealed part sources of heterogeneity. The sensitivity analysis indicated stable results, and no publication bias was observed based on the results of Funnel plot analysis and Egger’s test (p = 0.26).
Conclusions
This meta-analysis suggested that consumption of dietary flavonoids and subtypes (isoflavones, flavonols) has a protective effect against ovarian cancer with a reduced risk of ovarian cancer except for flavones consumption. Nevertheless, further investigations on a larger population covering more flavonoid subclasses are warranted.
Introduction
Ovarian cancer remains a highly lethal malignancy in the world, which has been a serious risk factor of health and safety for women, and a majority of patients are diagnosed in late stages of this disease [1–2]. As the poor prognosis for this disease, efforts to identify modifiable risk factors to reduce the risk of it are warranted. According to recent guidelines for cancer prevention published by the American Cancer Society Guidelines, diet remains one of the key lifestyle factors thought to modify cancer risk [3], although specific associations with the risk of ovarian cancer are less convincing [4].
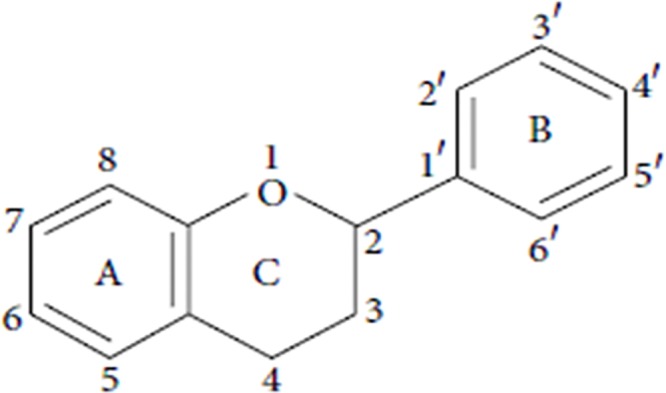
Flavonoids with several functions in different physiological and pathological processes of cancer are polyphenolic compounds having a basic benzo-γ-pyrone structure (see Fig 1), which are widely distributed in all foods of plant origin such as fruit, vegetable, tea and wine [5–7]. Studies have suggested that consumption of high doses of dietary flavonoids has favorable health effects with a reduced risk of cancer such as those of the breast [8, 9], rectum [10], lung [11] and ovarian cancer [12]. Moreover, studies have demonstrated that the different pharmacological activities of dietary flavonoids on ovarian cancer depend on their structure [13]. Based on the range and structural complexity, dietary flavonoids in all food of plant can be categorized into six major subclasses as followed: flavones, isoflavones, flavonol, flavanones, anthocyanidins and flavan-3-ols [14,15], of which flavones, isoflavones and flavonols are reported in the highest amounts of consumption in the human diet and have biological activity on ovarian cancer [16–20]. Therefore, in this study we mainly focused on the association among total flavonoids, flavonoid subclasses (flavones, isoflavones and flavonols) and ovarian cancer risk.
Fig 1. The basic structure of flavonoids.
Epidemiological studies and clinical trials have explored that flavonoids intake has the chemopreventive effects on carcinogenesis [21–23], and the adverse effects of flavonoids in human health are rare. Thus the anticancer activity of dietary flavonoids has become an upsurging research interest in the therapeutic and preventive potential. Considering intake of dietary flavonoids may reduce the risk of ovarian cancer, a number of studies have explored the association between dietary flavonoids and ovarian cancer risk. However, individual studies have yielded inconsistent or controversial findings. In addition, even though there was a meta-analysis which only analyzed the relationship between isoflavones (one subclass of dietary flavonoids) and the risk of ovarian cancer [24]. On the contrary, there was a systematic review of the relationships between dietary intake and ovarian cancer risk [25], which evaluated the role of all dietary intakes in ovarian cancer risk. To shed light on these conflicting results and to more precisely evaluate the association among dietary flavonoids, flavonoid subclasses and the risk of ovarian cancer for the guidance of clinical practice and prevention of ovarian cancer, we performed a meta-analysis of epidemiologic studies to investigate the association among dietary flavonoids, flavonoid subclasses and ovarian cancer risk.
Material and Methods
Search Strategy
We did our best to conduct a systematic literature search in PubMed, Google Scholar and ISI Web of Science up to April 25, 2015, without language restriction, regarding the association among dietary flavonoids, flavonoid subclasses and ovarian cancer risk. The search terms were as follows: (flavonoids or flavones or isoflavones or flavonols or flavanones or anthocyanidins or flavan-3-ols or polyphenolic compounds) and (Ovarian Neoplasms or Ovary Neoplasms or Ovarian Cancers or Ovary Cancers or Cancer of Ovarian or Cancer of Ovary or Ovarian tumor or Ovary tumor or Ovarian carcinoma or Ovary carcinoma). Furthermore, we performed a manual search by reviewing the related reference articles to identify any studies that were not identified from above literature searches. Only full length original journal articles were considered and articles have only abstracts or unpublished were excluded in this study. Our meta-analysis meta-analysis was conducted following the Meta-analysis of Observational Studies in Epidemiology (MOOSE) guidelines [26](PRISMA checklist reported in S1 Table).
Inclusion and exclusion criteria
Studies were considered eligible if they met all of the following criteria: (1) the original articles described a case-control, cohort or randomized control design; (2) the article had either dietary flavonoids or subclasses of flavonoids intake as the exposure of interest; (3) the article reported the risk of ovarian cancers; and (4) the article reported 95% confidence intervals (CIs) with adjusted odds ratios (ORs) or relative risks (RRs) for ovarian cancer risk in subjects with the highest dietary flavonoids intake compared with those with the lowest dietary flavonoids intake. If multiple articles reported the risk of ovarian cancer from the same data, the most recently published data were selected, the overlapped cases but the latest were excluded. Meanwhile, if articles reported as an abstract, summary, comment letter, review or editorial, were also excluded.
Data collection
On the basis of the inclusion and exclusion criteria listed above, the two independent investigators (LX Yu and XL Hua) extracted the following data: first author, publication year, study region, study design, data acquisition approach, number of cases and controls, types and consumption of flavonoids, controlled confounders adjusted for in multivariate analysis, OR or RR and 95% CI. We also assessed the quality of each study by using the Newcastle-Ottawa Scale (NOS) quality assessment criteria [27]. The quality scores of the studies ranged from 0 to 9.0, Scores<7.0 indicates low quality, otherwise indicates high quality.
Statistical analysis
Statistical analyses were performed by using Stata 12.0 software (StataCorp LP, College Station, TX). RR with 95% CI was assessed for determining the associations between dietary flavonoids, flavonoid subclasses and ovarian cancer risk. The pooled RR were computed by the adjusted RRs or ORs and 95% CIs reported in the studies. The ORs were considered to correspond to RRs. Cochran Q statistic and I2 were used for the assessment of heterogeneity across the studies [28]. Nevertherless, in view of the limitations of Cochran Q, especially for small meta-analysis [29], Tau2 was also provided. In addition, a random effects model described by DerSimonian-Laird method was preferred to calculate the summarized estimates and corresponding 95% CIs [30]. Sensitivity analysis was performed to evaluate the robustness of the results of the combined effects, which were performed by sequential removal of each study. As publication biases in meta-analysis are more likely to affect small studies [31], just when the number of studies was more than10, Funnel plots and Egger’s linear regression tests were used to evaluate the publication bias (p < 0.05 suggested statistical significance) [32]. To explore the source of heterogeneity among the studies, subgroup analysis by flavonoid subclasses was performed.
Results
Literature search and Characteristics of the Included Studies
As shown in Fig 2, a total of 68 articles were identified in the initial search. Of these articles, 46 were excluded after reviewing the titles and abstracts, removing duplicates. Then, by thoroughly reading the full text 10 articles were also excluded because they did not provide information about flavonoids or flavonoid subclasses intake, ovarian cancer risk, or 95% CI. Finally, a total of 12 articles [12, 16–20, 33–38] with 6275 cases and 393776 controls met the inclusion criteria and were included in the final meta-analysis. The characteristics of the included studies were presented in Table 1, of which nine were high-quality studies (scores≥7.0). The selected studies were published between 2003 and 2014 spanning 11 years, and all of them were published in English. Among these 12 studies, 5 were prospective cohort studies, 7 were case-control studies, including 5 population based case-control studies, and 2 hospital based case-control studies. Moreover, 6 studies were from USA, 2 from China, and the rest were respectively from United Kingdom, Swedish, Australian, and Italy. The exposure assessments of flavonoids and flavonoid subclasses in 12 studies were made by questionnaire or published food composition data bases.
Fig 2. Flow chart of literature search and selection procedures on flavonoids and flavonoid subclasses in relation to the risk of ovarian cancer.
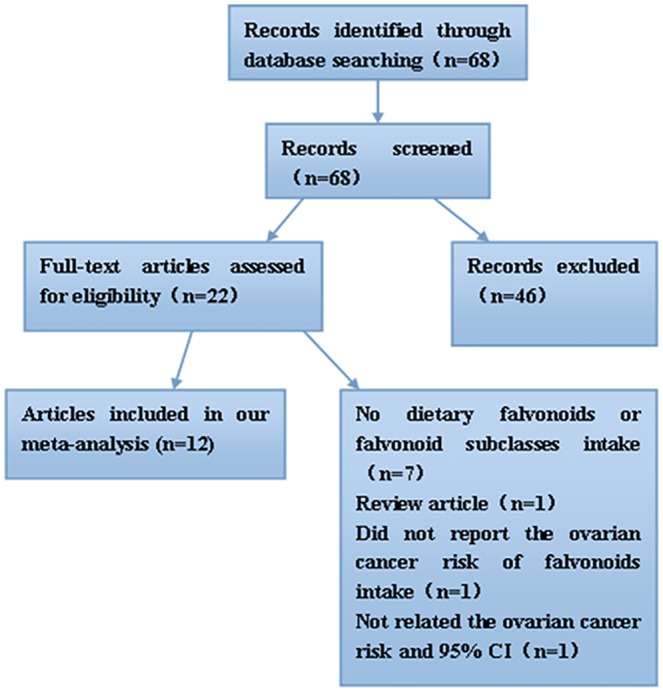
Table 1. Study characteristics of the association between dietary flavonoids, flavonoid subclasses and ovarian cancer risk in this meta-analysis.
Note: FFQ: food frequency questionnaire; SFFQ: semi-quantitative food intake questionnaire; NOS: Newcastle-Ottawa Scale; BMI: body mass index.
| Fisrt author, publicatin year and study region | Study design, data acquisition approach | Cases/ controls | Models | Types of flavonoids, flavonoid subclasses and consumption (low vs high) (mg/d) | RR or OR (95%CI) | Adjustments | Scores |
|---|---|---|---|---|---|---|---|
| Aedin Cassidy, 2014, United Kingdom | Prospective cohort, FFQ | 723/171940 | Cox proportional hazards models | total flavonoids (117.1 vs 713.4) | 0.85 (0.66–1.09) | age, quintile of cumulative updated, energy-adjusted lactose intake and cumulative updated total energy intake, parity, the current questionnaire cycle, menopausal status, prmenopausal status, duration of oral contraceptive use, et al. | 8 |
| flavones (0.7 vs 3.2) | 0.87 (0.68–1.11) | ||||||
| flavonols (7.4 vs 30.2) | 0.76 (0.59–0.98) | ||||||
| flavanones (7.8 vs 75.8) | 0.79 (0.63–1.00) | ||||||
| flavan-3-ols (9.3 vs 133.7) | 0.91 (0.71–1.16) | ||||||
| anthocyanin (2.5 vs 23.9) | 0.95 (0.75–1.21) | ||||||
| proanthocyanin (54.0 vs 196.8) | 0.92 (0.73–1.16) | ||||||
| Maria Hedelin, 2011, Swedish | Prospective cohort, FFQ | 163/47140 | Cox proportional hazards models | total isoflavonoids (0.0005 vs 0.038) | 1.15 (0.74–1.81) | age, oral contraceptives, age at menarche, parity, hormone replacement therapy, and intake of total energy intake, et al. | 7 |
| Lu Wang, 2009, USA | Prospective cohort, SFFQ | 141/3234 | Cox regression models | total quantified flavonoid (8.88 vs 47.44) | 1.09 (0.60–2.01) | age, race, total energy intake and andomized treatment assignment, physical activity, postmenopausal status, et al. | 7 |
| Ellen T. Chang, 2007, USA | Prospective cohort, questionnaire | 280/97275 | Multivariable Cox proportional hazards regression | total isoflavonoids (117.1 vs 713.4) | 0.56 (0.33–0.96) | race, total energy intake, parity, oral contraceptive use, strenuous exercise, wine consumption, and menopausal status et al. | 6 |
| genistein (0.3 vs 1.1) | 0.65 (0.42–1.02) | ||||||
| daidzein (0.3 vs 0.9) | 0.75 (0.49–1.16) | ||||||
| Margaret A. Gates, 2007, USA | Prospective cohort, SFFQ | 347/66940 | Cox proportional hazards models | total flavonoids (8.5 vs 42.6) | 0.75 (0.51–1.09) | age, oral contraceptive use, parity, tubal ligation, smoking status, postmenopausal hormone use, physical activity, cumulative updated total energy intake, et al. | 7 |
| myricetin (0.1 vs 2.4) | 0.72 (0.50–1.04) | ||||||
| kaempferol (0.8 vs 11) | 0.60 (0.42–0.87) | - | |||||
| quercetin (6.3 vs 30.7) | 0.80 (0.55–1.16) | ||||||
| luteolin (0.01 vs 0.07) | 0.66 (0.49–0.91) | ||||||
| apigenin (0.2 vs 1.3) | 1.33 (0.96–1.83) | ||||||
| Andy H. Lee, 2014, China | Hospital based case-control, SFFQ | 500/500 | Unconditional logistic regression | isoflavones (26.7 vs 41.0) | 0.45 (0.29–0.59) | age, BMI, physical activity, total energy intake, parity, oral contraceptive use, hormone replacement therapy, menopausal status, education, et al. | 8 |
| daidzein (10.2 vs 16.9) | 0.41 (0.29–0.59) | ||||||
| genistein (12.3 vs 21.1) | 0.42 (0.30–0.60) | ||||||
| glycitein (1.9 vs 3.3) | 0.38 (0.27–0.55) | ||||||
| Annette S. Neill, 2014, Australian | Population based case-control, FFQ and published food composition data bases | 1366/1414 | Unconditional logistic regression | isoflavones (0.28 vs 4) | 1.06 (0.79–1.43) | age, energy intake, age at menarche, parity, oral contraceptive use, hormone replacement therapy use, BMI, et al. | 8 |
| daidzein (0.09 vs 1.2) | 1.07 (0.8–1.43) | ||||||
| genistein (0.15 vs 2.7) | 1.10 (0.82–1.48) | ||||||
| glycitein (0.02 vs 0.25) | 0.93 (0.67–1.29) | ||||||
| formononetin (0.003vs 0.005) | 0.97 (0.72–1.31) | ||||||
| biochanin A (0.015 vs 0.03) | 1.09 (0.81–1.47) | ||||||
| Elisa V. Bandera, 2011, USA | Population based case-control, FFQ | 205/391 | Unconditional logistic regression | total isoflavones (0.07 vs 0.41) | 0.78 (0.48–1.27) | age, education, race, age at menarche, menopausal status, parity, oral contraceptive use, hormone replacement therapy use, BMI, et al. | 7 |
| daidzein (0.02 vs 0.14) | 0.8 (0.48–1.31) | ||||||
| glycitein (0.002 vs 0.0092l) | 0.74 (0.46–1.21) | ||||||
| genistein (0.04 vs 0.25) | 0.75 (0.46–1.23) | ||||||
| formononetin (0.0039 vs 0.0068) | 0.69 (0.42–1.14) | ||||||
| Margaret A. Gates, 2009, USA | Population based case-control, FFQ | 1141/1183 | Unconditional logistic regression | total flavonoids (0.9 vs 95) | 1.06 (0.78–1.45) | age in years, study center, duration of oral contraceptive use, parity, history of tubal ligation, physical activity, total duration of breastfeeding, dietary intake of carotenoids, fiber intake, et al. | 8 |
| myricetin (0.4 vs 2.8) | 1.12 (0.85–1.49) | ||||||
| kaempferol (0.5 vs 6.9) | 0.98 (0.73–1.32) | ||||||
| quercetin (3.5 vs 16.5) | 1.14 (0.84–1.56) | ||||||
| luteolin (0.3 vs 2.9) | 1.01 (0.58–1.74) | ||||||
| apigenin (0.03 vs 0.7) | 0.79 (0.59–1.06) | ||||||
| Marta Rossi, 2008, Italy | Hospital based case-control, FFQ | 1031/2411 | Logistic regression models | flavan-3-ols (16.3 vs 77.0) | 0.89 (0.67–1.17) | age, study center, education, year of interview, parity, oral contraceptive use and family history of ovarian or breast cancer or both in first-degree relatives | 8 |
| flavanones (12.2 vs 67.0) | 1.28 (0.98–1.68) | ||||||
| flavonols (11.6 vs 28.8) | 0.63 (0.47–0.84) | ||||||
| flavones (0.3 vs 0.7) | 0.99 (0.76–1.29) | ||||||
| anthocyanidins (3.5 vs 19.4) | 0.79 (0.60–1.04) | ||||||
| isoflavones (0.0128 vs 0.0325) | 0.51 (0.37–0.69) | ||||||
| total flavonoids (67.3 vs 173.6) | 1.07 (0.82–1.40) | ||||||
| Min Zhang, 2004, China | Population based case-control, FFQ | 254/652 | Multivariate logistic regression | total isoflavonoids (11.6 vs 32.8) | 0.51 (0.31–0.85) | age at diagnosis, education, area of residence, BMI, tobacco smoking, alcohol consumption, tea drinking, physical activity, parity, menopausal status, et al. | 6 |
| daidzein (5 vs 14.9) | 0.52 (0.31–0.87) | ||||||
| genistein (6.6 vs 20.9) | 0.5 (0.30–0.84) | ||||||
| glycitein (0.4 vs 1.7) | 0.59 (0.35–0.97) | ||||||
| Susan E. McCan, 2003, USA | Population based case-control, FFQ | 124/696 | Unconditional logistic Regression | quercetin (10.16 vs 31.71) | 0.71 (0.38–1.32) | age, education, total months menstruating, difficulty becoming pregnant, oral contraceptive use, menopausal status, et al. | 6 |
| kaempferol (2.09 vs 8.57) | 0.73 (0.39–1.34) |
Most individual studies were adjusted for a wide range of potential confounders, including age, education, cumulative updated total energy intake, BMI, physical activity, duration of oral contraceptive use, and history of postmenopausal hormone use.
Meta-analysis results
The meta-analysis of the five cohort studies and seven case-control studies indicated that ovarian cancer risk was significantly reduced (RR = 0.82, 95% CI = 0.68–0.98) in women with highest intakes of total flavonoids, compared with that in those with lowest intakes of total flavonoids. That is, consumption of dietary flavonoids has a protective effect against ovarian cancer. The heterogeneity among the studies was significant (I2 = 62% (95%CI = 28%–80%), Tau2 = 0.059, p = 0.002) from a random effect model (Fig 3A).
Fig 3. Forest plot of the RR with 95%CI for flavonoids, flavonoid subclasses intake and ovarian cancer risk (A. Total flavonoids, B. Flavones, C. Isoflavones and D. Flavonols).

Subgroup meta-analysis
A subgroup meta-analysis was performed according to the subclasses of dietary flavonoids. We identified 4 studies about flavones intake and ovarian cancer risk, 4 studies about flavonols, and 7 studies about isoflavones. Overall, there was no sufficient evidence showing the association between intake of flavones and the ovarian cancer risk (RR = 0.86, 95% CI: 0.71–1.03) (Fig 3B). On the other hand, the incidence of ovarian cancer was decreased by consumption of isoflavones (RR = 0.67, 95% CI: 0.50–0.92) (Fig 3C) and flavonols (RR = 0.68, 95% CI: 0.58–0.80) (Fig 3D). Furthermore, in subgroup the heterogeneity was not significant for flavonols (I2 = 0.0% (95%CI = 0–85%), Tau2 = 0.0, p = 0.68) and flavones (I2 = 29.2% (95%CI = 0–74%), Tau2 = 0.01, p = 0.237) except for isoflavones (I2 = 75.4% (95%CI = 48%–88%), Tau2 = 0.125, p < 0.001).
Sensitivity analyses
A sensitivity analysis was performed to evaluate the affect of each study by sequential omission of each eligible study. The outcome revealed that the exclusion of any single study did not alter the pooled risk estimates (Fig 4). Moreover, the pooled risk estimates were not significant difference between random-effects model (RR = 0.82, 95% CI = 0.68–0.98) and fixed-effects model (RR = 0.85, 95% CI = 0.76–0.95) (Fig a in S2 File).
Fig 4. Sensitivity analysis of the overall RRs.
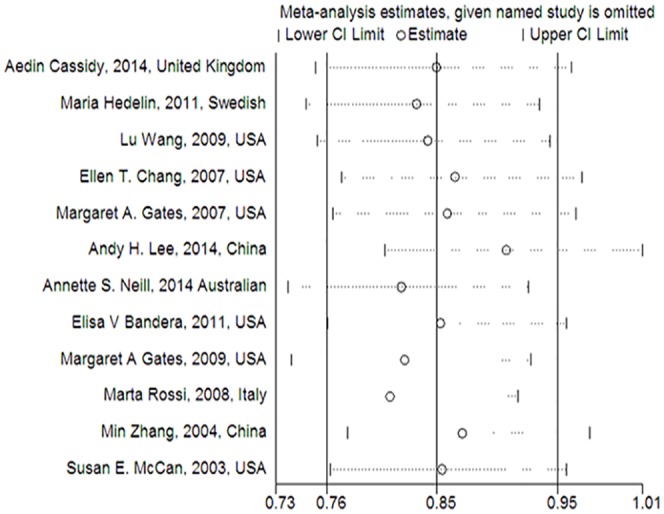
(The results were calculated by omitting each eligible study. Random-effects model was used.).
Publication Bias
Publication bias of dietary total flavonoids was evaluated with both Funnel plots and Egger’s tests. As shown in Fig 5, the shapes of the funnel plots show little evidence of publication bias among the studies. Moreover, results from Egger’s tests indicated no evidence of publication bias among these studies (p = 0.26). (Fig 6).
Fig 5. Funnel plot analysis to detect publication bias for total flavonoids.
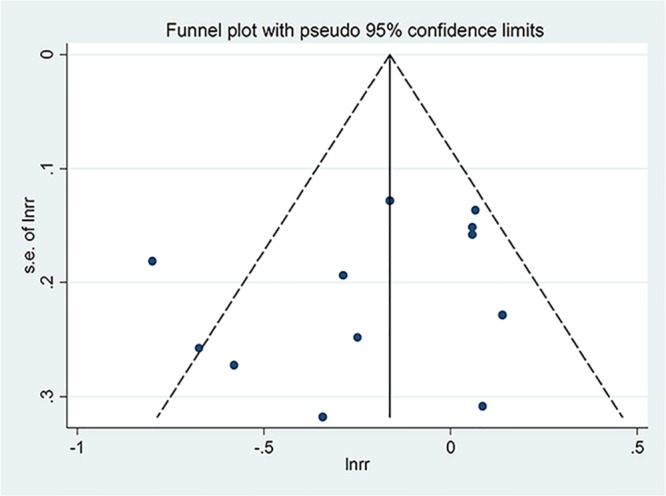
Fig 6. Egger’s Publication Bias Plot for total flavonoids.

Discussion
To the best of our knowledge, this is a comprehensive meta-analysis conducted for investigating the relationship among dietary flavonoids, flavonoid subclasses and ovarian cancer risk. The statistical analysis found that intake of dietary flavonoids can decrease ovarian cancer risk by 18%, and flavonoid subclasses: isoflavones by 33%, flavonols by 32%, respectively. That is, intake of total dietary flavonoids and their subclasses (isoflavones, flavonols) had protective effects against ovarian cancer except for flavones consumption.
At present, the influence of dietary flavonoids and flavonoid subclasses on the risk of ovarian cancer remains controversial. Some studies which were consistent with our findings have reported that dietary flavonoids or flavonoid subclasses may decrease the risk of ovarian cancer [17, 19, 36]. Although the pharmacological mechanisms underlying this effect of ovarian cancer remain unclear, it may be explained by the anticancer properties of different flavonoid subclasses [13]. There are multiple potential anticancer molecular mechanisms by which flavonoids or flavonoid subclasses might decrease the incidence of ovarian cancer [39]. Firstly, flavonoids or flavonoid subclasses could stabilize p53 gen. The stabilization of p53 often accompanies a G1 phase cell cycle arrest. Secondly, flavonoids, flavonoid subclasses might also inhibit the activity of tyrosine kinase [40]. Tyrosine kinases are a family of proteins located in or near the cell membrane involved in the transduction of growth factor signals to the nucleus. Thirdly, flavonoids are shown to modulate the inflammatory cytokines such as TNF-α and IL-6, which is inseparable with ovarian cancer. These cytokines have been shown to be involved in ovarian cancer growth and metastasis as demonstrated in various animal models and in human ovarian cancer biopsy tissues [41–43]. Fourthly, some subclasses of flavonoids have the capacity of binding with estrogen receptor, especially isoflavones [44, 45]. Therefore, flavonoids may contribute to the prevention of ovarian cancer by multiple ways.
Other studies have suggested that intake of total flavonoids may have no clear association on the incidence of ovarian cancer. Maria Hedelin's study [34] showed that no statistically significant association between ovarian cancer risk and intake of soy which are rich in isoflavones. Aedin Cassidy, et al. [12] found that total flavonoids were not statistically significantly associated with ovarian cancer risk; while participants in the highest quintiles of flavonols and flavanones intakes had modestly lower risk of ovarian cancer than participants in the lowest quintile. Several factors may explain the controversial results of these studies. Firstly, limited epidemiologic studies have evaluated the association between dietary flavonoids and ovarian cancer risk. Secondly, dietary flavonoids are widely existed in plant foods [5–7], so it is difficult to evaluate the consumption of total flavonoids or flavonoid subclasses. Thirdly, part of the controversy of epidemiological studies may be due to the difficulty in measuring intake levels of flavonoids and furthermore there were few methods for testing such as plasma metabolite levels or urinary excretion of flavonoids, which could complement dietary evaluation of the bioavailability of these dietary compounds. In summary, additional carefully designed studies should be conducted to improve the method and database for assessing dietary flavonoids, flavonoid subclasses consumption.
Several limitations should be addressed in this meta-analysis. Firstly, despite we searched all studies describing the associations of dietary flavonoids, flavonoid subclasses with ovarian cancer risk without language restricted, the number of eligible studies was still limited, especially in terms of a subgroup analysis. There are only 12 studies about total flavonoids, 4 about flavones, 7 about isoflavones, 4 about flavonols, as shown in Table 1, and the number of other subclasses such as anthocyanins and flavanones is more limited that it can not be statistical analysis. On the other hand, as the eligible studies are limited, the heterogeneity across our studies including subgroup analysis may produce biased estimates and conclusions. Previous research has shown that estimates of zero (or even low) heterogeneity should also be a concern since heterogeneity is very likely present but undetected (or underestimated). Although the bootstrapped DerSimonian-Laird leads to a small improvement over the standard random-effects model, the problem largely remains, especially for very small meta-analysis [46]. Hence, our findings should be interpreted cautiously. Secondly, as the publication year may affect publication bias [47], the selected studies in our study spanned 11 years. Therefore, potential publication bias is very likely to exist, in spite of no evidence was obtained from our statistical tests (Figs b-d in S2 File). Thirdly, different preparation and processing of food may have influenced the flavonoid levels and thus to affect the results. For example, in a recent study, orange juices were found to contain 81–200mg/L soluble flavanones, while the content in the cloud was 206–644mg/L which suggested that the flavanones are concentrated in the cloud during processing and storage [39]. However, no appropriate information was available to test this. Fourthly, accurate measurement of the average dietary flavonoids consumption is difficult, because of the wide varieties of available flavonoids and the extensive distribution in various plants. Finally, we did not retrieve the relevant published randomized controlled trial with respect to the associations among dietary flavonoids and ovarian cancer risk.
In order to explore the source of heterogeneity we conducted a meta-regression analysis in these respects of publication year, study region, cases and the NOS score (in Table 1). But none of these factors had related to estimations of effect indeed (Table a in S1 File). As mentioned above, the 12 eligible studies concerning all dietary flavonoids and flavonoid subclass, and the measurement of criteria for each flavonoid subclass was not consistent. Meanwhile, studies have suggested that different subclasses of dietary flavonoids could decrease the risk of ovarian cancer in different degrees, which also suggested that some heterogeneity exist in the study. Thus, to a certain extent, the heterogeneity across the studies was acceptable. Furthermore, in order to effectively minimize or more adequately explain heterogeneity, the methods for measuring individual consumption of dietary flavonoids and flavonoid subtypes seem also particularly desirable, as the dose of the dietary flavonoids or flavonoid subtypes might affect the protective effects regarding both patient and study results, and further higher quality studies such as well-designed especially randomized controlled trials, more comprehensive studies including more flavonoid subclass, and studies that explore the detail mechanisms of the associations among dietary flavonoids, flavonoid subclasses and ovarian cancer risk are warranted.
In contrast, there are also some advantages in our study. Our meta-analysis systematically and comprehensively sheds light on the associations among dietary flavonoids, flavonoid subclasses and ovarian cancer risk. From a public health perspective, the association between consumption of dietary flavonoids and ovarian cancer risk seems highly meaningful, as the protective effects of dietary flavonoids may provide opportunities for prevention regarding ovarian cancer. In addition, due to comprehensive analysis of more case-control and cohort studies data, our analysis increases the power and plausibility of the conclusion when compared with previous individual studies.
Conclusions
In summary, the available evidence suggested that intake of dietary flavonoids, flavonoid subclasses (isoflavones, flavonols) has a protective effect against ovarian cancer with a reduced incidence of ovarian cancer. While the evidence for possible protection of flavones consumption against ovarian cancer was not compelling. The findings likely provide useful insight and evidence which can be used by healthcare professionals when discussing dietary flavonoids and ovarian cancer prevention with patients. While, further investigations on a larger population covering more other different flavonoid subclasses are required to confirm our findings.
Supporting Information
(DOC)
(DOC)
(DOC)
Acknowledgments
This study was supported by the research grant from National Natural Science Foundation of China (81372807 and 81503427) and Natural Science Foundation of Hubei Province (2015CKB751). The authors have declared that no competing interests exist.
Data Availability
All relevant data are within the paper.
Funding Statement
This study was supported by the research grant from National Natural Science Foundation of China (81372807 and 81503427) and Natural Science Foundation ofHubei Province (2015CKB751). The URLs of the National Natural Science Foundation of China (81372807 and 81503427) is “http://www.isisn.nsfc.gov.cn.”. The URLs of the Natural Science Foundation of Hubei Province (2015CKB751) is “http://jhsb.hbstd.gov.cn.”. LLY and LXY were responsible for the initial plan, study design, data collection including data extraction, interpretation and statistical analysis; LXY is still for data collection, data extraction, and critical revision of the manuscript.
References
- 1.Siegel R, Ma J, Zou Z, Jemal A.Cancer statistics, 2014. CA Cancer J Clin. 2014; 64: 9–29. 10.3322/caac.21208 [DOI] [PubMed] [Google Scholar]
- 2.Ferlay J, Soerjomataram I, Dikshit R, Eser S, Mathers C, Rebelo M, Parkin DM, Forman D, Bray F. Cancer incidence and mortality worldwide: sources, methods and major patterns in GLOBOCAN 2012. Int J Cancer. 2015; 136: E359–386. 10.1002/ijc.29210 [DOI] [PubMed] [Google Scholar]
- 3.American Cancer Society. Cancer Facts and Figures 2013. Atlanta: American Cancer Society; 2013. [Google Scholar]
- 4.Pesec M, Sherertz T.Global health from a cancer care perspective. Future Oncol. 2015; 11: 2235–2245. 10.2217/fon.15.142 [DOI] [PubMed] [Google Scholar]
- 5.D'Archivio M, Filesi C, Di Benedetto R, Gargiulo R, Giovannini C, Masella R. Polyphenols, dietary sources and bioavailability.Ann Ist Super Sanita. 2007; 43: 348–361. [PubMed] [Google Scholar]
- 6.Corcoran MP, McKay DL, Blumberg JB. Flavonoid basics: chemistry, sources, mechanisms of action, and safety.J Nutr Gerontol Geriatr. 2012; 31:176–189. 10.1080/21551197.2012.698219 [DOI] [PubMed] [Google Scholar]
- 7.Ross JA, Kasum CM. Dietary flavonoids: bioavailability, metabolic effects, and safety. Annu Rev Nutr. 2002; 22: 19–34. [DOI] [PubMed] [Google Scholar]
- 8.Kim MK, Kim JH, Nam SJ, Ryu S, Kong G. Dietary intake of soy protein and tofu in association with breast cancer risk based on a case-control study.Nutr Cancer. 2008; 60: 568–576. 10.1080/01635580801966203 [DOI] [PubMed] [Google Scholar]
- 9.Hui C, Qi X, Qianyong Z, Xiaoli P, Jundong Z, Mantian M. Flavonoids, flavonoid subclasses and breast cancer risk: a meta-analysis of epidemiologic studies. PLoS One. 2013; 8: e54318 10.1371/journal.pone.0054318 [DOI] [PMC free article] [PubMed] [Google Scholar]
- 10.Aune D, Lau R, Chan DS, Vieira R, Greenwood DC, Kampman E, Norat T.Nonlinear reduction in risk for colorectal cancer by fruit and vegetable intake based on meta-analysis of prospective studies. Gastroenterology. 2011; 141: 106–118. 10.1053/j.gastro.2011.04.013 [DOI] [PubMed] [Google Scholar]
- 11.Tang NP, Zhou B, Wang B, Yu RB, Ma J. Flavonoids intake and risk of lung cancer: a meta-analysis. Jpn J Clin Oncol. 2009; 39: 352–359. 10.1093/jjco/hyp028 [DOI] [PubMed] [Google Scholar]
- 12.Cassidy A, Huang T, Rice MS, Rimm EB, Tworoger SS.Intake of dietary flavonoids and risk of epithelial ovarian cancer.Am J Clin Nutr. 2014; 100:1344–1351. 10.3945/ajcn.114.088708 [DOI] [PMC free article] [PubMed] [Google Scholar]
- 13.Kelly E. H., Anthony R. T., Dennis J. B.. Flavonoid antioxidants: chemistry, metabolism and structure-activity relationships. Journal of Nutritional Biochemistry, 2002, 13: 572–584. [DOI] [PubMed] [Google Scholar]
- 14.U.S. Department of Agriculture. Iowa State University database on the isoflavone content of foods, Release 1.3. Beltsville, MD: USDA, 2002. [Google Scholar]
- 15.U.S. Department of Agriculture. USDA database for the flavonoid content of selected foods. Beltsville, MD: USDA, 2003. [Google Scholar]
- 16.McCann SE, Freudenheim JL, Marshall JR, Graham S. Risk of human ovarian cancer is related to dietary intake of selected nutrients, phytochemicals and food groups. J Nutr. 2003; 133: 1937–1942. [DOI] [PubMed] [Google Scholar]
- 17.Zhang M, Xie X, Lee AH, Binns CW. Soy and isoflavone intake are associated with reduced risk of ovarian cancer in southeast china. Nutr Cancer. 2004; 49:125–130. [DOI] [PubMed] [Google Scholar]
- 18.Chang ET, Lee VS, Canchola AJ, Clarke CA, Purdie DM, Reynolds P, et al. Diet and risk of ovarian cancer in the California Teachers Study cohort. Am J Epidemiol. 2007; 165: 802–813. [DOI] [PMC free article] [PubMed] [Google Scholar]
- 19.Gates MA, Tworoger SS, Hecht JL, De Vivo I, Rosner B, Hankinson SE. A prospective study of dietary flavonoid intake and incidence of epithelial ovarian cancer. Int J Cancer. 2007; 121: 2225–2232. [DOI] [PubMed] [Google Scholar]
- 20.Rossi M, Negri E, Lagiou P, Talamini R, Dal Maso L, Montella M, Franceschi S, La Vecchia C. Flavonoids and ovarian cancer risk: A case-control study in Italy. Int J Cancer. 2008; 123: 895–898. 10.1002/ijc.23549 [DOI] [PubMed] [Google Scholar]
- 21.Neergheen VS, Bahorun T, Taylor EW, Jen LS, Aruoma OI. Targeting specific cell signaling transduction pathways by dietary and medicinal phytochemicals in cancer chemoprevention. Toxicology. 2010; 278: 229–241. 10.1016/j.tox.2009.10.010 [DOI] [PubMed] [Google Scholar]
- 22.Lee KW, Bode AM, Dong Z. Molecular targets of phytochemicals for cancer prevention. Nat Rev Cancer. 2011; 11: 211–218. 10.1038/nrc3017 [DOI] [PubMed] [Google Scholar]
- 23.Vanden Berghe W.Epigenetic impact of dietary polyphenols in cancer chemoprevention: lifelong remodeling of our epigenomes. Pharmacol Res. 2012; 65:565–576. 10.1016/j.phrs.2012.03.007 [DOI] [PubMed] [Google Scholar]
- 24.Dan ping S. Xiaoping W, Liqiang Q. Isoflavones Intake and Risk of Ovarian Cancer: A Meta-Analysis of Epidemiological Study. Soybean Science. 2013; 32: 814–817. [Google Scholar]
- 25.Crane TE, Khulpateea BR, Alberts DS, Basen-Engquist K, Thomson CA. Dietary intake and ovarian cancer risk: a systematic review.Cancer Epidemiol Biomarkers Prev. 2014; 23: 255–273. 10.1158/1055-9965.EPI-13-0515 [DOI] [PMC free article] [PubMed] [Google Scholar]
- 26.Stroup DF, Berlin JA, Morton SC, Olkin I, Williamson GD, Rennie D, et al. Meta-analysis of observational studies in epidemiology: a proposal for reporting. Meta-analysis Of Observational Studies in Epidemiology (MOOSE) group. JAMA: the journal of the American Medical Association. 2000; 283(15):2008–2012. [DOI] [PubMed] [Google Scholar]
- 27.Wells G, Shea B, O’Connell D, Peterson J, Welch V, Losos M, et al. The Newcastle-Ottawa scale (NOS) for assessing the quality of nonrandomised studies in meta-analyses. Ottawa, ON: Ottawa Hospital Research Institute; Available: www.ohri.ca/programs/clinical_epidemiology/oxford.asp. Accessed 25 October 2011. [Google Scholar]
- 28.Higgins JPT and Green S (2011 Available from www.cochrane-handbook.org.) Cochrane Handbook for Systematic Reviews of Interventions Version 5.1.0 [updated March 2011]. The Cochrane Collaboration.
- 29.Hardy RJ, Thompson SG. Detecting and describing heterogeneity in meta-analysis. Stat Med. 1998; 17: 841–856. [DOI] [PubMed] [Google Scholar]
- 30.DerSimonian R, Laird N. Meta-analysis in clinical trials. Control Clin Trials. 1986; 7: 177–188. [DOI] [PubMed] [Google Scholar]
- 31.Sterne Jonathan A.C, Gavaghan David, Egger Matthias. Publication and related bias in meta-analysis: Power of statistical tests and prevalence in the literature. Journal of Clinical Epidemiology. 2000; 53: 1119–1129. [DOI] [PubMed] [Google Scholar]
- 32.Egger M, Davey Smith G, Schneider M, Minder C. Bias in meta-analysis detected by a simple, graphical test. BMJ. 1997; 315: 629–634. [DOI] [PMC free article] [PubMed] [Google Scholar]
- 33.Gates MA, Vitonis AF, Tworoger SS, Rosner B, Titus-Ernstoff L, Hankinson SE, Cramer DW.Flavonoid intake and ovarian cancer risk in a population-based case-control study. Int J Cancer. 2009; 124:1918–1925. 10.1002/ijc.24151 [DOI] [PMC free article] [PubMed] [Google Scholar]
- 34.Hedelin M, Löf M, Andersson TM, Adlercreutz H, Weiderpass E. Dietary phytoestrogens and the risk of ovarian cancer in the women's lifestyle and health cohort study. Cancer Epidemiol Biomarkers Prev. 2011; 20:308–317. 10.1158/1055-9965.EPI-10-0752 [DOI] [PubMed] [Google Scholar]
- 35.Wang L, Lee IM, Zhang SM, Blumberg JB, Buring JE, Sesso HD.Dietary intake of selected flavonols, flavones, and flavonoid-rich foods and risk of cancer in middle-aged and older women. Am J Clin Nutr. 2009; 89: 905–912. 10.3945/ajcn.2008.26913 [DOI] [PMC free article] [PubMed] [Google Scholar]
- 36.Lee AH, Su D, Pasalich M, Tang L, Binns CW, Qiu L. Soy and isoflavone intake associated with reduced risk of ovarian cancer in southern Chinese women. Nutr Res. 2014; 34: 302–307. 10.1016/j.nutres.2014.02.005 [DOI] [PubMed] [Google Scholar]
- 37.Neill AS, Ibiebele TI, Lahmann PH, Hughes MC, Nagle CM, Webb PM; Australian Ovarian Cancer Study Group and Australian National Endometrial Cancer Study Group.Dietary phyto-oestrogens and the risk of ovarian and endometrial cancers: findings from two Australian case-control studies. Br J Nutr. 2014; 111: 1430–1440. [DOI] [PubMed] [Google Scholar]
- 38.Bandera EV, King M, Chandran U, Paddock LE, Rodriguez-Rodriguez L, Olson SH. Phytoestrogen consumption from foods and supplements and epithelial ovarian cancer risk: a population-based case control study. BMC Womens Health. 2011; 11: 40 10.1186/1472-6874-11-40 [DOI] [PMC free article] [PubMed] [Google Scholar]
- 39.Kumar S, Pandey AK. Chemistry and biological activities of flavonoids: an overview. Scientific World Journal. 2013; 2013:162750 10.1155/2013/162750 [DOI] [PMC free article] [PubMed] [Google Scholar]
- 40.Hwang KA, Park MA, Kang NH, Yi BR, Hyun SH, Jeung EB, Choi KC. Anticancer effect of genistein on BG-1 ovarian cancer growth induced by 17 β-estradiol or bisphenol A via the suppression of the crosstalk between estrogen receptor α and insulin-like growth factor-1 receptor signaling pathways.Toxicol Appl Pharmacol. 2013; 272: 637–646. 10.1016/j.taap.2013.07.027 [DOI] [PubMed] [Google Scholar]
- 41.Kulbe H, Thompson R, Wilson JL, Robinson S, Hagemann T, Fatah R, Gould D, Ayhan A, Balkwill F. The inflammatory cytokine tumor necrosis factor-alpha generates an autocrine tumor-promoting network in epithelial ovarian cancer cells. Cancer Res. 2007; 67: 585–592. [DOI] [PMC free article] [PubMed] [Google Scholar]
- 42.Coward J, Kulbe H, Chakravarty P, Leader D, Vassileva V, Leinster DA, Thompson R, Schioppa T, Nemeth J, Vermeulen J, Singh N, Avril N, Cummings J, Rexhepaj E, Jirström K, Gallagher WM, Brennan DJ, McNeish IA, Balkwill FR. Interleukin-6 as a therapeutic target in human ovarian cancer. Clin Cancer Res. 2011; 17: 6083–6096. 10.1158/1078-0432.CCR-11-0945 [DOI] [PMC free article] [PubMed] [Google Scholar]
- 43.Wang Y, Niu XL, Qu Y, Wu J, Zhu YQ, Sun WJ, Li LZ. Autocrine production of interleukin-6 confers cisplatin and paclitaxel resistance in ovarian cancer cells. Cancer Lett. 2010; 295: 110–123. 10.1016/j.canlet.2010.02.019 [DOI] [PubMed] [Google Scholar]
- 44.Chen X, Anderson JJ. Isoflavones inhibit proliferation of ovarian cancer cells in vitro via an estrogen receptor-dependent pathway. Nutr Cancer. 2001; 41:165–171. [DOI] [PubMed] [Google Scholar]
- 45.Hwang KA, Park MA, Kang NH, Yi BR, Hyun SH, Jeung EB, Choi KC. Anticancer effect of genistein on BG-1 ovarian cancer growth induced by 17 β-estradiol or bisphenol A via the suppression of the crosstalk between estrogen receptor α and insulin-like growth factor-1 receptor signaling pathways.Toxicol Appl Pharmacol. 2013; 272: 637–646. 10.1016/j.taap.2013.07.027 [DOI] [PubMed] [Google Scholar]
- 46.Kontopantelis E, Springate DA, Reeves D. A re-analysis of the Cochrane Library data: the dangers of unobserved heterogeneity in meta-analyses. PLoS One. 2013; 8: e69930 10.1371/journal.pone.0069930 [DOI] [PMC free article] [PubMed] [Google Scholar]
- 47.Michal K, David A. S, Evangelos K. Publication bias in meta-analyses from the Cochrane Database of Systematic Reviews. Statist. Med. 2015; 34: 2781–2795. [DOI] [PubMed] [Google Scholar]
Associated Data
This section collects any data citations, data availability statements, or supplementary materials included in this article.
Supplementary Materials
(DOC)
(DOC)
(DOC)
Data Availability Statement
All relevant data are within the paper.