Abstract
Limited data exist on the pharmacokinetic-pharmacodynamic (PK-PD) parameters of the bactericidal activities of the available antimycobacterial drugs. We report on the PK-PD relationships for isoniazid. Isoniazid exhibited concentration (C)-dependent killing of Mycobacterium tuberculosis H37Rv in vitro, with a maximum reduction of 4 log10 CFU/ml. In these studies, 50% of the maximum effect was achieved at a C/MIC ratio of 0.5, and the maximum effect did not increase with exposure times of up to 21 days. Conversely, isoniazid produced less than a 0.5-log10 CFU/ml reduction in two different intracellular infection models (J774A.1 murine macrophages and whole human blood). In a murine model of aerosol infection, isoniazid therapy for 6 days produced a reduction of 1.4 log10 CFU/lung. Dose fractionation studies demonstrated that the 24-h area under the concentration-time curve/MIC (r2 = 0.83) correlated best with the bactericidal efficacy, followed by the maximum concentration of drug in serum/MIC (r2 = 0.73).
No new drugs for the treatment of tuberculosis have been registered in the last 40 years. Discovery of new antimycobacterial agents is in part limited by the laborious and slow nature of the in vitro and in vivo studies required. Knowledge of the pharmacokinetic (PK)-pharmacodynamic (PD) properties of candidate drugs could be used to facilitate drug discovery and evaluation of the effects of combinations of agents. As a step toward such a strategy, we have recently identified the PK-PD parameter that correlated with the in vivo efficacy of rifampin in a murine aerosol model of tuberculosis (7). In the present study, we have extended this work to include isoniazid.
MATERIALS AND METHODS
Reagents.
Isoniazid (lot 36H1179) and carboxymethyl cellulose (lot 77H1077) were purchased from Sigma, St. Louis, Mo. Isoniazid stock solutions were prepared in 100% dimethyl sulfoxide (DMSO; Sigma) and diluted in normal saline prior to final use. ETDA (lot 5-4514) was purchased from Hi-Media Labs, Mumbai, India. Acetonitrile (high-pressure liquid chromatography [HPLC] grade) and trichloroacetic acid (TCA) were obtained from Spectrochem Pvt. Ltd., Mumbai, India. Cinnamaldehyde (lot 96320) was obtained from Fluka Biochemika, Bucks, Switzerland.
Microbial cultures and cell lines.
Mycobacterium tuberculosis H37Rv (ATCC 27294) and J774A.1 macrophages were prepared for in vitro, macrophage, and animal infection studies by previously described methods (7).
Blood from healthy volunteers.
Group O-positive blood from healthy volunteers collected in citrate phosphate dextrose adenine anticoagulant was obtained from a registered blood bank (TTK Blood Bank, Bangalore, India). It was stored at 4°C and was used for assays up to 1 month from the date of collection.
Animals.
The Institutional Animal Ethics Committee, registered with the Government of India (registration no. CPCSEA 1999/5), approved all experimental protocols with animals and the use of animals. Ethical practices recommend the use of equal numbers of animals of both sexes wherever possible, and since preliminary studies indicated that sex did not influence the outcome of either the PKs or the efficacy of isoniazid, male and female BALB/c mice were used for the PK studies and the efficacy studies, respectively. Six- to 8-week-old mice purchased from National Institute of Nutrition, Hyderabad, India, were randomly assigned to cages with the restriction that the weights of all cage members be within a 1 to 2 g each other. They were allowed 2 weeks of acclimation before intake into experiments. Feed and water were given ad libitum.
MICs in broth and serum.
By using previously described methods (7), the MIC of isoniazid was determined with BACTEC 7H12B medium (broth MIC) or Middlebrook 7H9 medium supplemented with 50% fetal calf serum (serum MIC).
Protein binding.
Protein binding was measured by equilibrium dialysis by previously published procedures (7). The quantification of the isoniazid concentrations in these studies is described as part of the PK methods (see below).
Killing kinetics in vitro.
The kinetics of killing by isoniazid were measured in BACTEC 7H12B broth as described previously (7), followed by plating for CFU enumeration on Middlebrook 7H11 agar plates.
Intracellular killing kinetics.
Killing in J774A.1 macrophages was measured as described previously (7). Studies of killing in whole blood were done by the protocol reported by Wallis et al. (19). In brief, 0.25 ml of human blood that had been collected in citrate phosphate dextrose anticoagulant was combined with an equal volume of a thawed seed lot culture of 105 CFU M. tuberculosis per ml and incubated on a roller at 37°C in 4-ml Corning tubes (Medi-Spec Instruments Pvt. Ltd., Mumbai, India) sealed with screw caps. Twenty-four hours after infection, 0.5 ml of isoniazid-containing solutions in 4% DMSO (final DMSO concentration, 2%) was added and the tubes were further incubated at 37°C. Samples were drawn for plating at the time of drug addition and 48 h after drug addition. The experiment was done in duplicate.
Stability of isoniazid in macrophage cultures.
The stability of isoniazid in uninfected macrophage cultures was determined by estimating the total drug concentration over a 4-day period by HPLC methods at 32 times the MIC (1.6 mg/liter) and 512 times the MIC (25.6 mg/liter) in duplicate flasks containing 4 ml of Dulbecco modified Eagle medium (Gibco-BRL Life Technologies, Gaithersburg, Md.) The total concentration of isoniazid in the macrophage cultures was estimated at time zero (immediately after addition) and at days 2 and 4 after drug addition. For estimation of the drug concentration, the medium containing drug was collected and the monolayers were directly lysed with 1 ml of 0.04% sodium dodecyl sulfate for 3 min to release the intracellular drug. The cell lysate and the medium (extracellular drug) were pooled and extracted by precipitation with 10% TCA. The concentration of isoniazid in the samples was measured by the procedures described below for the PK studies. The total concentration of isoniazid in the samples at different time intervals was calculated from the standard curve of isoniazid concentrations generated previously.
PK measurements.
The concentration of isoniazid in mouse plasma was determined by HPLC assay following TCA precipitation and chemical derivatization with cinnamaldehyde (14). Fifty microliters of plasma containing various concentrations of isoniazid was extracted with 100 μl of 10% TCA for 10 min on a microtube mixer (TOMY, MT-360; Tomy Seiko Co. Ltd., Tokyo, Japan) with the mixing speed set at 7 and centrifuged at 14,000 rpm for 10 min in a tabletop centrifuge (5415C; Eppendorf). One hundred microliters of supernatant was mixed with 30 μl of 0.1% cinnamaldehyde in methanol, and derivatization was carried out for 10 min with shaking, after which 20 μl of 1 M potassium hydroxide was added to the mixture, yielding a total volume of 150 μl, of which 75 μl was injected into the HPLC chromatograph. A Shimadzu HPLC class VP chromatograph with an SCL-10AVP system controller, LC10-AT-VP pumps, and an SPD-10A VP UV detector connected to a SIL-10AD VP autoinjector was used. The mobile phase consisted of acetonitrile and ammonium acetate (10 mM; pH 4.5) at a ratio of 30:70 (vol/vol) and was run under isocratic conditions. The flow rate was 1 ml/min, and the run time was 35 min. Under these conditions derivatized isoniazid eluted at 16.7 min and free cinnamaldehyde eluted at 27 min. Derivatized isoniazid was monitored at 323 nm. A KROMASIL C18 column (250 by 4.6 mm, 5 μm; Flexit Jour Laboratories Pvt. Ltd., Pune, India) was used. Calibration standards for isoniazid were prepared in duplicate in drug-free mouse plasma by using twofold serial dilutions. The calibration curves were linear in the range between 0.02 and 256 mg/liter (r2 = 0.99).
PKs of isoniazid in uninfected mice.
Dose-ranging studies were conducted to determine the PKs of isoniazid when it was administered by oral gavage as a single dose at a dose volume of 10 ml/kg of body weight. The doses used were 0.1, 1, 3, 10, 30, 90, and 120 mg of isoniazid/kg in 0.25% (wt/vol) carboxymethyl cellulose. Blood was collected by retroorbital sinus puncture while the mice were under ether anesthesia and placed in 0.025 ml of 5% EDTA in heparinized capillary tubes at various times ranging from 10 min to 8 h postdosing. Plasma was harvested by centrifugation at 10,000 rpm (Eppendorf 5415C) for 2 min and stored at −70°C until analysis. Three animals were evaluated at each time point. The concentration of isoniazid in plasma was determined by the HPLC assay described above.
PK analyses.
PK analyses were performed with WinNonLin software (version 1.5; Scientific Consulting, Inc.). A noncompartmental analysis program (model 200, noncompartmental analysis for extravascular administration) was used to calculate the values for the PK parameters.
In vivo dose-response studies.
We used an aerosol infection model in which drugs are evaluated following a respiratory infection with low numbers of tubercle bacilli (7, 8). Mice were infected via the inhalation route in an aerosol infection chamber designed and constructed in the Mechanical Engineering Shop, University of Wisconsin—Madison. Four weeks after infection, the mice were dosed daily by mouth with isoniazid at 0, 3, 10, 30, or 90 mg/kg, given 6 days a week for 1 or 2 weeks. At the onset and 24 h after the completion of treatment, groups of mice were killed by exposure to CO2 and the lungs were aseptically removed for homogenization in a final volume of 2.0 ml by use of Teflon-glass tissue grinders (catalogue no. W012576; Wheaton). Each suspension was serially diluted in 10-fold steps, and at least three dilutions were plated on Middlebrook 7H11 agar supplemented with 10% albumin-dextrose-catalase and incubated at 37°C with 5% CO2 for 3 weeks.
Dose-fractionation studies.
Doses were selected for the dose-fractionation study on the basis of the results of the dose-ranging study and the observed linearity of the PK parameters with dose. The total doses selected were 1.8, 6, 18, 36, 54, 72, 126, 180, 360, 540, 900, 1,140, and 2,160 mg/kg. Each total dose was given as 6, 12, or 18 equally divided doses given over 144 h (6 days). Total doses of 900 and 1,140 mg/kg were given only as 12 equally divided doses, and the total dose of 2,160 mg/kg was given as 18 equally divided doses. Those single doses that exceeded the published 50% lethal dose (10) were excluded from the study design. Three mice were used for each regimen. Control mice received saline. Treatment was given for 6 days, after which the counts (CFU) in lungs were measured as described above for the dose-ranging study.
Calculation of PK-PD parameters.
The MIC of isoniazid in serum for the test isolate (0.05 mg/liter; see Results) was used to calculate the PK-PD parameters. The isoniazid concentration (C)/MIC was defined as the ratio of the maximum concentration of drug in serum (Cmax) to the MIC in serum, the area under the concentration-time curve (AUC)/MIC was defined as the ratio of AUC to the MIC in serum for the entire treatment period of 144 h divided by 6 to yield a 24-h AUC/MIC (AUC24/MIC), and the percentage of time above the MIC (T > MIC; estimated by the first-order kinetics equation C = C0e−kt, where C0 is the concentration at time zero, k is a constant, and t is time) was defined as the percentage of the time over 144 h that the concentration of isoniazid exceeded the MIC in serum.
Statistical analysis.
The colony counts obtained by plating were transformed to log10(X + 1), where X equals the total number of viable tubercle bacilli calculated to be present in a given sample. Nonlinear regression (curve-fitting) analysis by use of an inhibitory sigmoid Emax response model with or without constants was performed with the in vitro and in vivo killing data. Prism software (version 3; GraphPad Software, Inc., San Diego, Calif.) was used for all the calculations described above. A 1-log10 CFU killing effect (E) was calculated from the dose-response curves by use of the following equation: E = E0 − {Emax (x)N/[(EC50)N + (x)N]}, where E is the log10 CFU at any given concentration, E0 is the log10 numbers of CFU with zero drug, Emax is the lowest log10 numbers of CFU achieved following treatment, N is the Hill slope, and x is the C/MIC ratio or the AUC/MIC ratio.
RESULTS
MIC in serum and serum protein binding.
The MIC of isoniazid in both BACTEC 7H12B broth and serum was 0.05 mg/liter. The levels of plasma protein binding by isoniazid were 48 and 42% at 5 and 10 times the MIC in broth, respectively.
In vitro killing kinetics.
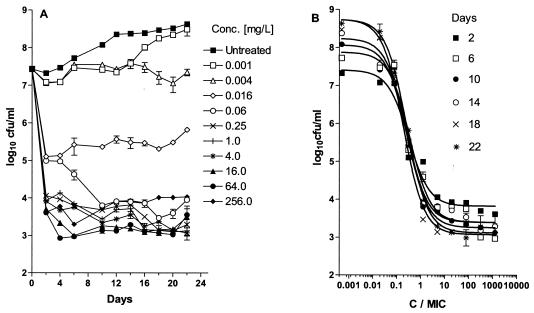
Isoniazid exhibited concentration-dependent killing of extracellular M. tuberculosis, with a maximum reduction of 4 log10 CFU/ml. The Emax and the C/MIC at which 50% of Emax was achieved remained constant at 4 log10 CFU/ml and 0.4, respectively, from day 1 to day 22 (Fig. 1). In vitro killing of M. tuberculosis was described by the equation E = (7.43 log10 CFU/ml) − {[(4 log10 CFU/ml) (C/MIC)]/[0.4 + (C/MIC)]}.
FIG. 1.
(A) Growth of M. tuberculosis in BACTEC 7H12B broth following exposure to increasing concentrations of isoniazid; (B) effect of increasing C/MIC ratios on the bactericidal activity of isoniazid on days 2 (r2 = 0.97), 6 (r2 = 0.96), 10 (r2 = 0.97), 14 (r2 = 0.97), 18 (r2 = 0.98), and 22 (r2 = 0.97) after drug addition. Each point represents the mean ± standard deviation of triplicate values. The bactericidal effect is calculated on the basis of the initial inoculum prior to the addition of isoniazid.
Intracellular killing kinetics. (i) J774.A macrophage assay.
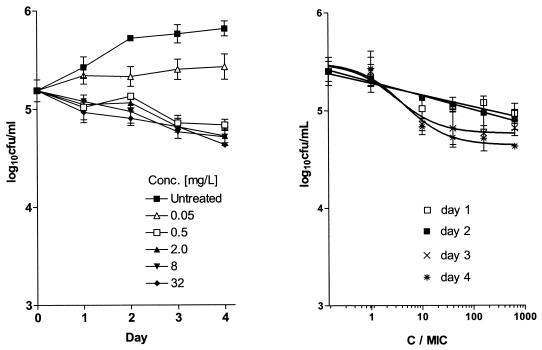
Although the growth of M. tuberculosis in J774.A macrophages was inhibited by isoniazid at 0.05 mg/liter, isoniazid did not exhibit significant killing of M. tuberculosis even at a concentration of 32 mg/liter (640-fold above the inhibitory concentration) (Fig. 2). In this assay, a maximum reduction of 0.5 log10 CFU/ml was achieved on day 4.
FIG. 2.
(A) Course of infection in the J774A.1 murine macrophage cell line following exposure to increasing concentrations of isoniazid. Drug was added at 2 h postinfection. (B) Effects of increasing C/MIC ratios on the intracellular bactericidal activity of isoniazid against M. tuberculosis in the J774A.1 murine macrophage cell line on days 1 (r2 = 0.87), 2 (r2 = 0.99), 3 (r2 = 0.88), and 4 (r2 = 0.91) after drug addition. Each point represents the mean ± standard deviation of triplicate values. The bactericidal effect is calculated on the basis of the initial inoculum prior to addition of isoniazid.
(ii) Whole-blood assay.
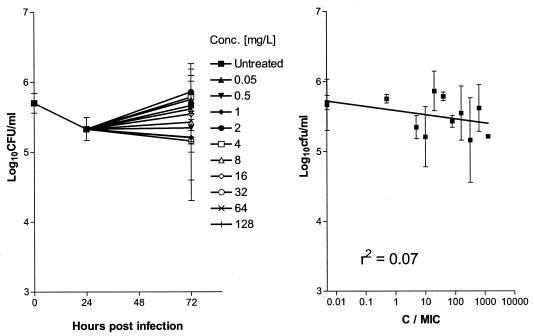
In the assay with whole blood, isoniazid showed no bactericidal activity when it was tested at concentrations up to 128 mg/liter (Fig. 3).
FIG. 3.
(A) Course of infection in human whole blood following exposure to increasing concentrations of isoniazid. Drug was added at 1 day postinfection. (B) Effects of increasing C/MIC ratios on the intracellular bactericidal activity of isoniazid against M. tuberculosis in whole blood 2 days after drug addition. Each point represents the mean ± standard deviation of triplicate values. The bactericidal effect is calculated on the basis of the initial inoculum prior to addition of isoniazid.
Stability of isoniazid in J774A.1 cells.
On the basis of the percentage of isoniazid recovered in relation to the amount estimated to be present immediately after drug addition to an uninfected macrophage monolayer, isoniazid was stable over a 4-day period (Table 1).
TABLE 1.
Stability of isoniazid in an uninfected macrophage monolayer after 4 days of exposure to 32 and 256 times the MIC
| Expected concn
|
Estimated concn (mg/liter)
|
|||
|---|---|---|---|---|
| mg/liter | Multiple of MIC | Day 0 | Day 2 | Day 4 |
| 1.6 | 32 | 1.57 (100)a | 1.67 (106) | 1.63 (104) |
| 25.6 | 512 | 21.35 (100) | 23.68 (111) | 23.89 (112) |
The values in parentheses are the percentage of drug remaining compared to the concentration on day 0.
Single-dose PKs of isoniazid in uninfected male BALB/c mice.
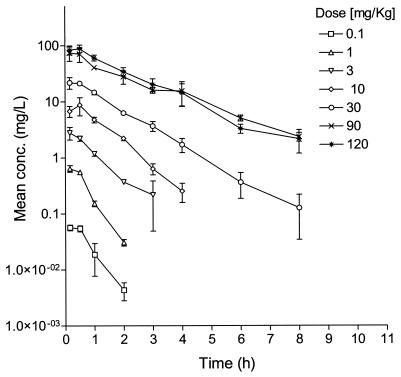
Isoniazid displayed linear PKs at single doses between 0.1 and 120 mg/kg. The time to Cmax of isoniazid ranged from 0.16 to 0.5 h, and the terminal elimination half-life ranged from 0.4 and 1.6 h (Fig. 4).
FIG. 4.
Single-dose concentration-versus-time PK profiles for incremental oral doses of isoniazid in uninfected BALB/c mice. The symbols and the error bars indicate the mean ± standard deviation, respectively.
Dose-response studies.
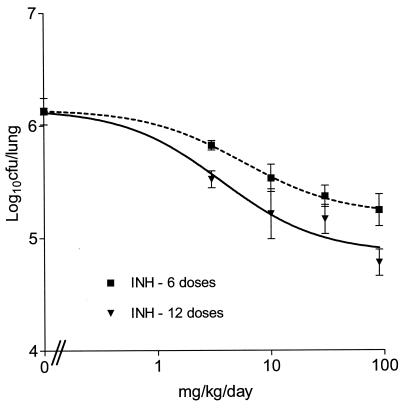
On the basis of our previous work (7), dosing was initiated 4 weeks after infection, which is the time that coincides with late log phase in vivo, in which the bacterial load reaches 106 CFU/lung. Figure 5 shows the effects observed over the entire dose range. The maximum effect of a reduction of approximately 1.0 log10 CFU/lung was observed at 90 mg/kg. In addition, the CFU reductions seen after dosing for 12 days were not statistically different from those seen after 6 days (P > 0.05 for each dose for the two durations).
FIG. 5.
Relationship between the total dose and the log10 CFU per lung (mean ± standard deviation). Mice were dosed once daily for either 6 days (r2 = 0.74) or 12 days (r2 = 0.78).
Dose-fractionation studies.
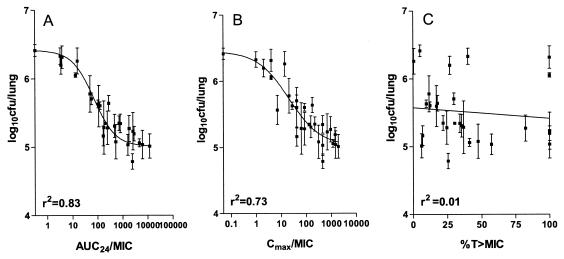
Since the difference in the maximum effect observed between 6 and 12 doses was not significant (P > 0.05), the duration of the dose-fractionation experiment was fixed at 6 days. Figure 6 shows the relationships between log10 CFU per lung and the three PD parameters. AUC24/MIC showed the highest correlation with bactericidal activity {r2 = 0.83; best-fit equation of E = 6.37 log10 CFU/lung − [1.3 log10 CFU/lung (AUC/MIC)]/63 + (AUC/MIC)} (Fig. 6A). The fit for C/MIC was less (r2 = 0.73; Fig. 6B), and percent T > MIC showed a poor correlation (r2 = 0.01; Fig. 6C). The maximum bactericidal effect of isoniazid on M. tuberculosis observed in this model was 1.4 log10 CFU/lung.
FIG. 6.
Relationship between AUC24/MIC (A), Cmax/MIC (B), and percent T > MIC of isoniazid (C) and log10CFU/lung of M. tuberculosis (mean ± standard deviation) when the total dose of is given as 6, 12, or 18 equally divided doses in 144 h.
DISCUSSION
Whereas the PK-PD parameters for antibacterial agents are reasonably well characterized (2), the PK-PD relationships for antimycobacterial agents are only now beginning to be fully characterized (7). Several studies have been conducted with isoniazid to evaluate its bactericidal and sterilizing efficacies in mice (3, 5, 9) and guinea pigs (17). However, it is difficult to identify from those studies the PD parameter that best describes its efficacy. Our objectives were to identify the PD parameter(s) for isoniazid that describes its bactericidal efficacy in an aerosol infection model of tuberculosis in mice.
In our experiments, isoniazid displayed concentration-dependent killing of extracellular M. tuberculosis that was independent of the duration of exposure. Although prior work by Armstrong (1) reported that killing was related to the product of concentration and time, that study used a qualitative assessment of killing rather than the quantitative measures used in the present study.
We observed that the maximal effect (reduction, approximately 4 log10 CFU/ml) and the concentration required for 50% of the maximal effect (C/MIC, 0.5) remained unchanged even when the C/MIC was increased to 5,120. In addition, all of the observed effect accrued during the first 2 days of drug exposure. Subsequently, the effect was bacteriostatic and independent of an increase in the concentration. One explanation for this could be that only the actively growing bacilli were killed very rapidly within the first 48 h and the residual bacterial population was nonreplicating and thus was unaffected by isoniazid (6, 11). These results are different from the bactericidal effect of rifampin, in which there was complete eradication (reduction, >5 log10 CFU/ml) within the first 2 days, although the 50% maximal effect required a C/MIC ratio up to 100-fold higher than that for isoniazid (7). Our in vitro killing data for isoniazid are consistent with the observed early bactericidal activity of isoniazid in patients with strongly positive sputum smears (4): the bactericidal effect seen during days 2 to 14 was not as profound as that seen during the first 2 days of therapy.
In contrast to its effect on extracellular bacilli, the activity of isoniazid against bacilli actively replicating in the macrophage was drastically diminished. Although stasis was seen at a drug concentration equal to the MIC in broth, the maximum killing achieved was a reduction of approximately 0.5 ml log10 CFU/ml even when the external concentration was maintained at 32 mg/liter for 4 days. The rates of killing were the same between C/MICs of 10 and 640, indicating that isoniazid produced only a bacteriostatic effect on the intracellular bacteria.
The fact that isoniazid was bacteriostatic and yet not completely ineffective in the intracellular models is intriguing, since it indicated that isoniazid did come into contact with the bacilli without producing killing. It is possible that at the phagolysosomal location of M. tuberculosis in the macrophage the pH is not optimal for the bactericidal action of isoniazid (15). Although it is possible that the bacilli were not rapidly dividing within the macrophage and thus were refractory to the bactericidal mechanisms of isoniazid, our growth curve experiments (Fig. 2) show that in the absence of isoniazid there was a 0.7 log increase in CFU over a 3-day period, which is a greater increase than that observed in the BACTEC 7H12B broth-based killing experiments, in which drug exposure was started at the late log or early stationary phase. We have also ruled out the possibility that the bacteriostatic effect of isoniazid is due to instability of the drug. Our findings are in agreement with those reported by Rastogi et al. (13) but are in sharp contrast to the data reported by Orme and colleagues (16), in which a reduction of 3 log10 CFU/ml over a narrow concentration range between 0 and 1 mg of isoniazid per liter was observed with intracellular M. tuberculosis Erdman in murine macrophages.
The whole-blood system has advantages over a macrophage monolayer system; for example, plasma protein binding and immune components can be factored in, thereby mimicking the in vivo situation closely (18). Furthermore, exposures up to 2,560-fold higher than the concentration producing stasis can be studied in comparison to the exposures possible in the macrophage monolayer system (640-fold higher). Despite the higher exposures achieved in the whole-blood system, isoniazid remained bacteriostatic with increasing concentrations over a 2-day period. This is in contrast to the 2-log10 CFU/ml reduction reported by Wallis et al. (19). This difference could be due to differences in the measure of killing. Whereas our analysis was based on a direct measure of the numbers of surviving CFU, Wallis et al. (19) used a surrogate measure for CFU that was based on the metabolism of radiolabeled palmitate. Such an indirect approach may make a bacteriostatic effect appear to be cidal since the bacteria may not be metabolizing, even though they remain alive.
AUC24/MIC was the PK-PD parameter that best described the bactericidal activity of isoniazid in the mouse model, with a correlation of 0.83. The maximal effect of a 1.3-log10 CFU/lung reduction was seen at an AUC24/MIC of approximately 500. Stated differently, the effect of isoniazid was the same when the total dose was given as 6, 12, or 18 equally divided doses over a period of 1 week. Consistent with our data, Mitchison (12) observed that the efficacy of a fixed total dose of isoniazid in infected guinea pigs was similar whether it was given daily, every 2 days, or every 4 days over a period of 6 weeks. Thus, the efficacy of isoniazid is dependent only on the dose size and not the regimen.
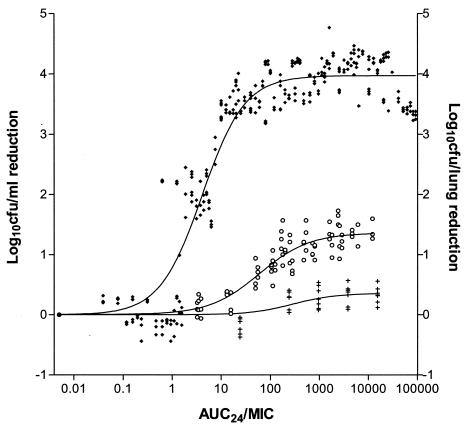
While the killing kinetics in broth suggested the PK-PD driver, the intracellular infection models better predicted the magnitude of the effect in vivo (Fig. 7). This is consistent with the relationships observed for rifampin as well, in which a significant bactericidal effect in macrophages correlated with the bactericidal effect seen in mice (7).
FIG. 7.
Comparison of the magnitude of AUC24/MIC for the bactericidal effect of isoniazid in vitro (♦), in infected macrophage monolayers (+), or in vivo (○) following 4 to 6 days of exposure. AUC24/MIC is defined as follows: (C × T)/MIC in broth for the in vitro and macrophage studies and AUC24/MIC in serum for the in vivo studies. Each datum point represents an individual replicate.
In summary, we have identified the PD parameter that dictates the bactericidal efficacy of isoniazid in the murine model. This study further provides a PK-PD basis for progressing lead compounds in the drug discovery process.
REFERENCES
- 1.Armstrong, A. R. 1965. Further studies on the time/concentration relationships of isoniazid and tubercle bacilli in vitro. Am. Rev. Respir. Dis. 91:440-443. [DOI] [PubMed] [Google Scholar]
- 2.Craig, W. A. 2001. Does the dose matter? Clin. Infect. Dis. 33:S233-S237. [DOI] [PubMed] [Google Scholar]
- 3.Cynamon, M. H., S. P. Klemens, C. A. Sharpe, and S. Chase. 1999. Activities of several novel oxazolidinones against Mycobacterium tuberculosis in a murine model. Antimicrob. Agents Chemother. 43:1189-1191. [DOI] [PMC free article] [PubMed] [Google Scholar]
- 4.Donald, P. R., F. A. Sirgel, F. J. Botha, H. I. Seifart, D. P. Parkin, M. L. Vandenplas, B. W. Van De Wal, J. S. Maritz, and D. A. Mitchison. 1997. The early bactericidal activity of isoniazid related to its dose size in pulmonary tuberculosis. Am. J. Respir. Crit. Care Med. 156:895-900. [DOI] [PubMed] [Google Scholar]
- 5.Grosset J., C. Truffot-Pernot, C. Lacroix, and B. Ji. 1992. Antagonism between isoniazid and the combination pyrazinamide-rifampin against tuberculosis infection in mice. Antimicrob. Agents Chemother. 36:548-551. [DOI] [PMC free article] [PubMed] [Google Scholar]
- 6.Herbert, D., C. N. Paramasivan, P. Venkatesan, G. Kubendiran, R. Prabhakar, and D. A. Mitchison. 1996. Bactericidal action of ofloxacin, sulbactam-ampicillin, rifampin, and isoniazid on logarithmic- and stationary-phase cultures of Mycobacterium tuberculosis. Antimicrob. Agents Chemother. 40:2296-2299. [DOI] [PMC free article] [PubMed] [Google Scholar]
- 7.Jayaram, R., S. Gaonkar, P. Kaur, B. L. Suresh, B. N. Mahesh, R. Jayashree, V. Nandi, S. Bharat, R. K. Shandil, E. Kantharaj, and V. Balasubramanian. 2003. Pharmacokinetics-pharmacodynamics of rifampin in an aerosol infection model of tuberculosis. Antimicrob. Agents Chemother. 47:2118-2124. [DOI] [PMC free article] [PubMed] [Google Scholar]
- 8.Kelly, B. P., S. K. Furney, M. T. Jessen, and I. M. Orme. 1996. Low-dose aerosol infection model for testing drugs for efficacy against Mycobacterium tuberculosis. Antimicrob. Agents Chemother. 40:2809-2812. [DOI] [PMC free article] [PubMed] [Google Scholar]
- 9.Kradolfer, F., and R. Schnell. 1971. The combination of rifampicin and other antituberculosis agents in chronic murine tuberculosis. Chemotherapy (Basel) 16:173-182. [DOI] [PubMed] [Google Scholar]
- 10.Merck & Co., Inc. 1997. Merck index, 9th ed. Merck & Co., Inc., Whitehouse Station, N.J.
- 11.Mitchison, D. A. 2000. Role of individual drugs in the chemotherapy of tuberculosis. Int. J. Tuberc. Lung Dis. 4:796-806. [PubMed] [Google Scholar]
- 12.Mitchison, D. A. 1979. Basic mechanisms of chemotherapy. Chest 76:771-781. [DOI] [PubMed] [Google Scholar]
- 13.Rastogi, N., M. Potar, and H. L. David. 1987. Intracellular growth of pathogenic mycobacteria in the murine macrophage cell line J-774: ultrastructure and drug susceptibility studies. Curr. Microbiol. 16:79-82. [Google Scholar]
- 14.Seifart, H. I., W. L. Gent, D. P. Parkin, P. P. van Jaarsveld, and P. R. Donald. 1995. High-performance liquid chromatographic determination of isoniazid, acetylisoniazid and hydrazine in biological fluids. J. Chromatogr. B Biomed. Appl. 674:269-275. [DOI] [PubMed] [Google Scholar]
- 15.Seral, C., F. Van Bambeke, and P. M. Tulkens. 2003. Quantitative analysis of gentamicin, azithromycin, telithromycin, ciprofloxacin, moxifloxacin, and oritavancin (LY333328) activities against intracellular Staphylococcus aureus in mouse J774 macrophages. Antimicrob. Agents Chemother. 47:2283-2292. [DOI] [PMC free article] [PubMed] [Google Scholar]
- 16.Skinner, P. A., S. K. Furney, D. A. Kleinert, and I. M. Orme. 1995. Comparison of activities of fluoroquinolones in murine macrophages infected with Mycobacterium tuberculosis. Antimicrob. Agents Chemother. 39:750-775. [DOI] [PMC free article] [PubMed] [Google Scholar]
- 17.Smith, D. W., V. Balasubramanian, and E. Wiegeshaus. 1991. A guinea pig model of experimental airborne tuberculosis for evaluation of the response to chemotherapy: the effect on bacilli in the initial phase of treatment. Tubercle 72:223-231. [DOI] [PubMed] [Google Scholar]
- 18.Wallis, R. S., S. A. Vinhas, J. L. Johnson, F. C. Ribeiro, M. Palaci, R. L. Peres, R. T. Sa, R. Dietze, A. Chiunda, K. Eisenach, and J. J. Ellner. 2003. Whole blood bactericidal activity during treatment of pulmonary tuberculosis. J. Infect. Dis. 187:270-278. [DOI] [PubMed] [Google Scholar]
- 19.Wallis, R. S., M. Palaci, S. Vinhas, A. G. Hise, F. C. Ribeiro, K. Landen, S. Cheon, H. Song, and J. J. Ellner. 2001. A whole blood bactericidal assay for tuberculosis. J. Infect. Dis. 183:1300-1303. [DOI] [PubMed] [Google Scholar]


