Abstract
Magnetic gold nanoclusters (MGNCs) functionalized with 4-dimethylaminopyridine (DMAP) enables the trace detection of tetrabromobisphenol A (TBBPA), an environmental pollutant, using surface-enhanced Raman scattering (SERS) spectroscopy. The synthesis, cleansing, and functionalization of MGNCs are conducted in aqueous solutions; SERS samples are prepared by magnetic precipitation in the presence of trace analyte. The limit of detection (LOD) for TBBPA is greatly increased by the use of DMAP as a reporter molecule: DMAP-modified MGNCs can detect TBBPA at 10 pM in water, whereas the LOD for TBBPA by unfunctionalized Au is 1 nM. The reproducibility of picomolar TBBPA detection with DMAP-modified MGNCs is confirmed by two-dimensional correlation analysis. The high SERS sensitivity for TBBPA can be attributed to its capacity to modulate the Raman spectrum of adsorbed DMAP. This indirect mode of detection can also be applied toward the detection of other hydrophobic analytes, each identifiable by its characteristic SERS identity.
Graphical Abstract
Hydrophobic analytes are detected at picomolar levels by modulating the surfaceenhanced Raman scattering spectra of 4-dimethylaminopyridine on magnetic gold nanoclusters.

Surface-enhanced Raman scattering (SERS) has excellent potential for the trace detection of environmental contaminants, due to its high sensitivity and information content.1,2,3 Examples include chemical biomarkers (dipicolinic acid), neurotoxins (methyl parathion, diethylphosphoramidate), and narcotics (ketamine), all of which can be detected at ppm levels or lower using nanostructured Au substrates.4,5,6 SERS is especially appreciated for its ability to detect trace levels of di- and trinitrotoluene, both in aqueous solution (1–2 pM)7,8 and in the vapor phase (5 ppb).9
Magnetically active Au and Ag nanoclusters can further improve the sensitivity of SERS-based detection,10,11,12,13,14,15,16 by combining the effects of magnetophoretic concentration and the generation of “hot spots” that amplify local electromagnetic field effects.17,18,19 Recent studies have shown that magnetically active SERS substrates can be used to detect trace analytes in aqueous solution; for example, core–shell Fe3O4@Ag nanoparticles are able to detect organic pollutants at picomolar levels.10 The types of compounds that can be detected at trace levels by SERS are limited only by their affinity for the substrate; typical adsorbates that are easily detected are either planar aromatic compounds, or possess functional groups that stabilize their adsorption to the metal surface.
One way to improve both the range and sensitivity of analyte detection by SERS is to use a supramolecular approach toward surface adsorption.i Numerous studies have established that supramolecular interactions can be synergistic with SERS-based detection,20,21,22 although the enhancements tend to be rather modest. Further increases in sensitivity can be achieved if analyte–receptor adsorption can be correlated with “hot spot” formation.23,24,25 Receptor-modified SERS substrates also enable one to detect supramolecular adsorption based on changes in the Raman signature of the surface-bound receptor, whose peaks can be much more intense than that of the analyte.
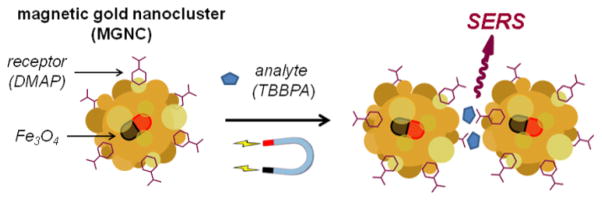
Here we present a practical method for preparing aqueous suspensions of MGNCs with strong SERS activity when coated with 4-dimethylaminopyridine, or DMAP (Figure 1). This compound becomes polarized upon adsorption and imparts an amphiphilic character to metal surfaces,26 and has been used to facilitate the transfer of AuNPs from aqueous to organic phases.27,28 In our study, we demonstrate the capacity of DMAP-coated MGNCs to enhance the trace detection of several persistent organic pollutants in water, some of which have not been reported previously as analytes for SERS. This includes tetrabromobisphenol A (TBBPA), a widely used flame retardant that has been associated with thyroid and neurotoxicity,29,30 and is currently under watch as an environmental hazard.
Figure 1.
Trace analyte detection using magnetic gold nanoclusters (MGNCs) as field-responsive SERS substrates.
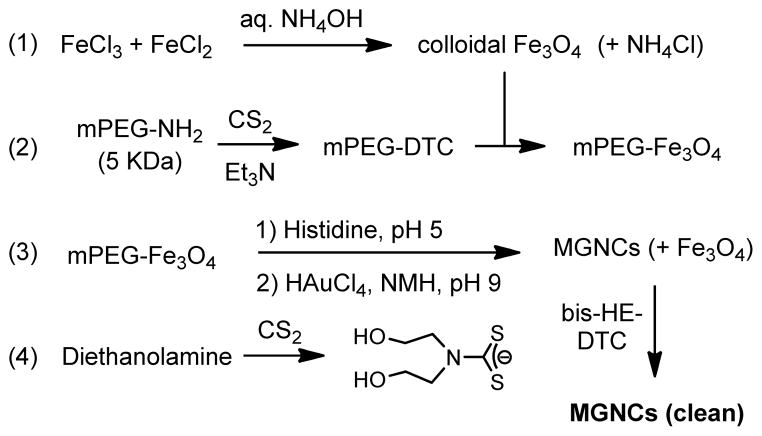
An expedient synthesis of MGNCs was developed according to Scheme 1. Fe3O4 nuclei (6–10 nm) were prepared by co-precipitation from FeCl2 and FeCl3 in deaerated water, and treated with 28 wt% NH4OH while immersed in an ultrasonic bath (Step 1; see ESI for details). Colloidal Fe3O4 was subjected to several rounds of magnetic precipitation and redispersion in water, then treated with methyl(polyethylene-glycol)dithiocarbamate (mPEG-DTC, 5 kDa) to enhance dispersion stability. mPEG-DTC was generated in situ by adding CS2 to mPEG-NH2 in methanol (Step 2; see ESI).31,32
Scheme 1.
Synthesis of magnetic gold nanoclusters (MGNCs), with treatment by bis-HE-DTC to remove residual Fe3O4. DTC = dithiocarbamate; HE = hydroxyethyl; NMH = N-methylhydroxylamine.
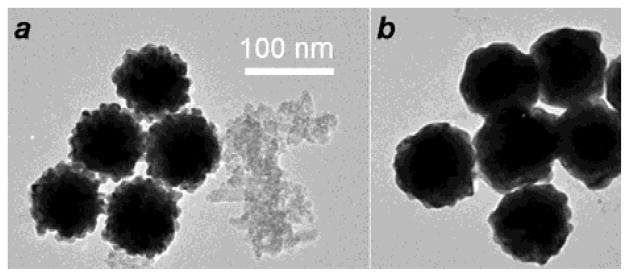
MGNC formation was achieved by dispersing mPEG-coated Fe3O4 in a solution of histidine (6.5 mM, pH 5–6), followed by successive treatment with AuCl4 (9 mM, pH 9–10) and a mild reducing agent such as N-methylhydroxylamine (NMH; 20 mM). The mixture was shaken by hand during NMH addition, then allowed to sit for 24 hours for complete reduction (Step 3; see ESI). Both mPEG-DTC and histidine were necessary to integrate the magnetic and plasmonic components; reductions performed in the absence of either reagent did not result in magnetically active gold NPs. TEM images of the as-formed MGNCs revealed raspberry-like globules with a median size of 95 nm, in addition to residual iron oxide (Fig. 2a). The latter was readily removed by treating the colloidal mixture for 30 min with bis(2-hydroxyethyl)DTC, prepared in situ from diethanolamine and CS2 (Step 4),32 which smoothened the MGNC surfaces with minimal effect on particle size (Fig. 2b). ICP-MS analysis of the MGNCs indicated a Fe:Au mole ratio of 0.03, much lower than the initial ratio of 0.9; nevertheless, the MGNCs responded readily to the field gradients of a handheld magnet, and were highly scattering at red and near-infrared wavelengths (see ESI).
Figure 2.
TEM images of (a) as-formed MGNCs with residual iron oxide, and (b) MGNCs after treatment with bis-HE-DTC.
SERS analyses were performed by dispersing passivated MGNCs for 1 hour in aqueous analyte solutions, followed by magnetic precipitation and redispersion in pure water. These were deposited onto quartz substrates and dried prior to analysis with a confocal Raman microscope using 785 nm excitation.23,33 MGNCs passivated with bis-HE-DTC produced only weak Raman signals between 700 and 1300 cm−1, with minimal background interference during analyte detection.
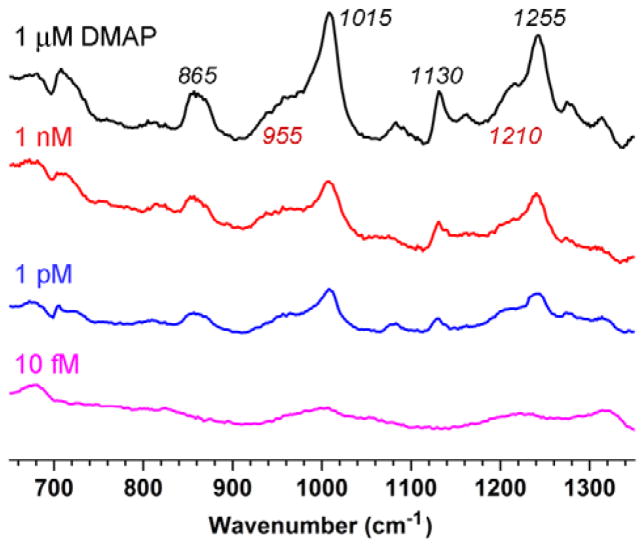
To determine the limit of detection (LOD) using the SERS sampling conditions above, MGNCs were dispersed and collected from aqueous solutions of candidate adsorbates. From this screening, we found DMAP to be an excellent reporter molecule, with a unique Raman fingerprint in the window of interest and a LOD at 1 pM (Fig. 3). The polarizable character of DMAP may result in charge-transfer interactions with the metal surface, an important mechanism for Raman signal enhancement.34 The highest level of SERS reproducibility was obtained with 1 nM DMAP, based on 44 datasets collected from six different batches of MGNCs (see ESI).†
Figure 3.
SERS spectra of DMAP adsorbed onto MGNCs at various initial concentrations. Clean MGNCs (2 mg/mL) were dispersed in aqueous DMAP solutions for 1 h, then washed once and deposited onto quartz substrates. Raman spectra were acquired in air (λex=785 nm, 20 mW at the sample, 100 sec exposure). The signals in the bottom SERS spectrum are presumably related to bis-HE-DTC passivation.
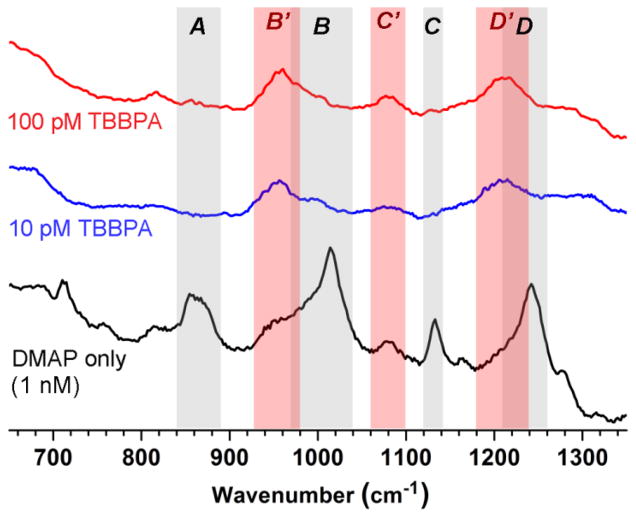
To test their capacity for trace analyte detection, DMAP-modified MGNCs were dispersed into aqueous solutions of TBPPA, then collected and subjected to SERS analysis as before. Again, these MGNCs formed stable dispersions at 2 mg/mL, but were easily collected by a handheld magnet. The SERS spectra of DMAP-modified MGNCs were modulated by exposure to TBBPA (Fig. 4): Raman bands centered at 860, 1015, 1130, and 1255 cm−1 (A–D) were suppressed by TBBPA adsorption, while bands centered at 955 and 1210 cm−1 (B′, D′) experienced modest increases.
Figure 4.
Intensity-averaged SERS spectra of DMAP-modified MGNCs exposed to 100 pM TBBPA (N=42, red), 10 pM TBBPA (N=11, blue), or pure water (N=44, black). MGNCs were redispersed in analyte solution for 1 h then isolated by magnetic precipitation; Raman spectra were acquired in air (λex=785 nm, 20 mW at the sample, 100 sec exposure). TBBPA adsorption caused the suppression of several Raman bands assigned to DMAP (A–D; grey), while other bands were retained or strengthened (B′–D′; light red).
The LOD for TBBPA detection in water by SERS signal modulation was determined to be 10 pM (see below). Changes in the spectra of DMAP-coated MGNCs were effectively saturated at TBBPA concentrations above 100 pM, whereas exposure to 10 pM TBBPA caused only partial suppression of Raman bands B and D (Fig. 4), and exposure to 1 pM TBBPA did not produce significant changes in the SERS spectrum (data not shown). In comparison, the LOD of TBBPA detection by HPLC is 100 pM after extraction into organic media.35
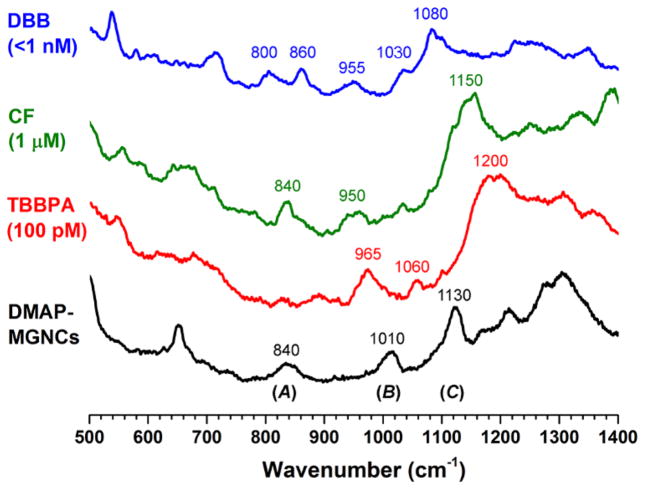
Remarkably, SERS signals from TBBPA itself could hardly be detected by MGNCs at trace levels. A control study using cleansed MGNC’s and 1 nM TBBPA in the absence of DMAP did not yield any detectable peaks (Fig. S8a, ESI). This was further confirmed by performing SERS analysis with freshly prepared nanoporous gold leaf:24 while treatment with TBBPA produced a unique spectral profile down to 1 nM (Fig. 5), the peakset could not be resolved in any SERS spectra produced from MGNCs treated with TBBPA, although the Raman signals from DMAP-coated MGNCs were clearly modulated. We therefore consider TBBPA detection via modulation of DMAP signals to be at least 100 times more sensitive than by direct analysis using unfunctionalized SERS substrates.
Figure 5.
SERS spectra of freshly prepared nanoporous gold (NPG) treated with 1 μM TBBPA in 50% MeOH (blue; * = peaks unique to TBBPA); NPG treated with 1 nM TBBPA (green); DMAP-modified MGNCs treated with 100 pM TBBPA (red); DMAP-modified MGNCs recovered from water (black). Bands B′–D′ (light red) correspond with modulation of Raman signals from DMAP-coated MGNCs by TBBPA. Raman spectra acquired in air (λex=785 nm, 20 mW, 100 sec exposure).
A two-dimensional correlation analysis was performed using SERS data from DMAP-modified MGNCs in the absence or presence of TBBPA. Data points were taken from individual SERS spectra without normalization, and selected from bands A–D (X1; 94 points) or bands B′ and D′ (X2; 56 points). These were compared against those taken from an intensity-averaged spectrum of MGNCs treated with 1 nM DMAP (N = 44). Minimal correlations were observed with MGNCs exposed to 100 pM TBBPA (N = 42) or even 10 pM TBBPA (N = 11), in stark contrast to the high correlations for DMAP-modified MGNCs exposed to water (Fig. 6, Table 1). The low data scatter indicates a high degree of autocorrelation within each subset, implying that the SERS data produced by magnetically precipitated MGNCs is remarkably consistent.† It is worth mentioning that anti-correlations (rX2 < −0.7) can also be obtained with TBBPA exposure, simply by refining the choice of data points in X2.
Figure 6.
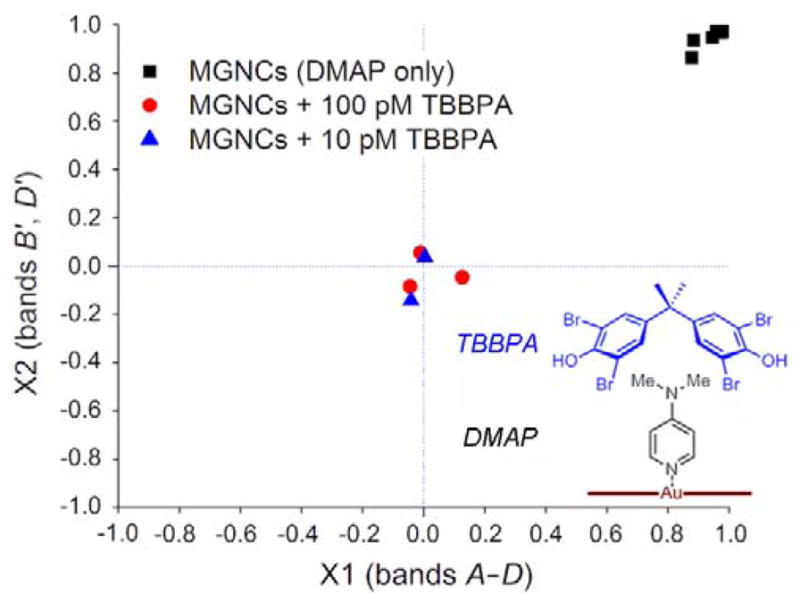
Two-dimensional correlation plot for DMAP-modified MGNCs treated with water (black squares, N=44), 100 pM TBBPA (red circles, N=42), or 10 pM TBBPA (blue triangles, N=11). The low number of unique points in the scatter plot reflects a high degree of reproducibility in the acquisition of SERS data.
Table 1.
Mean Pearson correlation coefficients (rX1, rX2) for SERS data based on bands A–D (X1) and bands B′ and D′ (X2)
| Analyte exposure | rX1 | rX2 | N |
|---|---|---|---|
| DMAP only (1 nM) | 0.962 | 0.968 | 44 |
| 100 pM TBBPA | 0.025 | −.002 | 42 |
| 10 pM TBBPA | −.017 | −.045 | 11 |
While the basis for spectral modulation has yet to be confirmed, we postulate that the suppression of select peaks is caused by the supramolecular association of DMAP with TBBPA (Fig. 6, lower right). The adsorption of DMAP onto MGNCs reduces the electron density of its dimethylamino group, which increases its complementarity to the electron-rich aromatic cleft of TBBPA. Such a donor–acceptor complex is likely to perturb charge-transfer interactions between DMAP and the Au surface, and thereby dampen its contribution toward SERS. To test this idea, DFT calculations were used to elucidate characteristic Raman frequencies of DMAP adsorbed on Au (BL3YP/LANL2DZ).36 Vibrational Raman modes that were suppressed by exposure to TBBPA included trigonal ring breathing (B), CH3 rocking (C), and in-plane C-H bending (D), whereas in-plane ring deformations (B′–D′) were hardly affected (Fig. S9, ESI).
To obtain further insights into the indirect mode of analyte detection by SERS, DMAP-modified MGNCs were exposed to aqueous solutions of three other organic analytes, namely bisphenol A (BPA), carbofuran (CF), and 4,4′-dibromobiphenyl (DBB). The latter has low solubility in water (≤1 nM), whereas the CF and BPA are more soluble and prepared at 1 μM and 1 mM respectively. MGNCs were treated with each solution, then collected and analyzed by SERS. In the case of highly soluble BPA, no significant spectral modulations to DMAP-modified MGNCs were observed, implying no analyte adsorption (data not shown). However, DBB and CF treatment yielded SERS spectra that were distinct from those produced by DMAP- or TBPPA-treated MGNCs (Figure 7).†† In the case of DBB, bands A–C from the DMAP spectrum were replaced by several new peaks ranging from 800 to 1080 cm−1; in the case of CF, bands B and C were replaced or overlapped by broad peaks centered at 950 and 1150 cm−1 respectively. Further studies are needed to determine which SERS peaks (if any) are directly produced by their respective analyte;37 nonetheless, each analyte perturbs the DMAP-MGNCs in a different way, resulting in unique spectral fingerprints.
Figure 7.
Intensity-averaged SERS spectra of DMAP-modified MGNCs exposed to trace (<1 nM) DBB (N=3, blue) and 1 μM CF (N=3, green); 100 pM TBBPA and untreated DMAP-MGNCs included for comparison (red and black, respectively). Raman spectra were acquired in air (λex=785 nm, 25 mW at the sample, 5 sec exposure).††
Conclusions
Magnetic gold nanoclusters prepared by the method above are highly reliable and sensitive substrates for SERS-based analysis. The adsorption of DMAP onto MGNCs is readily detected at 1 pM, and provides a platform for detecting secondary analytes by SERS. DMAP-modified MGNCs exhibited high sensitivity for hydrophobic analytes in water such as TBBPA, which is detected indirectly by modulation of the DMAP SERS spectrum, with a reproducible limit of detection at 10 pM. The DMAP-coated MGNCs can also be used to detect other hydrophobic analytes, each with its own unique spectral identity.
Supplementary Material
Acknowledgments
The authors gratefully acknowledge the National Science Foundation (CHE-0957738) and the Purdue University Center for Cancer Research (P30 CA023168) for financial support, Shao Zhou for discussions on correlation analysis, Marina Marjanovic (Univ. Illinois) for ICP-MS analysis, and Hartmut Hedderich, Wen Ren, and Joseph Irudayaraj (Purdue Univ.) for their generous assistance to obtain SERS spectra.
Footnotes
The total number of datasets collected from DMAP-treated MGNCs exposed to water, 100 pM TBBPA, and 10 pM TBBPA were 50, 50, and 12, respectively. However, several datasets were compromised by signal saturation (autofluorescence) and thus removed from analysis.
The spectra presented in Fig. 7 were acquired on a second Raman microscope with different collection optics.
Electronic Supplementary Information (ESI) available: Additional experimental details and characterization data supporting MGNC synthesis; raw and processed SERS spectra; DFT and correlation analysis. See DOI: 10.1039/c000000x/
Notes and references
- 1.Alvarez-Puebla RA, Liz-Marzán LM. Chem Soc Rev. 2012;41:43. doi: 10.1039/c1cs15155j. [DOI] [PubMed] [Google Scholar]
- 2.Halvorson RA, Vikesland PJ. Environ Sci Technol. 2010;44:7749. doi: 10.1021/es101228z. [DOI] [PubMed] [Google Scholar]
- 3.Cecchini MP, Turek VA, Alexei JP, Kornyshev A, Edel JB. Nat Mater. 2013;12:165. doi: 10.1038/nmat3488. [DOI] [PubMed] [Google Scholar]
- 4.Yilmaz M, Senlik E, Biskin E, Yavuz MS, Tamere U, Demirel G. Phys Chem Chem Phys. 2014;16:5563. doi: 10.1039/c3cp55087g. [DOI] [PubMed] [Google Scholar]
- 5.Quang LX, Lim C, Seong GH, Choo J, Do KJ, Yoo S. Lab Chip. 2008;8:2214. doi: 10.1039/b808835g. [DOI] [PubMed] [Google Scholar]
- 6.Yang Y, Li Z, Yamaguchi K, Tanemura M, Huang Z, Jiang D, Chen Y, Zhou F, Nogami M. Nanoscale. 2012;4:2663. doi: 10.1039/c2nr12110g. [DOI] [PubMed] [Google Scholar]
- 7.Guo Z, Hwang J, Zhao B, Chung JH, Cho SG, Baek S, Choo J. Analyst. 2014;139:807. doi: 10.1039/c3an01931d. [DOI] [PubMed] [Google Scholar]
- 8.Dasary SSR, Singh AK, Senapati D, Yu H, Ray PC. J Am Chem Soc. 2009;131:13806. doi: 10.1021/ja905134d. [DOI] [PubMed] [Google Scholar]
- 9.Sylvia JM, Janni JA, Klein JD, Spencer KM. Anal Chem. 2000;72:5834. doi: 10.1021/ac0006573. [DOI] [PubMed] [Google Scholar]
- 10.An Q, Zhang P, Li J, Ma W, Guo J, Hu J, Wang C. Nanoscale. 2012;4:5210. doi: 10.1039/c2nr31061a. [DOI] [PubMed] [Google Scholar]
- 11.Du J, Jing C. J Phys Chem C. 2011;115:17829. [Google Scholar]
- 12.Zhai Y, Zhai J, Wang Y, Guo S, Ren W, Dong S. J Phys Chem C. 2009;113:7009. [Google Scholar]
- 13.Hu Y, Sun Y. J Phys Chem C. 2012;116:13329. [Google Scholar]
- 14.Wang Y, Wang K, Zou B, Gao T, Zhang X, Du Z, Zhou S. J Mater Chem C. 2013;1:2441. [Google Scholar]
- 15.Baniukevic J, Boyaci IH, Bozkurt AG, Tamer U, Ramanavicius A, Ramanaviciene A. Biosens Bioelectron. 2013;43:281. doi: 10.1016/j.bios.2012.12.014. [DOI] [PubMed] [Google Scholar]
- 16.Zhang H, Harpster MH, Park HJ, Johnson PA, Wilson WC. Anal Chem. 2011;83:254. doi: 10.1021/ac1023843. [DOI] [PubMed] [Google Scholar]
- 17.Xu H, Aizpurua J, Käll M, Apell P. Phys Rev E. 2000;62:4318. doi: 10.1103/physreve.62.4318. [DOI] [PubMed] [Google Scholar]
- 18.Zhao J, Pinchuk AO, McMahon JM, Li SZ, Ausman LK, Atkinson AL, Schatz GC. Acc Chem Res. 2008;41:1710. doi: 10.1021/ar800028j. [DOI] [PubMed] [Google Scholar]
- 19.Yang J, Palla M, Bosco FG, Rindzevicius T, Alstrøm TS, Schmidt MS, Boisen A, Ju J, Lin Q. ACS Nano. 2013;7:5350–5359. doi: 10.1021/nn401199k. [DOI] [PMC free article] [PubMed] [Google Scholar]
- 20.Yamamoto H, Maeda Y, Kitano H. J Phys Chem B. 1997;101:6855. [Google Scholar]
- 21.Sulk RA, Corcoran RC, Carron KT. Appl Spectrosc. 1999;53:954. [Google Scholar]
- 22.Hill W, Fallourd V, Clockow D. J Phys Chem B. 1999;103:4707. [Google Scholar]
- 23.Guerrini L, Garcia-Ramos J, Domingo C, Sanchez-Cortes S. Anal Chem. 2009;81:1418. doi: 10.1021/ac8021746. [DOI] [PubMed] [Google Scholar]
- 24.Zhao Y, Newton JN, Liu J, Wei A. Langmuir. 2009;25:13833. doi: 10.1021/la902087e. [DOI] [PubMed] [Google Scholar]
- 25.Tsoutsi D, Guerrini L, Hermida-Ramon JM, Giannini V, Liz-Marzán LM, Wei A, Alvarez-Puebla RA. Nanoscale. 2013;5:5841. doi: 10.1039/c3nr01518a. [DOI] [PubMed] [Google Scholar]
- 26.Kang SW, Hong J, Park JH, Mun SH, Kim JH, Cho J, Char K, Kang YS. J Membrane Sci. 2008;321:90. [Google Scholar]
- 27.Gittins DI, Caruso F. Angew Chem Int Ed. 2001;40:3001. doi: 10.1002/1521-3773(20010817)40:16<3001::AID-ANIE3001>3.0.CO;2-5. [DOI] [PubMed] [Google Scholar]
- 28.Dorris A, Rucareanu S, Reven L, Barrett CJ, Lennox RB. Langmuir. 2008;24:2532. doi: 10.1021/la703003m. [DOI] [PubMed] [Google Scholar]
- 29.Kitamura S, Kato T, Iida M, Jinno N, Suzuki T, Ohta S, Fujimoto N, Hanada H, Kashiwagi K, Kashiwagi A. Life Sci. 2005;76:1589. doi: 10.1016/j.lfs.2004.08.030. [DOI] [PubMed] [Google Scholar]
- 30.Reistad T, Mariussen E, Ring A, Fonnum F. Toxicol Sci. 2007;96:268. doi: 10.1093/toxsci/kfl198. [DOI] [PubMed] [Google Scholar]
- 31.Huff TB, Hansen MN, Zhao Y, Cheng JX, Wei A. Langmuir. 2007;23:1596. doi: 10.1021/la062642r. [DOI] [PMC free article] [PubMed] [Google Scholar]
- 32.Zhu H, Coleman DM, Dehen CJ, Geisler IM, Zemlyanov D, Chmielewski J, Simpson GJ, Wei A. Langmuir. 2008;24:8660. doi: 10.1021/la801254b. [DOI] [PMC free article] [PubMed] [Google Scholar]
- 33.Wei A, Kim B, Sadtler B, Tripp SL. ChemPhysChem. 2001;2:743. doi: 10.1002/1439-7641(20011217)2:12<743::AID-CPHC743>3.0.CO;2-1. [DOI] [PubMed] [Google Scholar]
- 34.Lombardi JR, Birke RL. Acc Chem Res. 2009;42:734–742. doi: 10.1021/ar800249y. [DOI] [PubMed] [Google Scholar]
- 35.Wang X, Liu J, Liu Q, Du X, Jiang G. Talanta. 2013;116:906. doi: 10.1016/j.talanta.2013.08.011. [DOI] [PubMed] [Google Scholar]
- 36.Sundaraganesan N, Kalaichelvan S, Meganathan C, Joshua BD, Cornard J. Spectrochim Acta A. 2008;71:898. doi: 10.1016/j.saa.2008.02.016. [DOI] [PubMed] [Google Scholar]
- 37.Some SERS peaks correlate with those from a recent study of CF adsorbed onto Ag nanoparticles: Parisi J, Dong Q, Lei Y. RSC Advances. 2015;5:14081.
Associated Data
This section collects any data citations, data availability statements, or supplementary materials included in this article.


