

Abstract
Glucagon drives hepatic gluconeogenesis and maintains blood glucose levels during fasting. The mechanism that attenuates glucagon action following refeeding is not understood. The present study demonstrates an increase in perivenous liver hypoxia immediately after feeding which stabilizes hypoxia-inducible factor (HIF)2α in liver. The transient postprandial increase in hepatic HIF2α attenuates glucagon signaling. Hepatocyte-specific disruption of HIF2α increases postprandial blood glucose and potentiates the glucagon response. Independent of insulin/AKT signaling, activation of hepatic HIF2α resulted in lower blood glucose, improved glucose tolerance and decreased gluconeogenesis due to blunted hepatic glucagon action. Mechanistically, HIF2α abrogated glucagon-PKA signaling by activating cAMP-phosphodiesterases in a MEK/ERK-dependent manner. Repression of glucagon signaling by HIF2α ameliorated hyperglycemia in streptozotocin-induced diabetes and acute insulin resistant animal models. This study reveals that HIF2α is essential for the acute postprandial regulation of hepatic glucagon signaling, and suggests HIF2α as a potential therapeutic target in the treatment of diabetes.
Keywords: HIF2α, VHL, hypoxia, glucagon, ERK, PKA and CREB
Graphical abstract
Introduction
The counter regulatory hormone glucagon is involved in fasting energetics by promoting hepatic glucose output via gluconeogenesis and glycogenolysis (Habegger et al., 2010). Glucagon-mediated stimulation of protein kinase A (PKA)-cyclic AMP (cAMP) response element binding protein (CREB) signaling cascade, and dephosphorylation of CREB regulated transcriptional co-activator 2 (CRTC2) (Koo et al., 2005) increases the transcription of gluconeogenic genes, glucose 6 phosphatase (G6pase) and phosphoenolpyruvate carboxykinase (Pepck). During nutrient excess, glucagon action is attenuated by a decrease in glucagon secretion (Walker et al., 2011). However, there is a long delay in the return of glucagon back to basal levels following feeding (Unger et al., 1963). Sustained but controlled glucagon action during the post-absorptive phase is essential to prevent hypoglycemia after bolus of insulin release (Tse et al., 1983). Also, Glucagon priming is important for insulin effect on hepatic gluconeogenesis and glycogen synthesis (Lewis et al., 1997). However, dysregulated glucagon signaling results in hyperglycemia in type 2 diabetic patients with inappropriately high levels of glucagon (D’Alessio, 2011; Dunning and Gerich, 2007). Insulin partially attenuates glucagon signaling through phosphorylation and degradation of CRTC2 by SIK kinases (Dentin et al., 2007). However, the intracellular mechanisms involved in the regulation of glucagon-PKA-CREB signaling are largely unknown.
Chuvash polycythemia is a congenital oxygen sensing disorder that arises due to homozygous mutation of arginine to tryptophan in the von Hippel Lindau (VHL) protein resulting in decreased ability of VHL to bind and degrade hypoxia-inducible factor (HIF) (Ang et al., 2002; Hickey et al., 2007). HIF1α and HIF2α are the two major HIF isoforms that regulate numerous genes involved in cell survival, glucose metabolism, inflammation, angiogenesis and erythropoiesis (Ackerman and Simon, 2014; Prabhakar and Semenza, 2015; Zheng et al., 2015). One of the common clinical manifestations in Chuvash polycythemia is hypoglycemia (McClain et al., 2013). Recent studies demonstrated that activation of hepatic HIF2α in the liver increases insulin sensitivity and improves glucose homeostasis via activation of the insulin receptor substrate (IRS2)-AKT signaling pathway (Taniguchi et al., 2013; Wei et al., 2013). However, hypoglycemia in Chuvash polycythemic patients, even in the presence of high levels of gluconeogenic substrates such as glycerol, lactate and pyruvate, suggests the possibility of altered glucagon action (Formenti et al., 2010; Jenssen et al., 1990).
In this study, we demonstrate that feeding leads to a rapid and transient hypoxia in the liver, which through HIF2α is essential in regulating the hepatic glucagon response. Disruption of HIF2α increases postprandial glucose levels and hepatic glucagon action. Conversely, activation of hepatic HIF2α abrogated glucagon action and decreases gluconeogenesis through increased phosphodiesterase (PDE)4 activity. This study demonstrates that HIF2α is a potential therapeutic target in the treatment of diabetes.
Results
Disruption of hepatic VHL improves glucose homeostasis with a parallel decrease in glucagon action
To understand the role of HIF signaling in glucose homeostasis, mice with disruption of VHL in liver (VhlLivKO) using a tamoxifen-inducible Cre recombinase under the control of the albumin promoter were assessed (Qu et al., 2011). VhlLivKO mice had lower fasting glucose levels with a progressive improvement in glucose tolerance at 1- and 2-weeks following Vhl disruption (Figure 1A and B, and Figure S1A). HIF2α in the liver improves glucose homeostasis via IRS2-insulin signaling (Taniguchi et al., 2013; Wei et al., 2013); however, IRS2 mRNA and/or protein levels were not increased at 1-week but increased at 2-weeks or later following Vhl disruption (Figure S1B–D). In addition, insulin stimulated AKT phosphorylation was not different between primary hepatocytes (PH) from VhlLivKO and VhlF/F mice (Figure 1C). Expression of G6pase and Pepck were significantly decreased in PH from VhlLivKO mice, which could not be restored by the PI3K inhibitor, Wortmannin (Figure 1D). FOXO1, a critical regulator of gluconeogenesis, which is excluded from the nucleus through AKT-mediated phosphorylation, was increased in nuclear lysates of hepatocytes from VhlLivKO, possibly a compensatory mechanism to circumvent hypoglycemia (Figure S1E). Moreover, no difference in insulin tolerance at 1-week (Figure 1E), suggests that additional mechanisms exists in parallel to the IRS2/AKT pathway that accounts for the improved glucose homeostasis in VhlLivKO mice. Induction of hepatic G6pase upon fasting was completely abrogated in the livers of VhlLivKO mice, while Pepck mRNA was significantly attenuated (Figure 1F and G). Further analysis revealed a progressive decrease in glucagon response starting at 1-week, and complete abrogation at 2-weeks following VHL disruption (Figure 1H and Figure S1F). A significant decrease in insulin levels (Figure 1I), and elevation in plasma glucagon levels (Figure 1J) resulted in a lower insulin:glucagon ratio (0.008 in VhlLivKO mice compared to 0.003 in VhlF/F mice). Together this data indicates that the decrease in hepatic glucagon action may be responsible for improved glucose homeostasis in VhlLivKO mice.
Figure 1. Disruption of hepatic Vhl (VhlLivKO) is associated with an attenuated glucagon response.

(A) Fasting glucose and (B) glucose tolerance test at 1-week following VHL disruption in the liver (VhlLivKO). (C) Insulin stimulated AKT phosphorylation and (D) qPCR analysis of G6pase and Pepck mRNA in PH treated with 100 nM Wortmannin for 2-hours. (E) Insulin tolerance test at 1-week following tamoxifen treatment. (F and G) qPCR analysis in the livers of fed or overnight fasted mice. (H) Glucagon tolerance test at 1-week after VHL disruption. (I) Serum insulin and (J) serum glucagon assessed at 1-week following VHL disruption. Each bar represents the mean± S.E.M. *p < 0.05, **p < 0.01, ***p < 0.001 compared to VhlF/F. #p < 0.05, ##p < 0.01 compared to Fed. Four to five mice were used per group and experiments with PH were done in triplicates and repeated at least three times.
Disruption of hepatic VHL decreases glucagon mediated glucose output in the liver
Hepatic gluconeogenesis, assessed by a pyruvate tolerance test, revealed a progressive decrease in glucose output in VhlLivKO mice at 1- and 2-weeks following VHL disruption (Figure 2A and Figure S2A). A significant decrease in the hepatic G6Pase enzyme activity with a concomitant increase in glycogen content was observed in the VhlLivKO mice (Figure 2B and C). In addition, both basal and glucagon-induced glucose production were significantly decreased in PH from VhlLivKO mice (Figure 2D). Moreover, induction of G6pase and Pepck mRNA and protein by glucagon were completely abrogated in VhlLivKO PH (Figure 2E and F). As a positive control, expression of the HIF2α target gene erythropoietin (Epo) was highly induced in the VhlLivKO PH (Figure 2E). To determine if IRS2/AKT has any role in the glucagon resistance of VhlLivKO mice, PH were pretreated with PI3K inhibitor (Wortmannin and LY294002) and an allosteric AKT inhibitor (MK-2206). Inhibiting IRS2/AKT did not restore glucagon induction of G6pase mRNA levels and hepatic glucose production in VhlLivKO PH suggesting that glucagon resistance is independent of AKT signaling in VhlLivKO mice (Figure 2G–I and S2B). Further, adenoviral G6pase promoter luciferase assay revealed a complete loss of glucagon induction of G6pase promoter activity in VhlLivKO PH (Figure 2J). PGC-1α is an important transcription co-factor required for G6pase and Pepck expression (Herzig et al., 2001). However, a decreased PGC-1α expression in VhlLivKO mice is not responsible for the lower blood glucose, as adenoviral-mediated PGC-1α expression did not restore glucagon effect on G6pase expression (Figure S2C and S2D). Dexamethasone induction of gluconeogenic genes was not altered in VhlLivKO PH (Figure 2K), suggesting a specific abrogation of glucagon signaling. Disruption of VHL in PH led to induction of STAT3 signaling (Figure S2E), which can inhibit gluconeogenesis (Ramadoss et al., 2009). However STAT3 inhibitors, which completely blocked phospho-STAT3, could not restore induction of G6pase and Pepck mRNA expression by glucagon in VhlLivKO PH (Figure S2F and S2G). To further dissect the mechanism of blunted glucagon action in VhlLivKO mice, glucagon stimulated CREB phosphorylation was assessed. Treatment with glucagon induced CREB phosphorylation in VhlF/F but not VhlLivKO mice, both in vivo and in PH (Figure 2L and M). Taken together, these data suggest that VhlLivKO mice exhibit decreased glucose output due to blunted glucagon-CREB signaling in the liver.
Figure 2. Disruption of hepatic VHL (VhlLivKO) decreases hepatic glucagon action and glucose output from liver.

(A) Pyruvate tolerance test at 1-week after disruption of VHL in liver (VhlLivKO). (B) G6pase activity and (C) hepatic glycogen content assessed in VhlF/F and VhlLivKO mice. *p < 0.05, **p < 0.01, ***p < 0.001 compared to VhlF/F. (D) De novo gluconeogenesis in Vehilcle (Veh), substrate (S) and substrate+glucagon (S+G) treated cells. (E) qPCR analysis for HIF2α target gene, Epo mRNA and glucagon induction of G6pase and Pepck in PH. (F) Western blot analysis of G6Pase and PEPCK in PH treated with 100 nM glucagon for 6-hours. Glucagon-induced G6pase expression in PH pre-treated with (G) 50 nM Wortmannin for 2-hours or (H) 50 nM LY294002 or 50 nM MK-2206 for 1-hour. (I) Glucose production in PH pretreated for 1-hour with or without 50 nM Wortmannin or 50 nM LY294002 or 50 nM MK-2206. ***p < 0.001 compared VhlF/F. # p < 0.05, ###p < 0.001 compared to Vehicle. $p<0.05, $$p < 0.001, $$$p < 0.0001 compared to substrate alone. (J) G6pase promoter luciferase assay in PH. Luciferase values were normalized to protein content. (K) qPCR analysis of G6pase and Pepck in the PH treated with 10 nM dexamethasone for 2-hours. pCREB assessed (L) in vivo and (M) in PH. Each bar represents the mean value ± S.E.M. *p < 0.05, **p < 0.01, ***p < 0.001 compared to VhlF/F. #p < 0.05, ## p < 0.01, ###p < 0.001 compared to Vehicle. Four to five mice were used per group and the experiments with PH were done in triplicate and repeated at least three times.
Activation of HIF2α decreases hepatic glucagon action
To determine whether the decrease in hepatic glucagon action was mediated by HIF1α or HIF2α, mice with compound disruption of VHL and HIF1α (Vhl/Hif1αLivKO) or VHL and HIF2α (Vhl/Hif2αLivKO) were examined. Lower blood glucose levels in VhlLivKO mice were completely reversed by the loss of both VHL and HIF2α, but not VHL and HIF1α (Figure 3A and Figure S3A). The plasma insulin levels were increased and serum glucagon levels were normalized in Vhl/Hif2αLivKO mice (Figure 3B). Fasting G6pase and Pepck mRNA levels were restored in Vhl/Hif2αLivKO mice (Figure 3C). Further, the improvement in glucose homeostasis following VHL disruption was completely reversed in Vhl/Hif2αLivKO but not in Vhl/Hif1αLivKO mice (Figure 3D and Figure S3B). Insulin tolerance test revealed no difference in the insulin sensitivity between VhlF/F, VhlLivKO, and Vhl/Hif2αLivKO mice (Figure 3E). Additionally, glucagon response and gluconeogenesis in Vhl/Hif2αLivKO mice were comparable to VhlF/F mice, but not in Vhl/Hif1αLivKO mice (Figure 3F and G and Figure S3C and S3D). Interestingly, blood glucose levels were higher during the glucagon and pyruvate tolerance test in Vhl/Hif2LivKO mice (Figure 3F and G). Combined loss of HIF2α and VHL completely restored the glucagon-mediated induction of G6pase and Pepck mRNAs (Figure 3H) and CREB phosphorylation (Figure 3I), to levels similar as in PH from VhlF/F mice. Taken together, these data suggest that the improvement in glucose homeostasis and attenuated glucagon action in VhlLivKO mice is HIF2α dependent.
Figure 3. Abrogated glucagon response in VhlLivKO mice is HIF2α dependent.

(A) Blood glucose, (B) serum insulin levels (top panel) and serum glucagon levels (bottom panel) assessed at 1-week following tamoxifen treatment. (C) qPCR for G6pase and Pepck mRNA in the livers of overnight fasted mice. *p < 0.05 compared to VhlLivKO. #p < 0.05 compared to Fed. (D) Glucose tolerance, (E) Insulin tolerance, (F) glucagon tolerance and (G) pyruvate tolerance test in VhlLivKO and Vhl/Hif2LivKO mice. Five to eight mice were assessed per group. *p < 0.05, **p < 0.01 compared to VhlF/F. #p < 0.001 compared VhlLivKO. (H) G6pase and Pepck mRNA expression and (I) pCREB in glucagon treated PH. *** p < 0.001 compared to VhlLivKO; #, p < 0.05 compared to Vehicle; ###, p < 0.001 compared to Vehicle. Each bar represents the mean value ± S.E.M. Experiments with PH were done in triplicate and repeated at least three times.
Activation of HIF2α is critical to regulate postprandial glucose levels
To determine the role of dietary status on hepatic HIF signaling, hypoxia reporter mice (ODD-Luc; (Shah et al., 2008)) were fasted for 16-hours and then refed for 30, 60 and 120 minutes. Refeeding increased plasma insulin levels with a corresponding increase in AKT phosphorylation (Figure S4A and S4B). Refeeding significantly decreased the levels of pCREB as well as G6pase and Pepck mRNA (Figure S4B and S4C). When assessed by the IVIS in vivo luciferase imaging system, refeeding after overnight fasting resulted in a robust increase in HIF expression, which was visualized at 30 minutes after refeeding, and persisted until 120 minutes (Figure 4A). Similarly, tissue luciferase in the livers of ODD-luc mice demonstrated increased luciferase activity at 30, 60 and 120 minutes after refeeding (Figure 4B). Further, Western blot analysis revealed induction of HIF2α expression in the nucleus of livers from refed mice (Figure 4C). Fasting increases hepatic blood circulation possibly to mobilize glucose (Eipel et al., 2010; Exton et al., 1972). Upon refeeding, the central blood circulation is directed towards intestine to facilitate nutrient absorption (Gallavan and Chou, 1985). However, it is not known whether the re-routing of circulation by refeeding affects hepatic oxygen dynamics. To determine hypoxic activation of HIF2α after refeeding from a hypoxic-independent increase of HIF2α, mice were injected with the hypoxyprobe (a pimonidazole compound which forms adducts in hypoxic cells) and then refed for 30 or 60 minutes. Immunostaining revealed a significant elevation in pimonidazole adducts at 30 and 60 minutes after refeeding in the hepatocytes surrounding the central vein, with a concomitant co-localization of HIF2α (Figure 4D), suggesting that refeeding-induced transient hypoxia stabilizes HIF2α in hepatocytes. The physiological role of HIF2α in hepatic glucagon signaling was further elucidated using mice with a temporal disruption of HIF2α in the liver (Hif2αLivKO) by tamoxifen-inducible Cre recombinase expressed from the albumin promoter. Tamoxifen treatment significantly decreased HIF2α expression in the hepatocytes (Figure 4E). Glucose tolerance test was not different in Hif2αLivKO mice (Figure 4F); however, the glucagon response was significantly increased in Hif2αLivKO similar to Vhl/Hif2αLivKO mice (Figure 4G). To determine the role of HIF2α in postprandial glucose homeostasis, a fasting-refeeding experiment was performed. A modest but significant increase in the postprandial glucose levels were observed in Hif2αLivKO mice (Figure 4H). Refeeding induced AKT phosphorylation to similar level; however, phosphorylated CREB was significantly elevated at all time points of refeeding in Hif2αLivKO livers (Figure 4I). Collectively, these data suggests that the transient increase in hepatic HIF2α after refeeding has a critical role in the regulation of postprandial glucose homeostasis by repressing glucagon-CREB signaling in liver.
Figure 4. Transient increase in hepatic HIF2α regulates postprandial glucagon action.

(A) In vivo imaging of livers and (B) liver tissue luciferase assays in mice fasted overnight or refed for 30-, 60- and 120-minutes. *p < 0.05 compared to fasted. Three mice were assessed per group. (C) Western blot for HIF2α and (D) co-immunostaining for pimonidazole adducts and HIF2α in the overnight fasted and 30 or 60 minutes refed livers. Five mice were assessed per group. (E) qPCR analysis of Hif2α mRNA in hepatocytes. (F) Glucose and (G) glucagon tolerance performed in 6-week-old WT and Hif2αLivKO mice. (H) Glucose levels monitored in overnight fasted and refed mice. *p < 0.05 compared to Hif2αF/F. (I) Western blot analysis for pCREB and pAKT in WT and Hif2αLivKO mice fasted overnight and refed for 30-minutes to 2-hours. Six mice were assessed per group.
Glucagon stimulated PKA activation is attenuated in VhlLivKO mice
To determine the mechanism by which HIF2α represses glucagon signaling, PH were pretreated with the phosphatase inhibitor okadaic acid (OKA). Okadaic acid did not restore glucagon stimulated CREB phosphorylation or G6pase promoter activity in the PH from VhlLivKO mice (Figure 5A and Figure S5A). Interestingly, reconstituting VhlLivKO PH lysate with recombinant PKA induced CREB phosphorylation, suggesting that PKA activity may be repressed in VhlLivKO mice (Figure S5B). Further analysis revealed a significant decrease in glucagon-induced PKA activity in VhlLivKO PH (Figure 5B). These data are consistent with decreased glucagon-induced pan-phoshoPKA substrates (Figure 5C). PKA is a holoenzyme made up of four subunits; two regulatory and two catalytic subunits (Kim et al., 2007). qPCR analysis revealed that the regulatory subunit II-beta (PKA-RIIβ) mRNA is significantly increased, whereas the catalytic subunit alpha (PKA-Cα) mRNA is decreased in the VhlLivKO livers (Figure S5C). Western blot analysis revealed no difference in the protein levels of PKA-RI or the PKA-Cα subunits; however, there was a significant decrease in PKA-RII subunit (Figure S5D). Disruption of VHL did not affect nuclear PKA-Cα levels or binding of PKA-Cα to CREB (Figure S5E–G). Although regulators of PKA such as A-kinase anchoring protein (AKAP)-12 and Syk were significantly increased in VhlLivKO livers, AKAP12 modulator (phorbol myristate acetate, PMA) or Syk inhibitor (piceatannol) did not restore glucagon induction of Pepck and G6pase mRNA levels (Figure S5H–J), suggesting that the decrease in PKA activity is not due to disproportionate levels of PKA subunits. Increase in intracellular cAMP is a key event in the activation of PKA-CREB signaling cascade. Glucagon treatment resulted in a ~10-fold increase in intracellular cAMP levels in VhlF/F PH, which was significantly attenuated in VhlLivKO mice (Figure 5D). Forskolin, a direct and potent activator of adenyl cyclase, increased CREB phosphorylation and G6pase and Pepck expression in VhlF/F PH but not in VhlLivKO PH (Figure 5E and Figure S5K). However, treatment with a stable 8-br-cAMP completely restored PKA-CREB signaling (Figure 5F and Figure S5L–M). Collectively, these data suggest that HIF2α inhibits glucagon-PKA signaling by affecting the intracellular cAMP levels.
Figure 5. HIF2α represses glucagon-mediated PKA activity by increasing cAMP hydrolysis.

(A) Glucagon stimulated pCREB in PH pre-treated with phosphatase inhibitor okadaic acid (200 nM OKA) for 2-hours. (B) PKA activity and (C) Western blot analysis for phospho-PKA (p-PKA) substrates and (D) cAMP levels assessed in PH treated with glucagon. Western blot analysis for pCREB and qPCR for G6pase mRNA (bottom panel) in PH treated with (E) 20 μM forskolin or (F) 200 μM 8-br-cAMP for 2-hours. (G) PDE activity assessed by 5′-AMP levels in PH isolated at 1-week following VHL disruption. (H) Glucagon-stimulated pCREB, (I) G6pase expression and (J) cAMP levels in PH pretreated with 1 μM IBMX for 1-hour. (K) Glucagon-stimulated pCREB, G6pase and Pepck (L) mRNA or (M) protein expression (glucagon treatment for 6-hours) in PH pretreated for 16-hours with Rolipram (Rp, 1 μM), Glaucine (Gl, 1 μM), Ibudilast (Ib, 1 μM), and CP80,633 (Cp, 1 μM). PH were treated again with respective PDE inhibitors 30 minutes before glucagon treatment. Experiment with PH were done in triplicates and repeated at least twice. Each bar represents the mean value ± S.E.M. *p < 0.05, **p < 0.05, ***p < 0.001 compared to VhlF/F. # p < 0.05, ###p < 0.001, ####p < 0.0001 compared to Vehicle, $p < 0.05, $$$p < 0.001 are IBMX treated compared to their untreated controls. ^^^p < 0.001 compared to no inhibitor treatment.
Inhibiting PDE activity restores glucagon sensitivity in hepatocytes from VhlLivKO mice
Intracellular cAMP levels are tightly regulated by PDEs. To further investigate the mechanism, PDE activity was assessed in PH, which revealed that PDE activity is significantly elevated in VhlLivKO PH (Figure 5G). Pan-PDE inhibitor IBMX (3-isobutyl-1-methyl xanthine) restored glucagon-stimulated CREB phosphorylation, PKA substrate phosphorylation, and expression of G6pase and Pepck mRNAs in VhlLivKO PH (Figure 5H and I and Figure S5N). In addition, glucagon induced cAMP levels were comparable between VhlF/F and IBMX-treated VhlLivKO PH (Figure 5J). Mammalian PDEs are composed of 21 genes and grouped into 11 isoforms based on their sequence homology, property and regulation (Omori and Kotera, 2007). PDE4 plays an important role in hepatic glucagon signaling (Abdollahi et al., 2003). To assess whether PDE4 is involved in HIF2α regulation of glucagon signaling, PH were pre-treated with PDE4 specific inhibitors Rolipram, Glaucine, Ibudilast, or CP80,633 and then treated with glucagon. Inhibiting PDE4 restored glucagon stimulated CREB phosphorylation and expression G6Pase and PEPCK in VhlLivKO PH (Figure 5K–L). However, PDE2, 3 or 10 inhibitors did not restore glucagon signaling (Figure S5O). Interestingly, gene expression analysis revealed a significant increase in Pde1b, Pde2a, Pde3a and Pde7b mRNAs in VhlLivKO PH in a HIF2α-dependent manner, but not mRNA or protein levels of PDE4 (Figure S5P–R), suggesting that HIF2α potentially regulates PDE4 activity through post-translation modification.
HIF2α activated ERK signaling represses hepatic glucagon action
To delineate the pathway upstream of PDE4 in HIF2α regulation of glucagon signaling, we screened for glucagon induced G6pase expression in the VhlF/F and VhlLivKO PH in the presence of various inhibitors or activators of key signaling pathways, which were shown to regulate PDE activity or glucagon signaling (Omori and Kotera, 2007). Interestingly, among the various compounds tested, SRC inhibitor (SU6656), MEK inhibitors (GSK1120212 and PD98059) and ERK inhibitor (FR180204) partially restored glucagon induced G6pase expression in the VhlLivKO PH (Figure 6A). Further analysis revealed a significant increase in the phosphorylation of p42/p44 ERK in the livers and PH of VhlLivKO mice (Figure 6B). Inhibiting p42/p44 ERK using MEK inhibitors (GSK and PD) and ERK inhibitor (FR) partially restored glucagon induced CREB phosphorylation and PKA inhibitor H-89 inhibited the glucagon effect in VhlLivKO PH (Figure 6C and D). Similarly, MEK or ERK inhibitors increased glucagon induced G6pase expression by ~10 fold in VhlLivKO PH, which is comparable to the induction observed in VhlF/F PH (Figure 6E). Inhibiting MEK/ERK also restored glucagon-induced glucose output in VhlLivKO PH (Figure 6F). Similarly, adenoviral-mediated overexpression of dominant negative MEK1 (Ad-MEK1DN) partially restored glucagon-stimulated G6pase expression in VhlLivKO PH (Figure S6A), suggesting that ERK is a critical regulator of hepatic glucagon signaling in VhlLivKO mice. Adenovirus-mediated expression of constitutive active MEK-ERK (Ren et al., 2010) decreased glucagon-stimulated CREB phosphorylation and induction of G6pase and Pepck mRNAs in WT PH (Figure 6G and H). Activation of MEK-ERK resulted in increased PDE activity (Figure 6I). Through screening we observed that inhibiting SRC kinase could partially restore glucagon induced G6pase expression in PH from VhlLivKO mice (Figure 6A); however, hepatic glucose production in VhlLivKO PH was not further improved by SRC kinase inhibitor (Figure S6B). HIF2α-mediated ERK phosphorylation has been shown to be potentiated by EGFR signaling (Wang and Schneider, 2010). To determine whether ERK activation requires HIF2α transcription activity, mice with compound disruption of VHL and aryl hydrocarbon nuclear translocator (ARNT; Vhl/ArntLivKO mice) were examined. HIF heterodimerization with ARNT is essential to activate its target gene expression. No difference in ERK phosphorylation, blood glucose levels or G6pase and Pepck mRNA levels in Vhl/ArntLivKO mice (Figure S6C–E), suggests that HIF2α transcriptional activity is essential for ERK regulation of gluconeogenesis. Collectively, these data demonstrate that the HIF2α attenuates glucagon response partially by activating ERK signaling.
Figure 6. HIF2α induced ERK activity represses hepatic glucagon signaling.

(A) qPCR analysis of G6pase in PH pre-treated with inhibitors or activators for two-hours and then with glucagon for additional 2-hours (V-Veh; G- Glucagon; G+T- Glucagon + treatments). (B and C) pERK levels assessed in livers and PH of VhlLivKO mice. pERK levels, (D) Glucagon induced pCREB and (E) qPCR analysis of G6pase mRNA in PH pre-treated with 2.5 μM GSK1120212 and 10 μM PD98059 and10 μMFR180204 for 16-hours. Each bar represents the mean value ± S.E.M. ***p < 0.001 compared to VhlF/F. ###p < 0.001 compared to no glucagon. $p < 0.05, $$$p < 0.001 compared to without inhibitor treatment. (F) Glucose production in PH pre-treated with GSK for 16-hours. Each bar represents the mean value ± S.E.M. ##p < 0.001 compared to no substrate or glucagon. ^p < 0.05, ^^p <0.01 compared to substrate and glucagon treated, *p <0.05 compared to VhlF/F $p < 0.05, $$$p < 0.001 compared to without inhibitor treatment. Glucagon stimulated (G) pCREB and (H) Pepck and G6pase mRNA expression in WT PH infected with Ad-GFP or Ad-MEK-ERK-LA virus for 48-hours. ***p < 0.001 compared to Ad-GFP. ####p < 0.001 compared to no glucagon. (I) PDE activity in PH infected with Ad-GFP or Ad-MEK-ERK-LA virus for 48-hours. Five to six mice were used per group and experiments with PH were done in triplicates and repeated at least twice.
HIF2α mediated glucagon resistance ameliorates hyperglycemia in diabetic mouse models
The present study together with previous work clearly demonstrates that activation of hepatic HIF2α increases insulin sensitivity (Taniguchi et al., 2013) and dampens glucagon response. However, to date, an essential role for hepatic HIF2α in diet-induced glucose intolerance has not been studied. Therefore, metabolic parameters were assessed in Hif2αLivKO and littermate controls that were fed a high-fat diet for 6-weeks. No significant difference was observed in glucose and insulin tolerance test between Hif2αLivKO and littermate controls (Figure 7A and B). However, Hif2αLivKO mice exhibited an increased glucagon response (Figure 7C). Although HIF2α regulation of glucagon signaling was not an essential protective mechanism, HIF2α is sufficient in improving diabetic parameters in diet- and genetic-induced obesity models through activation of the IRS2/AKT pathway (Taniguchi et al., 2013; Wei et al., 2013). To rule-out the confounding effect of insulin and to determine if ablation of glucagon response by VHL disruption would ameliorate hyperglycemia, we assessed glucose levels in streptozotocin (STZ)-induced diabetic mouse model and an acute insulin resistant model. Diabetes was first induced by STZ administration and then hepatic VHL was disrupted using tamoxifen (Figure 7D). STZ treatment decreased the serum insulin levels, islet size, and islet insulin content with no obvious changes in islet glucagon content (Figure S7A and S7B). Consistent with glucagon resistance, a significant increase in serum glucagon levels was observed, resulting in a lower insulin:glucagon ratio in VhlLivKO mice when compared to VhlF/F and Vhl/Hif2LivKO (Figure S7C and S7D). A significant increase in the blood glucose was observed at 5-days after STZ treatment (Figure 7D), and following 6-days after tamoxifen injection, blood glucose levels returned to normal in the VhlLivKO mice, whereas the blood glucose remained highly elevated in Vhl/Hif2LivKO and VhlF/F mice (Figure 7D). Further analysis revealed a significant decrease in the expression of G6pase and Pepck mRNA in the livers of VhlLivKO mice (Figure 7E). In addition, inducing acute insulin resistance using MK-2206, the first allosteric AKT inhibitor approved for the treatment of solid tumors in humans (Yap et al., 2011), transiently increased blood glucose levels (Cherrin et al., 2010; Yap et al., 2011) in VhlF/F and Vhl/Hif2LivKO mice, but not in VhlLivKO (Figure 7F). Taken together, these data revealed that disruption of VHL improves glucose homeostasis in both insulin deficient and insulin resistant animal models by attenuating hepatic glucagon response.
Figure 7. HIF2α mediated repression of glucagon signaling ameliorates hyperglycemia in STZ induced diabetic and insulin resistant mice.

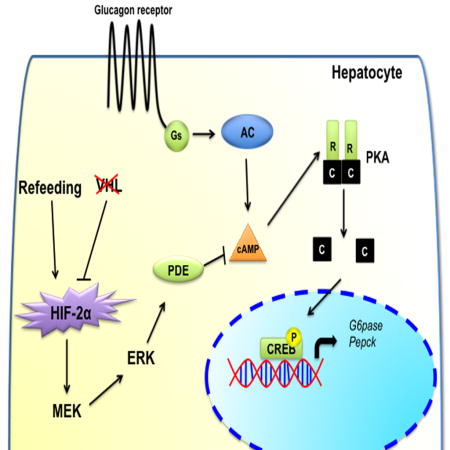
(A) Glucose, (B) insulin, (C) glucagon tolerance test performed in HIF2αF/F and HIF2αLivKO mice fed a 60% HFD for 6-weeks. *p < 0.05 compared to HIF2αF/F. (D) Blood glucose monitored in STZ treated mice. (E) qPCR analysis for G6pase and Pepck mRNA in livers of STZ treated mice. *p < 0.05 compared to VhlF/F, ***p < 0.001 compared to VhlF/F. Five to seven mice assessed per group. (F) Blood glucose monitored in VhlLivKO mice injected i.p. with MK-2206 (50mg/kg body weight). *p < 0.05 compared to mice before treatment, #p < 0.05 compared to VhlF/F. Each bar represents the mean value ± S.E.M. Six mice to eleven mice were assessed per group. (G) Schematic in which HIF2α-mediated increase in ERK signaling represses glucagon-PKA-CREB signaling through increased PDE-dependent hydrolysis of cAMP in liver.
Discussion
Glucagon has a central role in maintaining fasting blood glucose levels, as well as in metabolic diseases such as type II diabetes (D’Alessio, 2011; Dunning and Gerich, 2007). Decreasing glucagon signaling improves glucose homeostasis (Conarello et al., 2007; Lee et al., 2011; Liang et al., 2004). However, very little is known about the mechanisms that regulate hepatic glucagon signaling. The present work demonstrates that a transient postprandial increase in hepatic HIF2α acts as a critical molecular brake for glucagon signaling. During fasting, circulation to liver is increased to channel lactate for gluconeogenesis (Eipel et al., 2010; Exton et al., 1972). Upon refeeding, the diversion of blood supply towards intestine (Gallavan and Chou, 1985) induces a transient perivenous hypoxia sufficient to stabilize HIF2α in liver. Mechanistically, HIF2α repressed postprandial glucagon response and gluconeogenesis by increasing PDE activity and cAMP hydrolysis in an ERK dependent manner (Figure 7G). Suppression of glucagon action after refeeding is important under conditions such as type-1-diabetes and insulin resistance (Baron et al., 1987; Porksen et al., 2007). Repression of hepatic glucagon signaling by HIF2α is sufficient to ameliorate hyperglycemia in STZ-induced type-1 diabetes and AKT inhibitor driven acute insulin resistant mouse models. Currently, insulin signaling is the best-known counter-regulatory mechanism to glucagon signaling. The present work demonstrates that HIF2α inhibits glucagon signaling by a parallel pathway, independent of insulin signaling. However, systemic glucose levels continue to decrease at 2-weeks following HIF2α activation, which might be contributed in part by an increase in insulin sensitivity, as IRS2 levels were elevated at 2-weeks following VHL disruption. Thus, HIF2α regulation of hepatic insulin and glucagon pathways may work synergistically. Current work is aimed in understanding the integration of glucagon and insulin signaling by HIF2α.
VhlLivKO mice exhibit increased levels of EPO, lower hepcidin levels, increased erythropoiesis and polycythemia (Anderson et al., 2012), similar to VhlR/R mice that carry a homozygous mutation (R200W) observed in Chuvash polycythemia (Gordeuk et al., 2011; Hickey et al., 2007). This work suggests a potential mechanism by which Chuvash polycythemia patients have lower blood glucose through HIF2α regulation of glucagon signaling, as no change in insulin sensitivity was observed in these patients. Although it is possible that the hypoglycemia in Chuvash polycythemia patients may be caused by impaired glucagon signaling, it should be noted that the increase in HIF2α is robust in the mouse model with VHL disruption compared to the modest HIF2α increase in Chuvash polycythemia patients and VhlR/R mice. Therefore, at this time we cannot completely rule out the confounding glucose lowering effects by polycythemia in our mouse model.
cAMP levels determine the activation of the PKA signaling. Restoration of glucagon signaling by PDE4 inhibitors demonstrates a central role for PDE4 in the regulation of hepatic glucagon signaling by hypoxia. However, PKA-RII subunit is significantly decreased in the livers of the VhlLivKO mice. Genetic ablation of the PKA regulatory subunit results in loss of cAMP stimulated PKA response, and constitutive activation of PKA signaling (Cummings et al., 1996). However, there is no increase in basal PKA signaling, and 8-br-cAMP treatment induces CREB signaling and gluconeogenic gene expression in VhlLivKO mice. Therefore, we believe that the decrease in PKA-RII subunit may be a compensatory mechanism to promote PKA signaling, rather to repress glucagon signaling. PDE4 is the largest of the mammalian PDE family members, comprised of 4 genes and over 18 variants (Omori and Kotera, 2007). Among them, PDE4D has been well characterized to be a critical regulator of hepatic glucagon signaling. PDE4D activity is regulated by ERK through phosphorylation (MacKenzie et al., 2000). ERK phosphorylation is highly induced in the liver and PH from VhlLivKO mice, which is sufficient to abolish glucagon signaling through increases in PDE activity. It should be noted that inhibiting PDE4 or ERK activity did not fully restore glucagon signaling to the levels observed with the pan-PDE inhibitor IBMX, suggesting that other PDEs and/or signaling pathways might be involved in the HIF regulation of glucagon signaling. Moreover, overexpression of constitutive active MEK-ERK only resulted in modest increase in the total PDE activity as compared to activation of HIF2α. This may suggests that ERK selectively increases PDE4 activity, which in turn ablates glucagon signaling, whereas HIF2α could increase global PDE activity by mechanisms that are currently unknown. Indeed, PDE1B, 2A, 3A, 7B and 10A were increased in liver in a HIF2α dependent manner.
The importance of glucagon in the pathogenesis of diabetes is well characterized. Increased glucagon signaling leads to dysregulated glucose homeostasis, whereas a decrease in glucagon action improves glycemic index in diabetes independent of insulin sensitivity (Baron et al., 1987; Conarello et al., 2007; D’Alessio, 2011; Dunning and Gerich, 2007; Gelling et al., 2003; Lee et al., 2011; Liang et al., 2004). In this study, HIF2α was found to have a beneficial effect on glucose homeostasis in part by repressing hepatic glucagon signaling and other studies have demonstrated that HIF2α increases insulin signaling (Taniguchi et al., 2013; Wei et al., 2013). FG-4592, a PHD inhibitor that stabilizes HIF2α is under phase III clinical trial for the treatment of anemia in chronic kidney disease patients. FG-4592 or other PHD inhibitors could be highly beneficial in improving glucose homeostasis in diabetic patients through HIF2α-dependent mechanisms.
Experimental Procedures
Animals and Diets
VhlF/F, VhlLivKO Vhl/Hif1αF/F, Vhl/Hif1αLivKO, Vhl/Hif2αF/F, Vhl/Hif2αLivKO, Vhl/ArntF/F and Vhl/ArntLivKO were described previously (Anderson et al., 2012; Qu et al., 2011). For temporal hepatocyte-specific disruption of HIF2α, HIF2αF/F mice on a C57BL/6 background were crossed with mice harboring the cre-ERT2 recombinase under albumin promoter, SA-Cre-ERT2 (Schuler et al., 2004). Wild-type littermates (HIF2αF/F) were used as control. HIF2αF/F and HIF2αLivKO were fed with either normal chow or 60% high fat diet (Research diets, New Brunswick, NJ). For hypoxyprobe experiment, animals were fasted overnight and then injected intraperitoneally (i.p.) with 60 mg/kg pimonidazole, followed by refeeding for 30 minutes. For inducing hyperglycemia, mice were starved for four hours and then injected with STZ i.p. at a dose of 50 mg/kg body weight for five consecutive days or treated with 50 mg/kg MK-2206. All mice were housed at the Unit for Laboratory Animal Management (ULAM) at the University of Michigan. All animal procedures were approved by the University of Michigan Institutional Animal Care and Utilization Committee (IACUC). All mice were fed ad-libitum and kept in a 12-hour dark/light cycle with chow replenished every week.
Metabolic tests
For glucose and pyruvate tolerance test, mice on regular chow diet or high-fat diet were fasted for 16-hours and for insulin and glucagon tolerance test, mice were fasted for 6- and 5- hours, respectively. Fasted blood glucose was measured from the tail vein by tail snipping and then glucose (1.5 g/kg body weight), human insulin (Humulin, Eli and Lilly, Indianapolis, IN) (0.75 U/kg body weight), glucagon (15 μg/kg body weight) or pyruvate (2 g/kg body weight) was administered i.p. to conscious animals. Glucose was measured in blood taken from the tail vein at 15, 30, 45, 60 and 120 min post-injection.
Insulin and glucagon assay
Insulin assay and glucagon assay were performed using EIA kit from Crystal Chem (Downers Grove, IL) and RIA kit from Millipore (Temecula, CA), respectively, using manufacturers protocol.
PH isolation and treatment
PH were isolated from mice on normal chow diet at 1-week after tamoxifen treatment, unless otherwise mentioned. Briefly, livers were perfused with 10 ml of EBSS containing 0.5 mM EGTA, followed by perfusion with William’s E media containing collagenase type II (Worthington, Lakewood, NJ). Viable cells were plated in Williams E media with 10% FBS. For glucagon treatment, PH were serum starved overnight and treated with 50 nM glucagon for 2-hours (for RNA analysis) or 10-minutes (for protein studies). For inhibitor or activator studies, PH were pre-treated for 4-hours with FT13a (apelin inhibitor), Oligomycin (mitochondrial ATP synthase inhibitor), Wortmannin (PI3Kinase inhibitor), Ad-HT31 (AKAP inhibitor), WY14643 (PPARα agonist), Ad-HNF4, KN62 (CamKinase II inhibitor), FIPI (Phospholipase D inhibitor), PLA2 (Phospholipase A inhibitor), Anti-vascular growth factor a (Vegfa Ab), DEA (Diethylamine), DETA (Diethylenetriamine), GMP (8-br-cGMP), Rotenone (ETC inhibitor), Thapsigargin (ER stress inhibitor), tBHQ (tert-butylhydroquinone), 2-deoxyglucose, SU6656 (SRC kinase inhibitor), MEK inhibitor (GSK1120212 and PD98059) and FR180204 (ERK inhibitor). For PDE4 inhibitors, PH were treated with Rolipram, Glaucine, Ibudilast, and CP80,633 for 16-hours and then again treated with additional 1 μM of respective PDE inhibitors for 30 minutes before glucagon treatment. For adenoviral infection, 5-hours after plating, PH were infected with 100 MOI adenoviral particles for 48-hours or as noted in the figure legends. Ad-G6Pase luciferase virus was kind gift from Dr. Marc Montminy, Ad-MEK-ERK-LA was a kind gift from Dr. Michael Simons (Yale University, New Haven, CT), and dominant negative MEK1 adenovirus was purchased from Cell Biolabs (San Diego, CA). For luciferase assay, 16-hours post infection, PH were treated with 50 nM glucagon or 8-bromo cAMP (250 μM or 500 μM) in Williams E media without FBS for 24-hours. The cells were washed twice with PBS and lysed in reporter lysis buffer (Promega, Madison, WI) and luciferase activity were normalized to protein content.
Hepatic glucose production
Hepatocytes cultured overnight were washed with PBS and then incubated with KRB buffer for 2 hours. Following incubation, 0.5 mM pyruvate and 1mM lactate were added to the KRB buffer with or without 50 nM glucagon and incubated at 37C for additional 4-hours. Glucose release was measured using glucose kit (Stanbio Laboratories, Boerne, TX).
Cyclic AMP assay
PH were serum starved overnight, treated with 50 nM glucagon for 10 minutes and then lysed with 0.1M HCl. cAMP was measured using EIA kit (Cayman chemicals, Ann Arbor, MI).
PKA activity assay
Following overnight serum starvation, PH were treated with 50nM glucagon and lysed in MOPS buffer with protease and phosphatase inhibitor. PKA activity assay was performed following manufacturers protocol (Enzo lifesciences, Farmingdale, NY).
PDE activity assay
PDE activity was assessed in PH using PDE activity assay kit following manufacturers protocol (Abcam, Cambridge, MA).
Real-time PCR
Total RNA was reverse transcribed, and the relative amount of individual mRNA was calculated after normalizing to their corresponding β-actin mRNA, as previously described (Ramakrishnan et al., 2015). Primer sequences are included in Table S1.
Western blot
Whole cell or nuclear lysates prepared as described before (Ramakrishnan et al., 2015) were separated by SDS-PAGE, transferred to nitrocellulose membrane and probed overnight at 4C with antibodies for pCREB, CREB, pERK, ERK, pAKT, AKT, pSTAT3, pPKA substrate, STAT3, PKA-R1α/β, PKA-Cα (Cell Signaling, Danvers, MA), Lamin B1, PDE4D (Abcam,), Lamin A/C (Active motif), G6pase, Pepck, AKAP-12, GAPDH (Santa Cruz, Dallas, TX) and HIF2α (Novus, Littleton, CO) and, PKA-RII (a kind gift from Dr. Michael Uhler, University of Michigan). Densitometry of the immunoblots were done using image-J software and expressed as fold change from the control or vehicle treated samples.
Immunostaining
Frozen sections were probed with polyclonal rabbit anti-HIF2α antibody (Novus) or Hypoxyprobe (Burlington, MA) as previously described (Ramakrishnan et al., 2015).
Statistical analysis
Results are expressed as mean ± SEM. Significance among multiple groups were tested using one-way analysis of variance followed by Dunnett’s post-hoc for multiple comparisons and significance between two groups were calculated by Independent t-test.
Supplementary Material
Acknowledgments
This work was supported by NIH grants (CA148828 and DK095201 Y.M.S), The University of Michigan Gastrointestinal Peptide Center Gastrointestinal Peptide Research Center (P30 DK034933), Diabetes Research and Training Center (P30 DK20572). The NCI Intramural Research Program supported F.J.G and S.K.R was supported by a postdoctoral fellowship from AHA-James and Donna Dickenson-sublett award (15POST22650034).
Footnotes
Conflict of interests: The authors declare no conflict of interest.
Author contributions
S.K.R. and Y.M.S. conceived and designed the study. H.Z., S.K.R., H.Z., S.T., B.C., S.P., K.W. and Y.M.S. developed the methodology. S.K.R., H.Z., and S.T. acquired the data. S.K.R., H.Z., M.D.U., L.R., F.J.G. and Y.M.S. analyzed and interpreted the data.
Publisher's Disclaimer: This is a PDF file of an unedited manuscript that has been accepted for publication. As a service to our customers we are providing this early version of the manuscript. The manuscript will undergo copyediting, typesetting, and review of the resulting proof before it is published in its final citable form. Please note that during the production process errors may be discovered which could affect the content, and all legal disclaimers that apply to the journal pertain.
References
- Abdollahi M, Chan TS, Subrahmanyam V, O’Brien PJ. Effects of phosphodiesterase 3,4,5 inhibitors on hepatocyte cAMP levels, glycogenolysis, gluconeogenesis and susceptibility to a mitochondrial toxin. Molecular and cellular biochemistry. 2003;252:205–211. doi: 10.1023/a:1025568714217. [DOI] [PubMed] [Google Scholar]
- Ackerman D, Simon MC. Hypoxia, lipids, and cancer: surviving the harsh tumor microenvironment. Trends Cell Biol. 2014;24:472–478. doi: 10.1016/j.tcb.2014.06.001. [DOI] [PMC free article] [PubMed] [Google Scholar]
- Anderson ER, Taylor M, Xue X, Martin A, Moons DS, Omary MB, Shah YM. The hypoxia-inducible factor-C/EBPalpha axis controls ethanol-mediated hepcidin repression. Mol Cell Biol. 2012;32:4068–4077. doi: 10.1128/MCB.00723-12. [DOI] [PMC free article] [PubMed] [Google Scholar]
- Ang SO, Chen H, Hirota K, Gordeuk VR, Jelinek J, Guan Y, Liu E, Sergueeva AI, Miasnikova GY, Mole D, Maxwell PH, Stockton DW, Semenza GL, Prchal JT. Disruption of oxygen homeostasis underlies congenital Chuvash polycythemia. Nature genetics. 2002;32:614–621. doi: 10.1038/ng1019. [DOI] [PubMed] [Google Scholar]
- Baron AD, Schaeffer L, Shragg P, Kolterman OG. Role of hyperglucagonemia in maintenance of increased rates of hepatic glucose output in type II diabetics. Diabetes. 1987;36:274–283. doi: 10.2337/diab.36.3.274. [DOI] [PubMed] [Google Scholar]
- Cherrin C, Haskell K, Howell B, Jones R, Leander K, Robinson R, Watkins A, Bilodeau M, Hoffman J, Sanderson P, Hartman G, Mahan E, Prueksaritanont T, Jiang G, She QB, Rosen N, Sepp-Lorenzino L, Defeo-Jones D, Huber HE. An allosteric Akt inhibitor effectively blocks Akt signaling and tumor growth with only transient effects on glucose and insulin levels in vivo. Cancer biology & therapy. 2010;9:493–503. doi: 10.4161/cbt.9.7.11100. [DOI] [PMC free article] [PubMed] [Google Scholar]
- Conarello SL, Jiang G, Mu J, Li Z, Woods J, Zycband E, Ronan J, Liu F, Roy RS, Zhu L, Charron MJ, Zhang BB. Glucagon receptor knockout mice are resistant to diet-induced obesity and streptozotocin-mediated beta cell loss and hyperglycaemia. Diabetologia. 2007;50:142–150. doi: 10.1007/s00125-006-0481-3. [DOI] [PubMed] [Google Scholar]
- Cummings DE, Brandon EP, Planas JV, Motamed K, Idzerda RL, McKnight GS. Genetically lean mice result from targeted disruption of the RII beta subunit of protein kinase A. Nature. 1996;382:622–626. doi: 10.1038/382622a0. [DOI] [PubMed] [Google Scholar]
- D’Alessio D. The role of dysregulated glucagon secretion in type 2 diabetes. Diabetes, obesity & metabolism. 2011;13(Suppl 1):126–132. doi: 10.1111/j.1463-1326.2011.01449.x. [DOI] [PubMed] [Google Scholar]
- Dentin R, Liu Y, Koo SH, Hedrick S, Vargas T, Heredia J, Yates J, 3rd, Montminy M. Insulin modulates gluconeogenesis by inhibition of the coactivator TORC2. Nature. 2007;449:366–369. doi: 10.1038/nature06128. [DOI] [PubMed] [Google Scholar]
- Dunning BE, Gerich JE. The role of alpha-cell dysregulation in fasting and postprandial hyperglycemia in type 2 diabetes and therapeutic implications. Endocrine reviews. 2007;28:253–283. doi: 10.1210/er.2006-0026. [DOI] [PubMed] [Google Scholar]
- Eipel C, Abshagen K, Vollmar B. Regulation of hepatic blood flow: the hepatic arterial buffer response revisited. World J Gastroenterol. 2010;16:6046–6057. doi: 10.3748/wjg.v16.i48.6046. [DOI] [PMC free article] [PubMed] [Google Scholar]
- Exton JH, Corbin JG, Harper SC. Control of gluconeogenesis in liver. V. Effects of fasting, diabetes, and glucagon on lactate and endogenous metabolism in the perfused rat liver. J Biol Chem. 1972;247:4996–5003. [PubMed] [Google Scholar]
- Formenti F, Constantin-Teodosiu D, Emmanuel Y, Cheeseman J, Dorrington KL, Edwards LM, Humphreys SM, Lappin TR, McMullin MF, McNamara CJ, Mills W, Murphy JA, O’Connor DF, Percy MJ, Ratcliffe PJ, Smith TG, Treacy M, Frayn KN, Greenhaff PL, Karpe F, Clarke K, Robbins PA. Regulation of human metabolism by hypoxia-inducible factor. Proceedings of the National Academy of Sciences of the United States of America. 2010;107:12722–12727. doi: 10.1073/pnas.1002339107. [DOI] [PMC free article] [PubMed] [Google Scholar]
- Gallavan RH, Jr, Chou CC. Possible mechanisms for the initiation and maintenance of postprandial intestinal hyperemia. The American journal of physiology. 1985;249:G301–308. doi: 10.1152/ajpgi.1985.249.3.G301. [DOI] [PubMed] [Google Scholar]
- Gelling RW, Du XQ, Dichmann DS, Romer J, Huang H, Cui L, Obici S, Tang B, Holst JJ, Fledelius C, Johansen PB, Rossetti L, Jelicks LA, Serup P, Nishimura E, Charron MJ. Lower blood glucose, hyperglucagonemia, and pancreatic alpha cell hyperplasia in glucagon receptor knockout mice. Proceedings of the National Academy of Sciences of the United States of America. 2003;100:1438–1443. doi: 10.1073/pnas.0237106100. [DOI] [PMC free article] [PubMed] [Google Scholar]
- Gordeuk VR, Miasnikova GY, Sergueeva AI, Niu X, Nouraie M, Okhotin DJ, Polyakova LA, Ammosova T, Nekhai S, Ganz T, Prchal JT. Chuvash polycythemia VHLR200W mutation is associated with down-regulation of hepcidin expression. Blood. 2011;118:5278–5282. doi: 10.1182/blood-2011-03-345512. [DOI] [PMC free article] [PubMed] [Google Scholar]
- Habegger KM, Heppner KM, Geary N, Bartness TJ, DiMarchi R, Tschop MH. The metabolic actions of glucagon revisited. Nature reviews Endocrinology. 2010;6:689–697. doi: 10.1038/nrendo.2010.187. [DOI] [PMC free article] [PubMed] [Google Scholar]
- Herzig S, Long F, Jhala US, Hedrick S, Quinn R, Bauer A, Rudolph D, Schutz G, Yoon C, Puigserver P, Spiegelman B, Montminy M. CREB regulates hepatic gluconeogenesis through the coactivator PGC-1. Nature. 2001;413:179–183. doi: 10.1038/35093131. [DOI] [PubMed] [Google Scholar]
- Hickey MM, Lam JC, Bezman NA, Rathmell WK, Simon MC. von Hippel-Lindau mutation in mice recapitulates Chuvash polycythemia via hypoxia-inducible factor-2alpha signaling and splenic erythropoiesis. The Journal of clinical investigation. 2007;117:3879–3889. doi: 10.1172/JCI32614. [DOI] [PMC free article] [PubMed] [Google Scholar]
- Jenssen T, Nurjhan N, Consoli A, Gerich JE. Failure of substrate-induced gluconeogenesis to increase overall glucose appearance in normal humans. Demonstration of hepatic autoregulation without a change in plasma glucose concentration. The Journal of clinical investigation. 1990;86:489–497. doi: 10.1172/JCI114735. [DOI] [PMC free article] [PubMed] [Google Scholar]
- Kim C, Cheng CY, Saldanha SA, Taylor SS. PKA-I holoenzyme structure reveals a mechanism for cAMP-dependent activation. Cell. 2007;130:1032–1043. doi: 10.1016/j.cell.2007.07.018. [DOI] [PubMed] [Google Scholar]
- Koo SH, Flechner L, Qi L, Zhang X, Screaton RA, Jeffries S, Hedrick S, Xu W, Boussouar F, Brindle P, Takemori H, Montminy M. The CREB coactivator TORC2 is a key regulator of fasting glucose metabolism. Nature. 2005;437:1109–1111. doi: 10.1038/nature03967. [DOI] [PubMed] [Google Scholar]
- Lee Y, Wang MY, Du XQ, Charron MJ, Unger RH. Glucagon receptor knockout prevents insulin-deficient type 1 diabetes in mice. Diabetes. 2011;60:391–397. doi: 10.2337/db10-0426. [DOI] [PMC free article] [PubMed] [Google Scholar]
- Lewis GF, Vranic M, Giacca A. Glucagon enhances the direct suppressive effect of insulin on hepatic glucose production in humans. The American journal of physiology. 1997;272:E371–378. doi: 10.1152/ajpendo.1997.272.3.E371. [DOI] [PubMed] [Google Scholar]
- Liang Y, Osborne MC, Monia BP, Bhanot S, Gaarde WA, Reed C, She P, Jetton TL, Demarest KT. Reduction in glucagon receptor expression by an antisense oligonucleotide ameliorates diabetic syndrome in db/db mice. Diabetes. 2004;53:410–417. doi: 10.2337/diabetes.53.2.410. [DOI] [PubMed] [Google Scholar]
- MacKenzie SJ, Baillie GS, McPhee I, Bolger GB, Houslay MD. ERK2 mitogen-activated protein kinase binding, phosphorylation, and regulation of the PDE4D cAMP-specific phosphodiesterases. The involvement of COOH-terminal docking sites and NH2-terminal UCR regions. J Biol Chem. 2000;275:16609–16617. doi: 10.1074/jbc.275.22.16609. [DOI] [PubMed] [Google Scholar]
- McClain DA, Abuelgasim KA, Nouraie M, Salomon-Andonie J, Niu X, Miasnikova G, Polyakova LA, Sergueeva A, Okhotin DJ, Cherqaoui R, Okhotin D, Cox JE, Swierczek S, Song J, Simon MC, Huang J, Simcox JA, Yoon D, Prchal JT, Gordeuk VR. Decreased serum glucose and glycosylated hemoglobin levels in patients with Chuvash polycythemia: a role for HIF in glucose metabolism. Journal of molecular medicine. 2013;91:59–67. doi: 10.1007/s00109-012-0961-5. [DOI] [PMC free article] [PubMed] [Google Scholar]
- Omori K, Kotera J. Overview of PDEs and their regulation. Circulation research. 2007;100:309–327. doi: 10.1161/01.RES.0000256354.95791.f1. [DOI] [PubMed] [Google Scholar]
- Porksen S, Nielsen LB, Kaas A, Kocova M, Chiarelli F, Orskov C, Holst JJ, Ploug KB, Hougaard P, Hansen L, Mortensen HB. Meal-stimulated glucagon release is associated with postprandial blood glucose level and does not interfere with glycemic control in children and adolescents with new-onset type 1 diabetes. J Clin Endocrinol Metab. 2007;92:2910–2916. doi: 10.1210/jc.2007-0244. [DOI] [PubMed] [Google Scholar]
- Prabhakar NR, Semenza GL. Oxygen Sensing and Homeostasis. Physiology (Bethesda) 2015;30:340–348. doi: 10.1152/physiol.00022.2015. [DOI] [PMC free article] [PubMed] [Google Scholar]
- Qu A, Taylor M, Xue X, Matsubara T, Metzger D, Chambon P, Gonzalez FJ, Shah YM. Hypoxia-inducible transcription factor 2alpha promotes steatohepatitis through augmenting lipid accumulation, inflammation, and fibrosis. Hepatology. 2011;54:472–483. doi: 10.1002/hep.24400. [DOI] [PMC free article] [PubMed] [Google Scholar]
- Ramadoss P, Unger-Smith NE, Lam FS, Hollenberg AN. STAT3 targets the regulatory regions of gluconeogenic genes in vivo. Molecular endocrinology. 2009;23:827–837. doi: 10.1210/me.2008-0264. [DOI] [PMC free article] [PubMed] [Google Scholar]
- Ramakrishnan SK, Anderson ER, Martin A, Centofanti B, Shah YM. Maternal intestinal HIF-2alpha is necessary for sensing iron demands of lactation in mice. Proceedings of the National Academy of Sciences of the United States of America. 2015;112:E3738–3747. doi: 10.1073/pnas.1504891112. [DOI] [PMC free article] [PubMed] [Google Scholar]
- Ren B, Deng Y, Mukhopadhyay A, Lanahan AA, Zhuang ZW, Moodie KL, Mulligan-Kehoe MJ, Byzova TV, Peterson RT, Simons M. ERK1/2-Akt1 crosstalk regulates arteriogenesis in mice and zebrafish. The Journal of clinical investigation. 2010;120:1217–1228. doi: 10.1172/JCI39837. [DOI] [PMC free article] [PubMed] [Google Scholar]
- Schuler M, Dierich A, Chambon P, Metzger D. Efficient temporally controlled targeted somatic mutagenesis in hepatocytes of the mouse. Genesis. 2004;39:167–172. doi: 10.1002/gene.20039. [DOI] [PubMed] [Google Scholar]
- Shah YM, Ito S, Morimura K, Chen C, Yim SH, Haase VH, Gonzalez FJ. Hypoxia-inducible factor augments experimental colitis through an MIF-dependent inflammatory signaling cascade. Gastroenterology. 2008;134:2036–2048. 2048 e2031–2033. doi: 10.1053/j.gastro.2008.03.009. [DOI] [PMC free article] [PubMed] [Google Scholar]
- Taniguchi CM, Finger EC, Krieg AJ, Wu C, Diep AN, LaGory EL, Wei K, McGinnis LM, Yuan J, Kuo CJ, Giaccia AJ. Cross-talk between hypoxia and insulin signaling through Phd3 regulates hepatic glucose and lipid metabolism and ameliorates diabetes. Nature medicine. 2013;19:1325–1330. doi: 10.1038/nm.3294. [DOI] [PMC free article] [PubMed] [Google Scholar]
- Tse TF, Clutter WE, Shah SD, Cryer PE. Mechanisms of postprandial glucose counterregulation in man. Physiologic roles of glucagon and epinephrine vis-a-vis insulin in the prevention of hypoglycemia late after glucose ingestion. The Journal of clinical investigation. 1983;72:278–286. doi: 10.1172/JCI110967. [DOI] [PMC free article] [PubMed] [Google Scholar]
- Unger RH, Eisentraut AM, Madison LL. The effects of total starvation upon the levels of circulating glucagon and insulin in man. The Journal of clinical investigation. 1963;42:1031–1039. doi: 10.1172/JCI104788. [DOI] [PMC free article] [PubMed] [Google Scholar]
- Walker JN, Ramracheya R, Zhang Q, Johnson PR, Braun M, Rorsman P. Regulation of glucagon secretion by glucose: paracrine, intrinsic or both? Diabetes, obesity & metabolism. 2011;13(Suppl 1):95–105. doi: 10.1111/j.1463-1326.2011.01450.x. [DOI] [PubMed] [Google Scholar]
- Wang X, Schneider A. HIF-2alpha-mediated activation of the epidermal growth factor receptor potentiates head and neck cancer cell migration in response to hypoxia. Carcinogenesis. 2010;31:1202–1210. doi: 10.1093/carcin/bgq078. [DOI] [PMC free article] [PubMed] [Google Scholar]
- Wei K, Piecewicz SM, McGinnis LM, Taniguchi CM, Wiegand SJ, Anderson K, Chan CW, Mulligan KX, Kuo D, Yuan J, Vallon M, Morton LC, Lefai E, Simon MC, Maher JJ, Mithieux G, Rajas F, Annes JP, McGuinness OP, Thurston G, Giaccia AJ, Kuo CJ. A liver Hif-2alpha-Irs2 pathway sensitizes hepatic insulin signaling and is modulated by Vegf inhibition. Nature medicine. 2013;19:1331–1337. doi: 10.1038/nm.3295. [DOI] [PMC free article] [PubMed] [Google Scholar]
- Yap TA, Yan L, Patnaik A, Fearen I, Olmos D, Papadopoulos K, Baird RD, Delgado L, Taylor A, Lupinacci L, Riisnaes R, Pope LL, Heaton SP, Thomas G, Garrett MD, Sullivan DM, de Bono JS, Tolcher AW. First-in-man clinical trial of the oral pan-AKT inhibitor MK-2206 in patients with advanced solid tumors. Journal of clinical oncology : official journal of the American Society of Clinical Oncology. 2011;29:4688–4695. doi: 10.1200/JCO.2011.35.5263. [DOI] [PubMed] [Google Scholar]
- Zheng L, Kelly CJ, Colgan SP. Physiologic hypoxia and oxygen homeostasis in the healthy intestine. A Review in the Theme: Cellular Responses to Hypoxia. Am J Physiol Cell Physiol. 2015;309:C350–360. doi: 10.1152/ajpcell.00191.2015. [DOI] [PMC free article] [PubMed] [Google Scholar]
Associated Data
This section collects any data citations, data availability statements, or supplementary materials included in this article.