

Abstract
The systematic functional analysis of combinatorial genetics has been limited by the throughput that can be achieved and the order of complexity that can be studied. To enable massively parallel characterization of genetic combinations in human cells, we developed a technology for rapid, scalable assembly of high-order barcoded combinatorial genetic libraries that can be quantified with high-throughput sequencing. We applied this technology, combinatorial genetics en masse (CombiGEM), to create high-coverage libraries of 1,521 two-wise and 51,770 three-wise barcoded combinations of 39 human microRNA (miRNA) precursors. We identified miRNA combinations that synergistically sensitize drug-resistant cancer cells to chemotherapy and/or inhibit cancer cell proliferation, providing insights into complex miRNA networks. More broadly, our method will enable high-throughput profiling of multifactorial genetic combinations that regulate phenotypes of relevance to biomedicine, biotechnology and basic science.
Complex biological traits are regulated by the concerted action of combinatorial gene sets1. For example, multiple genetic factors are needed to reprogram somatic cells into induced pluripotent stem cells or distinct cell types2. Combinatorial drug therapies can achieve enhanced efficacy over conventional monotherapies, because targeting multiple pathways can be synergistic3. Furthermore, although genomewide association studies have implicated multiple individual loci in multifactorial human diseases, these loci can explain only a minor fraction of disease heritability4-6. Interactions between genes may account for this missing heritability but current technologies for systematically characterizing the function of high-order gene combinations are limited.
Hypothesis-driven or gene-by-gene approaches for discovering combinatorial effectors are restricted in the throughput, number and order of genetic combinations that can be tested. Recent advances in screening technologies have enabled genomewide genetic studies with individual gene overexpression7, RNA-interference-based gene knockdown8,9, and CRISPR-Cas9-based gene knockout10-13 libraries in mammalian cells. In addition, next- generation sequencing has been used to pinpoint genetic effectors via large-scale screening of gene libraries14. Methods such as plasmid co-transfections or multiple viral infections allow studies of genetic combinations using single-gene libraries but require costly and time-intensive examination of individual clones. Pooled PCR stitching15 or pairwise DNA assembly16 methods can also be used to screen for pairwise (i.e., 2-wise) genetic perturbations in pooled populations. However, these methods do not allow for the assembly of three-way (i.e., 3-wise) and higher-order genetic combinations. Techniques such as Golden Gate17, Gibson assembly18, and ligation-based assembly19 can be used for one-pot high-order combinatorial assembly of parts, but libraries built with these strategies have not been adapted for large-scale pooled screening of complex barcoded genetic constructs in human systems. Thus, there is a need for technologies that can comprehensively characterize the functions of high-order genetic combinations in a high-throughput fashion.
RESULTS
Combinatorial genetics en masse (CombiGEM) for human systems
To address these limitations, our CombiGEM technology enables the scalable pooled assembly of barcoded high-order combinatorial genetic libraries for high-throughput screening in human cells with next-generation sequencing (Fig. 1). This approach leverages an iterative cloning approach starting with an insert library of barcoded DNA elements. Restriction digestion of pooled insert libraries and the destination vector, followed by a one-pot ligation step, creates a library of genetic combinations. The combinatorial library and the same insert pool can be combined to generate higher-order combinations with concatenated barcodes that are unique for each combination, thus enabling tracking using high-throughput sequencing.
Figure 1.
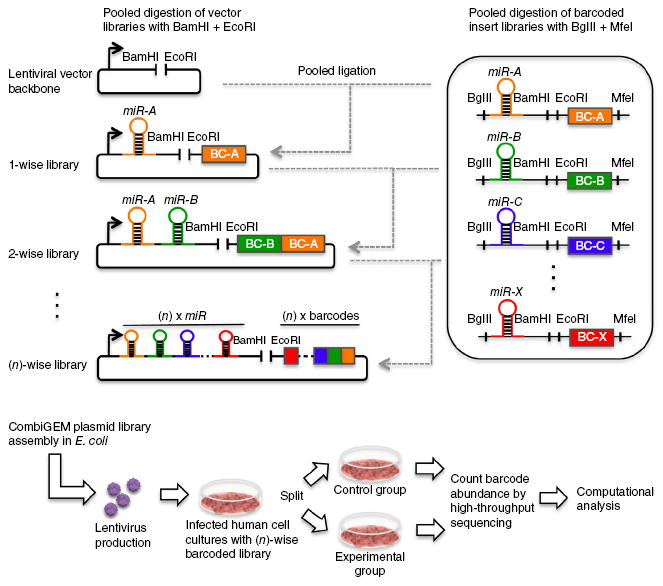
Strategy for assembling combinatorial genetic libraries and performing combinatorial miRNA screens. CombiGEM assembly uses iterative one-pot cloning of pooled single- gene insert libraries into progressively more complex (n)-wise vector libraries. miRNA precursors were barcoded (BC) and four restriction sites (BglII, MfeI, BamHI, EcoRI) were positioned as shown. The BglII/BamHI and EcoRI/MfeI pairs are unique restriction sites that are incompatible with the other pair but generate compatible overhangs within the pair. The pooled inserts and vectors were digested with BglII + MfeI and BamHI + EcoRI, respectively. A one-pot ligation created a pooled vector library, which was further iteratively digested and ligated with the same pool of inserts to generate higher-order combinations. All barcodes were localized into a contiguous stretch of DNA. The final combinatorial libraries were encoded in lentiviruses and delivered into targeted human cells. The integrated barcodes representing each genetic combination were amplified from the genomic DNA within the pooled cell populations in an unbiased fashion and quantified using high-throughput sequencing to identify shifts in representation under different experimental conditions.
The final barcoded combinatorial genetic libraries were encoded in lentiviruses to enable efficient delivery and stable genomic integration in a wide range of human cell types. Lentiviral vectors have been widely used to deliver pooled libraries for large-scale genetic screening7,11-13,16. After delivering combinatorial libraries into human cells, we performed pooled assays and extracted genomic DNA for unbiased amplification of the integrated barcodes. We then used Illumina HiSeq sequencing to quantify the abundances of the contiguous DNA barcode sequences, which represent each genetic combination within the pooled populations, and to identify shifts in representation under the different experimental conditions. We applied the CombiGEM strategy to identify genetic combinations (miRNAs in this study) that sensitize cancer cells to drugs and/or inhibit cancer cell proliferation.
Combinatorial miRNA expression system
Previous work showed that multiple miRNAs can be expressed by arranging their precursor sequences in tandem20. We confirmed the ability of our lentiviral vector to express combinatorial sets of functional miRNAs that target different miRNA target sites located downstream of a fluorescent protein (Supplementary Fig. 1). We generated lentiviral vectors encoding miRNA precursors cloned downstream of GFP to monitor expression from the cytomegalovirus (CMVp) promoter (Supplementary Fig. 1a). In addition, miRNA sensor sequences, which are targeted by their cognate miRNAs21, were added to the 3′ untranslated region of RFP driven by the ubiquitin C (UBCp) promoter in order to report on miRNA activity (Supplementary Fig. 1a). The miRNA expression and sensor cassettes were placed in a single vector to ensure constant ratios between the two components in infected cells. We confirmed that the lentiviral vectors were efficiently delivered into human embryonic kidney cells (HEK293T; Supplementary Fig. 2) and human dermal fibroblasts (data not shown).
We anticipated that active miRNAs would target their sensor sequences, thus reducing RFP fluorescence levels. Flow cytometry analysis showed that cells expressing miRNAs but without sensors produced both GFP and RFP, whereas those cells expressing miRNAs and harboring cognate sensors lost RFP fluorescence, indicating repression by miRNAs (Supplementary Fig. 1b). In addition, distinct pairwise and three-wise miRNA combinations exhibited repression activities (Supplementary Fig. 1c) comparable to their respective individual miRNA constructs (Supplementary Fig. 1b). This effect did not result from cross-reactivity between the miRNAs and noncognate sensors (Supplementary Fig. 1d). These results demonstrate the ability of lentiviral vectors to encode combinatorial miRNA expression in human cells.
Generation of high-coverage combinatorial miRNA libraries
Given the high efficiency of gene repression achieved by our lentiviral combinatorial miRNA expression system, we then constructed barcoded combinatorial miRNA libraries. We sought to systematically evaluate the combinatorial effects of miRNA overexpression on anti-cancer phenotypes. We selected a list of 39 miRNAs that were previously reported to be downregulated in drug-resistant cancer cells or to exhibit altered expression in ovarian cancer cells (Supplementary Tables 1 and 2). The expression of these 39 miRNAs in human ovarian cancer (OVCAR8) cells and its drug-resistant derivative OVCAR8-ADR22 cells was previously demonstrated in miRNA profiling studies23-25. Using ProteomicsDB26, we found that ~59.8% (2,598 out of 4,343) of the experimentally validated targets of the 39 miRNAs, which were retrieved from miRTarBase27, are expressed in OVCAR8-ADR cells (Supplementary Table 3). A barcoded library comprising the 39 miRNA precursor sequences was first cloned into storage vectors. Using CombiGEM, we created two-wise (39 × 39 miRNAs = 1,521 total combinations) and three-wise (39 × 39 × 39 miRNAs = 59,319 total combinations) pooled miRNA libraries with all the respective barcodes localized at one end (Fig. 1).
Lentiviral pools were then produced and titrated to a multiplicity of infection (MOI) of ~0.3–0.5 to deliver the combinatorial libraries into human cells at low copy numbers (Fig. 2). To ensure high-quality screens with high-coverage libraries containing a sufficient representation for most combinations28, we used ~300-fold more cells for lentiviral infection than the size of the combinatorial library being tested. Thus, any spurious phenotype resulting from any given random integrant should be reduced by averaging over the population.
Figure 2.
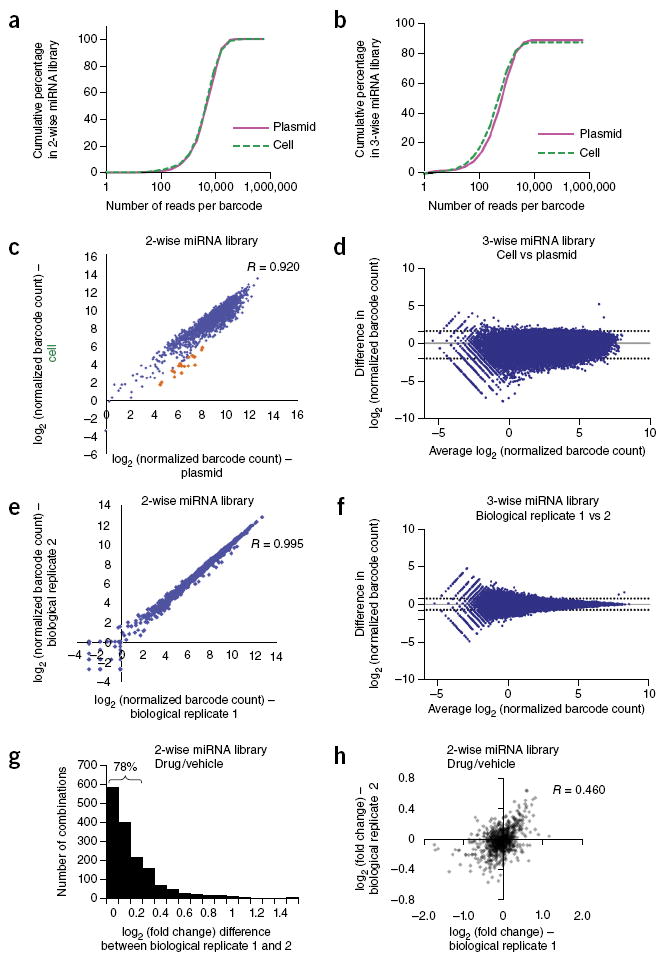
High-coverage combinatorial miRNA libraries can be efficiently generated and delivered to human cells. (a,b) Cumulative distribution of sequencing reads for barcoded two-wise (a) or three-wise (b) miRNA combinatorial libraries in the plasmid pools extracted from E. coli and the infected OVCAR8-ADR cell pools. Full coverage for all expected two-wise combinations within both the plasmid and infected cell pools was obtained, and less than 2% of two-wise combinations were represented by <100 barcode reads (a). High coverage of the three-wise library (b) within the plasmid and infected cell pools (~89% and ~87%, respectively) was achieved, and ~10–15% of the combinations were represented by <100 barcode reads. (c,d) High correlations between barcode representations (log2 values of normalized barcode counts) within the plasmid and infected OVCAR8-ADR cell pools indicate efficient lentiviral delivery of the two-wise (c) and three-wise (d) libraries into human cells. The under-represented combinations in the human cell library relative to the plasmid library are highlighted in orange (Q value < 0.1). (e,f) High reproducibility for barcode representations between two biological replicates in OVCAR8-ADR cells infected with the two-wise (e) or three-wise (f) combinatorial miRNA libraries. (g,h) Log2 fold-change (i.e., log2 ratio of the normalized barcode count for docetaxel (25 nM)-treated versus vehicle-treated OVCAR8-ADR cells infected with the two-wise library) difference (g) and correlation (h) for the two-wise combinations between two biological replicates. Seventy-eight percent of two-wise combinations had log2 fold-change differences of <0.3 between two biological replicates. R is the Pearson correlation coefficient. The dotted lines in the Bland-Altman plots shown in (d) and (f) indicate the 95% limits of agreement.
Genomic DNA from pooled populations was isolated for barcode amplification by optimized PCR conditions to achieve unbiased amplification (Supplementary Fig. 3). Illumina HiSeq sequencing was used to quantify the representation of individual barcoded combinations in the plasmid pools stored in Escherichia coli and also in the infected human cell pools (Fig. 2a,b). We detected all the expected two-wise combinations within both the plasmid and infected cell pools from ~5–10 million reads per sample (Fig. 2a). We found that 19 two-wise combinations composed of the miR-16-1/15a cluster paired with 19 different miRNAs were under-represented in infected cells relative to the plasmid pool (highlighted in orange in Fig. 2c). This observation could potentially be explained by reports indicating that miR-16-1 or miR-15a overexpression can inhibit clonal growth and proliferation in ovarian cancer cells29.
In addition, we detected ~89% and ~87% (51,770 total) of the expected three-wise combinations within the plasmid and infected cell pools, respectively, out of ~30 million total reads per sample (Fig. 2b). Greater coverage in the libraries could be attained by scaling up library transformations and increasing the number of sequencing reads per sample30. Such efforts could help to increase coverage of the missing three-wise combinations (~11% of the total expected combinations) in the plasmid library. We also detected a small set (~2%) of three-wise combinations that were present in the plasmid library, but were absent in the infected cell pools (Supplementary Table 4). These combinations could have been lost owing to low representation in the plasmid library or inhibitory effects on cell survival and/or proliferation. Furthermore, we observed high correlations between barcodes represented in the plasmid and infected cell pools (Fig. 2c,d), as well as high reproducibility in barcode representation between biological replicates within cell pools independently infected with the same combinatorial miRNA libraries (Fig. 2e,f). Thus, CombiGEM can be used to efficiently assemble and deliver high-order combinatorial genetic libraries into human cells.
High-throughput two-wise combinatorial screen
To identify combinatorial miRNAs that modify chemotherapy drug sensitivity, we infected OVCAR8-ADR cells with the two-wise bar-coded combinatorial miRNA library (Fig. 3a). One half of the pooled population was treated with the chemotherapeutic drug docetaxel (Taxotere) whereas the other half was exposed to vehicle control. After 4 days, genomic DNA was isolated from both cell populations for quantification of the integrated barcodes. Comparison of the barcode abundances (normalized per million reads) between the drug-treated and control groups yielded log2 (barcode count ratios) values, which we used as a measure of drug sensitivity. Cells with miRNA combinations conferring enhanced drug resistance or sensitivity were expected to have positive or negative log2 ratios, respectively. This screen was performed in duplicate, and high reproducibility of barcode representation was observed between biological replicates (Pearson correlation coefficient (R) > 0.95) (Supplementary Fig. 4a). To reduce variability, we filtered out combinations with less than ~100 absolute reads in the control group, and averaged the log2 ratios of the two potential arrangements for each miRNA pair (i.e., for two-wise miRNA combinations: miR-A + miR-B and miR-B + miR-A) (Supplementary Fig. 5). A majority (78%) of combinations showed a small difference (<0.3) of log2 ratios between biological replicates (Fig. 2g) and the log2 ratios between biological replicates had a correlation of R = 0.460 (Fig. 2h). Differences in phenotype-modifying effects measured between independent experiments can result from modest differences in the levels of the toxic selection pressure applied31, as well as the Poisson sampling error from repeated cell passaging through a population bottleneck32. The reproducibility of log2 ratios between biological replicates can be improved by increasing the fold representation of cells per combination in the pooled screens16.
Figure 3.
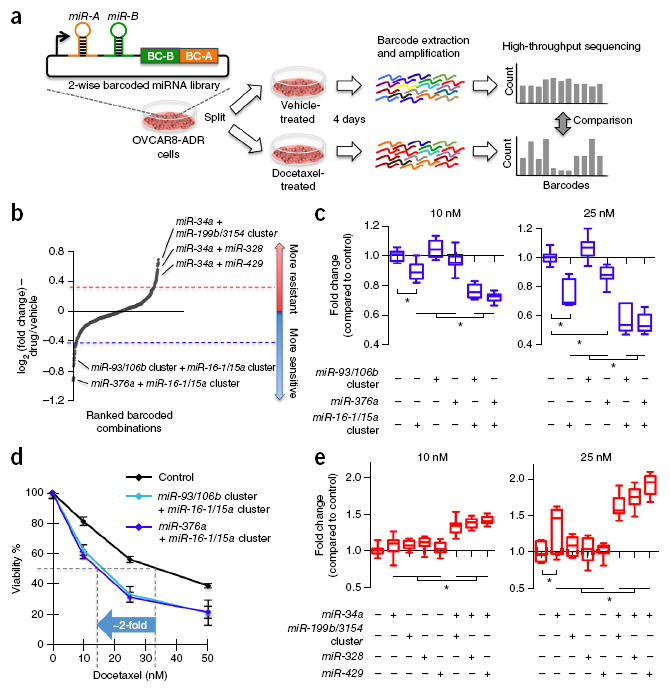
Two-wise combinatorial screen reveals miRNA combinations that confer docetaxel resistance or sensitization in cancer cells. (a) OVCAR8-ADR cells infected with the two-wise combinatorial miRNA library were split into two groups and treated with 25 nM of docetaxel or vehicle control for 4 days. The barcodes of each combinatorial miRNA construct were amplified by PCR from the genomic DNA within the cell pools in an unbiased fashion and counted using Illumina HiSeq. (b) Two-wise miRNA combinations that modulated docetaxel sensitivity were ranked by their mean log2 ratios of the normalized barcode count for docetaxel (25 nM)-treated cells to that for vehicle- treated cells from two biological replicates. The highlighted miRNA combinations were further validated in this study. (c–e) Validation of two-wise miRNA combinations conferring docetaxel sensitization (c,d) and resistance (e). OVCAR8-ADR cells infected with single miRNA, two-wise miRNAs or vector control were treated with docetaxel at indicated doses for 3 days. Cell viability relative to vector control (c,e) or no-drug control (d) was determined by the MTT assay. Dose-response analysis showed that OVCAR8-ADR cells infected with the combination of the miR-16-1/15a cluster with the miR-93/106b cluster or miR-376a reduced the IC50 of docetaxel by about twofold (d). Data are mean ± s.d. (n ≥ 10), and data of c and d were obtained from the same experiments. *P < 0.05.
We then ranked the miRNA combinations based on their mean log2 ratios from two biological replicates (Fig. 3b). We defined the top hits as combinations with log2 ratios that were >0.32 or <−0.42 (i.e., with >25% more or fewer barcode counts in experimental versus control group) and recovered at a low false-discovery rate (FDR). Thirty-six and 24 two-wise miRNA combinations were observed to have log2 ratios of >0.32 and <−0.42 (i.e., with >25% more or fewer barcode counts in docetaxel-treated cells compared to control), respectively. We calculated the statistical significance of the log2 ratios relative to the overall population based on FDR-adjusted P-values (i.e., Q values)33. The Q-value cutoff was set such that the expected number of false positives among the significant log2 ratios was <1. At an FDR of 3% (i.e., Q value < 0.03), 12 combinations were identified as hits for drug sensitizers (Supplementary Table 5) and 17 combinations were considered as hits for enhancing docetaxel resistance (Supplementary Table 6).
We confirmed the drug-sensitizing or resistance-enhancing effects of selected miRNA pairs from these hits with individual drug-sensitivity assays and found that miRNA combinations could enhance drug sensitivity over their individual components. Previous work has shown that expression of the miR-16/15 precursor family sensitized drug-resistant gastric cancer cells to chemotherapeutic drugs34. In line with this finding, we found that expression of the miR-16-1/15a cluster increased docetaxel sensitivity in OVCAR8-ADR cells, resulting in a ~10–20% decrease in cell viability when co-applied with docetaxel compared to the vector control (Fig. 3c). Notably, the drug-sensitization effect of the miR-16-1/15a cluster approximately doubled when it was expressed in combination with the miR-93/106b cluster or miR-376a. The miR-93/106b cluster or miR-376a on their own only slightly altered docetaxel sensitivity and resulted in less than ~5–10% reductions in cell viability when co-administered with docetaxel (Fig. 3c). When the miR-16-1/15a cluster was combined with the miR-93/106b cluster or miR-376a, the half maximal inhibitory concentration (IC50) of docetaxel was reduced by about twofold (Fig. 3d), resulting in killing nearly comparable to that in the parental OVCAR8 cells treated with the same drug dose (Supplementary Fig. 6). These results demonstrate the ability of CombiGEM to identify effective combinatorial miRNAs for sensitizing drug-resistant cancer cells to chemotherapy.
We also validated miRNA combinations that enhanced docetaxel resistance in OVCAR8-ADR cells. It has been demonstrated that over-expression of miR-34a confers docetaxel resistance in breast cancer cells35. Consistent with this observation, miR-34a was frequently represented in combinations that showed increased docetaxel resistance in OVCAR8-ADR cells (12 out of 17 combinations) (Supplementary Table 6). We confirmed that cells expressing miR-34a in combination with the miR-199b/3154 cluster, miR-328 or miR-429 developed profound resistance toward 25 nM of docetaxel treatment, resulting in increased cell viability by ~1.6 to 1.9-fold in the presence of drug when compared to the vector control (Fig. 3e). Elevated resistance resulted from the synergistic combination of miR-34a and each of these three additional miRNAs, as miR-34a expression only slightly enhanced docetaxel resistance by ~1.3-fold, and expression of the miR-199b/3154 cluster, miR-328 or miR-429 on their own did not substantially affect docetaxel sensitivity (Fig. 3e). Our results thus support a central role for miR-34a overexpression in increasing docetaxel resistance in OVCAR8-ADR cells and demonstrate that miR-34a can act in concert with other miRNAs to regulate important cellular phenotypes. In summary, we established an experimental pipeline for the systematic screening of barcoded two-wise miRNA combinations that modulate biological phenotypes.
Massively parallel three-wise combinatorial screens
We next sought to perform high-throughput genetic screens with higher-order combinatorial libraries to demonstrate the scalability of the CombiGEM approach (Fig. 4a). We infected OVCAR8-ADR cells with the three-wise barcoded combinatorial miRNA library. Using the same experimental procedures as for the two-wise screen described above, we conducted a massively parallel pooled screen to isolate three-wise miRNA combinations that modulated docetaxel sensitivity. We observed highly reproducible barcode representation between two biological replicates in both experimental conditions (R > 0.97), and a stronger correlation for combinations with more barcode reads (Supplementary Fig. 4b). To measure drug sensitivity, we determined the log2 ratio between the normalized barcode reads in the treatment versus control groups (Supplementary Fig. 5). A small difference (<0.3) of log2 ratios between biological replicates was detected for 88% of the combinations, and the overall correlation was R = 0.258 (Supplementary Fig. 7a). miRNA combinations were ranked based on their mean log2 ratios from the two replicates (Fig. 4b), and Q values were calculated to evaluate the statistical significance of their log2 ratios compared with the entire population. Eighty-one and 25 three-wise miRNA combinations were defined as drug-sensitizing (Supplementary Table 7) and resistance-enhancing (Supplementary Table 8) hits with docetaxel treatment, respectively (log2 ratio <−0.42 or > 0.32; Q value < 0.005). We corroborated the effects of selected three-wise miRNA combinations with individual drug sensitivity assays (Fig. 4c). For example, expression of the miR-16-1/15a cluster, miR-181c and the let-7e/miR-99b cluster together led to about a twofold reduction in the IC50 of docetaxel compared with untreated cells.
Figure 4.
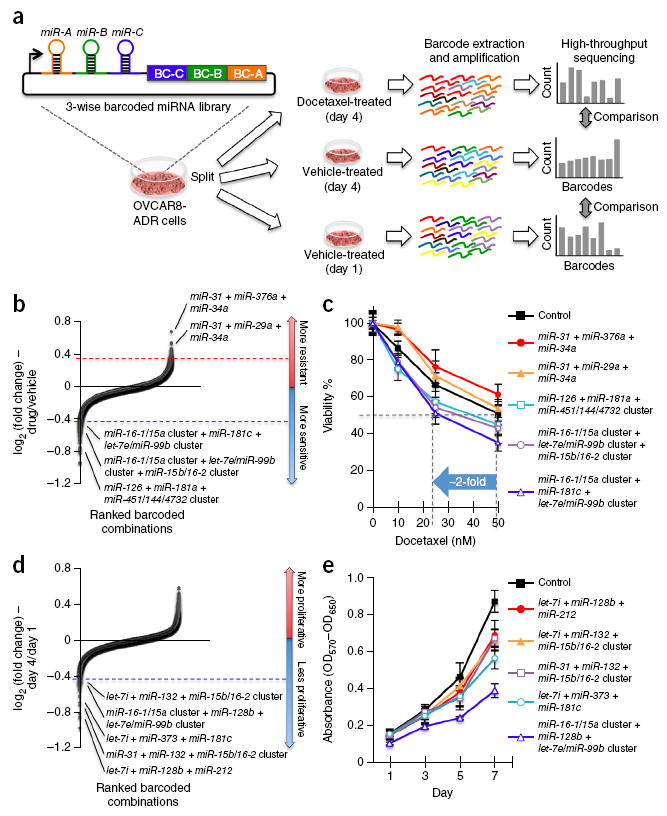
Three-wise combinatorial screens identify miRNA combinations modifying docetaxel sensitivity or proliferation in cancer cells. (a) OVCAR8-ADR cells infected with the three-wise combinatorial miRNA library were split into three groups, and treated with 25 nM of docetaxel or vehicle for 4 days, or cultured with vehicle for 1 day. The barcodes of each combinatorial miRNA construct were amplified by PCR from the genomic DNA within the cell pools in an unbiased fashion, and counted using Illumina HiSeq. (b–e) Three-wise miRNA combinations and validation. Combinations that modulated docetaxel sensitivity (b) and proliferation (d) of OVCAR8-ADR cells were ranked by their mean log2 ratios from two biological replicates. The log2 ratios of the normalized barcode count for docetaxel (25 nM)-treated versus 4-day vehicle-treated cells (b) and 4-day versus 1-day cultured cells (d) were used as the measure of docetaxel sensitivity and cell proliferation, respectively. For validation of combinations, OVCAR8-ADR cells infected with combinations that altered docetaxel sensitivity were treated with docetaxel at different doses for 3 days (c) and those that modulated proliferation were treated for the indicated time periods (e). Cell viability was measured by the MTT assay, and was compared to the no-drug control (c; n ≥ 5) or characterized by absorbance measurements (OD570−OD650) (e; n ≥ 4). Data represent mean ± s.d.
Using the same three-wise combinatorial miRNA library and experimental pipeline, we systematically evaluated the effect of combinatorial miRNAs on cancer cell proliferation (Fig. 4a). OVCAR8-ADR cells infected with the three-wise combinatorial miRNA library were cultured for 1–4 days, and each integrated barcode was quantified to obtain a log2 ratio between its abundance at day 4 versus day 1. MicroRNA combinations conferring a growth advantage were expected to have positive log2 ratios, whereas miRNA combinations inhibiting cell proliferation were expected to yield negative log2 ratios. Ranked log2 ratios for each miRNA combination were averaged from two biological replicates (Fig. 4d and Supplementary Fig. 5). Ninety percent of the combinations showed a small difference (<0.3) of log2 ratios between the replicates, and the correlation observed was R = 0.168 (Supplementary Fig. 7b). Twenty-seven miRNA combinations were shown to exert considerable antiproliferative effects (log2 ratio <−0.42; Q value < 0.005) (Supplementary Table 9). We validated these three-wise miRNA hits by demonstrating their ability to inhibit the growth of OVCAR8-ADR cells in individual cell proliferation assays (Fig. 4e). For example, the three-wise expression of the miR-16-1/15a cluster, miR-128b and the let-7e/miR-99b cluster led to a large reduction in cell growth (i.e., >55% decrease in viable cell numbers on day 7). Collectively, these results demonstrate that CombiGEM enables the identification of high-order miRNA combinations that are capable of achieving drug sensitization and anti-proliferative effects.
MicroRNA interactions modulate anti-cancer phenotypes
Using the log2 ratios from our screens as indices for drug sensitivity and proliferation, we constructed a two-dimensional heatmap (Fig. 5a) and three-dimensional plots (Fig. 5b,c and Supplementary Fig. 8) presenting docetaxel sensitivity and cell proliferation phenotypes conferred by the two-wise and three-wise miRNA combinations, respectively. Hierarchical clustering was carried out to group miRNA combinations that shared similar drug sensitization profiles together in order to enhance visualization. These plots revealed insights into previously unexamined roles that combinatorial miRNAs play in modulating drug-resistance and cell-growth phenotypes. For instance, most two-wise and three-wise combinations that contained miR-34a conferred cellular resistance against docetaxel and anti-proliferative effects (Fig. 5a–c). In addition, many combinations encoding miRNAs, such as the miR-16-1/15a cluster or the miR-15b/16-2 cluster, sensitized cells to docetaxel (Fig. 5a,b), while exerting differential effects on proliferation (Fig. 5c).
Figure 5.
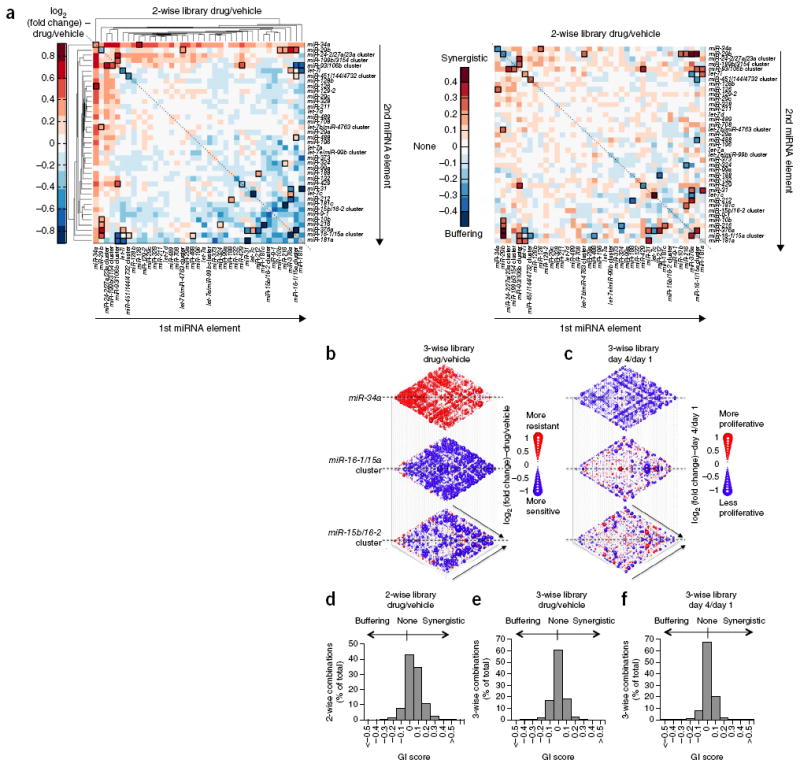
High-throughput profiling of miRNA combinations reveals genetic interactions for modulation of docetaxel sensitivity and/or cell proliferation phenotypes. (a) Two-dimensional heatmap (left panel) and genetic interaction map (right panel) depicting the docetaxel sensitivity of cells harboring two-wise miRNA combinations and the genetic interaction (GI) scores of the miRNA pairs, respectively. Docetaxel sensitivity was measured by the log2 ratios of the normalized barcode counts for docetaxel-treated versus vehicle-treated OVCAR8-ADR cells. Drug- resistance and drug-sensitization phenotypes have log2 ratios of >0 and <0, respectively. Data for miRNA pairs with <100 absolute barcode reads in the control sample were filtered out and are denoted in gray. miRNAs were clustered hierarchically based on their log2 ratios. GI scores for all two-wise combinations were calculated. Synergistic and buffering interactions were defined as GI scores of >0 and <0, respectively, which correspond to situations when an observed combinatorial phenotype deviated further from or less than the expected phenotype produced by an additive model, respectively. miRNA pairs for which no GIs were measured are indicated in gray. miRNAs on the GI map (right panel) are displayed in the same order as in the log2 heatmap (left panel). (b,c) Three- dimensional plots illustrating the docetaxel-sensitizing (b) and proliferation-modulating (c) effects of three- wise miRNA combinations. The log2 ratios of the normalized barcode counts for docetaxel-treated versus 4-day vehicle-treated OVCAR8-ADR cells (b) or 4-day versus 1-day cultured cells (c) were determined for all three-wise miRNA combinations. Log2 ratios for drug-resistance (log2 ratio > 0) and drug-sensitization (log2 ratio < 0) phenotypes (b), as well as pro-proliferation (log2 ratio > 0) and anti-proliferation (log2 ratio < 0) phenotypes (c), are represented by the colored bubbles. Each two-dimensional plane is arranged in the same hierarchically clustered order as in a, and the additional third miRNA element is labeled. (d–f) Distribution of GI scores determined for the drug-sensitivity screen with the 2-wise (d) and 3-wise (e) miRNA combinations, and the cell-proliferation screen with the 3-wise miRNA combinations (f). miRNA combinations were plotted in histograms based on their GI scores to evaluate the frequency of genetic interactions. GI scores calculated for a given three-wise miRNA combination represent the interaction between the third miRNA with the remaining two miRNAs in combination. All log2 ratios and GI scores shown were determined from the mean of two biological replicates.
These cancer-relevant phenotypes may arise from miRNA interactions. However, interactions between miRNAs have not yet been systematically studied. As a pilot analysis, we defined genetic interaction (GI) scores for each two-wise and three-wise miRNA combinations based on a previously described scoring system16. In general terms, combinations that exhibited stronger phenotypes than predicted through the additive effect of individual phenotypes were defined as synergistic, whereas combinations with weaker than expected phenotypes based on an additive model were defined as buffering (see Online Methods and Supplementary Fig. 9 for GI score definitions). Most (80%) of the two-wise combinations had a small GI score difference (<0.2) between biological replicates, and the correlation coefficient observed for the GI scores between the replicates was 0.208 (Supplementary Fig. 10a). Ninety percent (Supplementary Fig. 10b) and 93% (Supplementary Fig. 10c) of the three-wise combinations had GI score differences of <0.2 between biological replicates in the drug sensitivity and cell proliferation screens, respectively, and the respective correlation coefficients determined for the GI scores between the replicates were 0.177 (Supplementary Fig. 10b) and 0.204 (Supplementary Fig. 10c).
We computed the statistical significance of GI scores relative to the overall population based on Q values33. In all cases, the Q-value cutoff was set such that the expected number of false positives among the significant GIs was ~1 or less. At an FDR of 3% (i.e., Q value < 0.03), 29 significant interacting miRNA pairs were identified from the drug-sensitivity screen with the two-wise combinatorial miRNA library (Supplementary Table 10). These miRNA pairs are highlighted in the GI maps showing GI scores for all two-wise miRNA interactions (Fig. 5a,d). We found that our validated two-wise miRNA combination showed synergy at this cutoff. For example, a synergistic effect between the miR-16-1/15a cluster and the miR-93/106b cluster to increase drug sensitization was detected (Q value = 0.00356; Fig. 5a). We further computed GI scores for the three-wise miRNA combinations and found that the addition of a third miRNA element could interact with two-wise miRNA combinations to modify biological phenotypes (Fig. 5e,f and Supplementary Fig. 11). We observed 512 and 525 such interactions in modulating drug sensitivity and cell proliferation, respectively, which were considered significant at a Q-value cutoff of <0.002 (Supplementary Tables 11 and 12).
MicroRNA combinations with both drug-sensitizing and anti-proliferation phenotypes
Combining our high-throughput screening data for drug sensitization and inhibition of cell proliferation, we profiled miRNA combinations based on their ability to modulate both drug resistance and cancer cell growth (Supplementary Fig. 12). We compared the drug sensitization and anti-proliferation effects of three-wise miRNA combinations with their respective single and two-wise combinations in individual drug sensitivity and cell proliferation assays (Fig. 6). We found that the expression of the miR-16-1/15a cluster alone or together with the let-7e/miR-99b cluster resulted in slight sensitization of cells to docetaxel and reduced cell viability by <10% when co-administrated with the drug (Fig. 6a–c). This docetaxel sensitization was increased by about twofold in cells co-expressing the miR-16-1/15a cluster, the let-7e/miR-99b cluster and the miR-15b/16-2 cluster (Fig. 6c). In the absence of the miR-16/15 precursor family, miRNAs such as the let-7e/miR-99b cluster, miR-128b, miR-181c and miR-132 by themselves and many of their respective paired combinations did not exhibit docetaxel-sensitizing phenotypes (Fig. 6a–f). These results therefore demonstrate that the miR-16/15 precursor family plays a critical role within miRNA combinations in promoting docetaxel sensitization, and that its sensitizing capacity can be modulated by the co-expression of specific miRNA partners.
Figure 6.
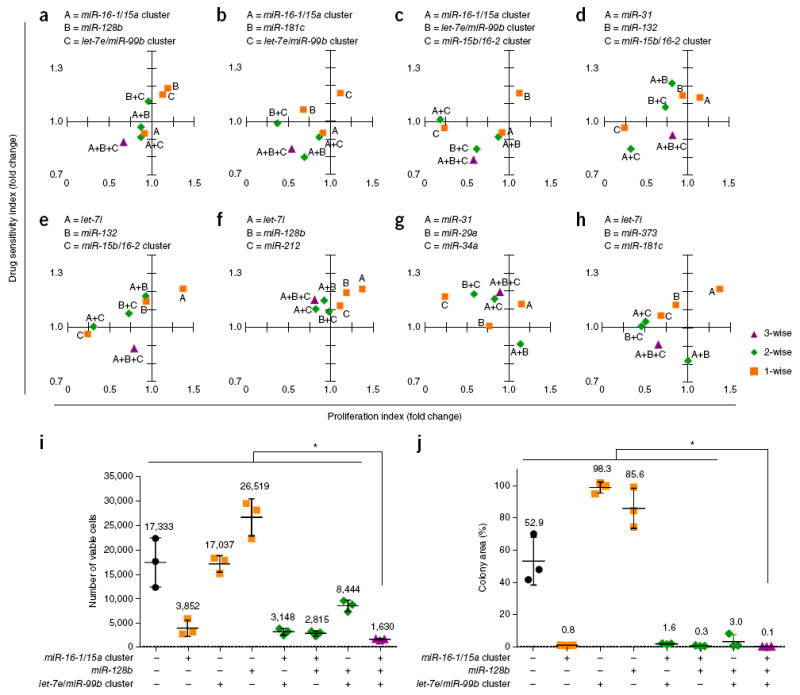
miRNA combinations can modulate both docetaxel sensitivity and cancer cell proliferation. (a–h) Scatter plots comparing the drug-sensitization and proliferation-modulating effects of three-wise miRNA combinations with their respective single and two-wise combinations. Relative cell viabilities for 3-day docetaxel (25 nM)-treated versus vehicle-treated OVCAR8-ADR cells and absorbances (OD570 - OD650) for 7-day versus 1-day cultured cells were determined by MTT assays. Drug-sensitivity (y-axis; n ≥ 5) and cell-proliferation (x-axis; n ≥ 3) indexes were obtained by dividing the relative viability and absorbance determined for each miRNA combination by that for the empty vector control without miRNA. All data were obtained from the same sets of experiments. To enable comparisons between the three-wise miRNA combinations with their respective single and two-wise combinations, data for the same miRNA or miRNA combinations are repeated in the plots. (i,j) Combinatorial expression of the miR-16-1/15a cluster, miR-128b, and the let-7e/miR-99b cluster with docetaxel achieved significantly enhanced overall anti-cancer effects. OVCAR8-ADR cells infected with the indicated miRNA combinations were treated with 25 nM of docetaxel for 3 days. Viable cell numbers were determined by the trypan blue exclusion assay (i). The docetaxel-treated cells were cultured for another 11 days, and stained with crystal violet. The colony area percentage for each sample was quantified (j). Data represent mean ± s.d. (n = 3). *P < 0.05.
Our results also identified miRNA combinations that regulate cancer cell growth. We found that miR-181c expression inhibited cancer cell growth by ~30% and that this antiproliferative effect was potentiated to ~50–60% when miR-181c was expressed in combination with the let-7e/miR-99b cluster (Fig. 6b), let-7i or miR-373 (Fig. 6h), even though these miRNAs did not inhibit cell proliferation on their own. Furthermore, the three-wise expression of the miR-16-1/15a cluster, the let-7e/miR-99b cluster and miR-128b resulted in >2.5-fold increases in antiproliferation compared to when these miRNAs were expressed individually and in pairs (Fig. 6a).
Through these analyses, we found and validated miRNA combinations that could modulate both drug-sensitization and cell-growth phenotypes. For example, the integrated docetaxel-sensitizing and anti-proliferative functions of the miR-16-1/15a cluster, the let-7e/miR-99b cluster and miR-128b together (Fig. 6a) led to significantly enhanced killing of drug-resistant OVCAR8-ADR cells with docetaxel, and resulted in a reduction of >90% in viable cells compared to the vector control group (Fig. 6i). This three-wise miRNA combination greatly reduced the ability of treated OVCAR8-ADR cells to form viable colonies after drug treatment by ~99.8% (Fig. 6j and Supplementary Fig. 13).
DISCUSSION
We have developed a method for the facile construction of barcoded high-order genetic combinations that can be tracked using next-generation sequencing, thus enabling studies of massively parallel combinatorial genetics in human cells. Our work validates the entire pipeline, including combinatorial library assembly, library verification, pooled screening assays with barcode sequencing, computational analysis and hit validation, in a relevant human cell model of disease. We observed high reproducibility and consistency between data collected from the screens and individual validation assays (Supplementary Fig. 14), indicating that CombiGEM screening can identify candidate genetic combinations with specific phenotypes.
In addition, we uncovered combinatorial miRNAs that modulate docetaxel sensitivity and/or cellular proliferation in drug-resistant ovarian cancer cells, and discovered previously unknown miRNA combinations that enhance the net anti-cancer effect of drug treatment. Further investigation into mechanisms that underlie the effects of combinatorial miRNA perturbations could include studying the genes and cellular pathways targeted by the miRNAs36 and their interaction networks37. For example, we used TargetScan to identify conserved sites that match the seed region of miRNAs38 and miRTarBase to search for experimentally validated miRNA-target interactions27 for the miR-16/15a cluster, the let-7e/miR-99b cluster and/or miR-128b. Based on a literature search for relevance to cancer, we narrowed this list down to 22 mRNAs as targets to investigate further. Within these targets, we demonstrated that the mRNA levels of four cell-cycle-related and DNA-damage-response-related genes (i.e., CCND1, CCND3, CCNE1 and CHEK1) were significantly decreased by ~20–40% in OVCAR8-ADR cells expressing the miR-16-1/15a cluster, as well as in cells co-expressing the miR-16-1/15a cluster, the let-7e/miR-99b cluster and miR-128b (Supplementary Fig. 15a). Furthermore, the mRNA level of CDC14B, a regulator that controls transcription during the cell cycle39, was reduced by ~40% in cells co-expressing the let-7e/miR-99b cluster and miR-128b, but not in cells expressing the miR-16-1/15a cluster alone (Supplementary Fig. 15b). Thus, the combined activities of the miR-16-1/15a cluster, the let-7e/miR-99b cluster, and miR-128b can downregulate the mRNA levels of multiple cell-cycle and DNA-damage response regulators. These targets and others, including those genes whose translation is modulated by miRNA overexpression40, could potentially contribute to the observed anti-cancer phenotypes and should be investigated with in-depth characterization in future studies (Supplementary Fig. 15c). Our methods may also assist emerging strategies for anti-cancer combination therapies devised to target multiple genes to achieve synthetic lethality41 and could also enable the prioritization of targets for future development of combinatorial miRNA therapeutics.
More broadly, CombiGEM can be applied to study a variety of complex biological traits relevant to cancer and other biomedical applications. Large-scale profiling studies of human genomes have enumerated lists of miRNAs, genes and gene regulatory elements that are associated with many human diseases, including cancers42-44. Genome-wide association studies have further identified sets of loci that are linked to various complex human illnesses, such as neurode-generative45 and heart46 diseases. However, the combinatorial effects of these associated genes and their potential epistatic interactions are largely uncharacterized and could vary across different cell types with varying genetic backgrounds (Supplementary Fig. 16). A benefit of CombiGEM is that once a combinatorial library is constructed, it can be easily incorporated into a variety of cell types to dissect the effects of genetic combinations in diverse cellular backgrounds using the same data-analysis pipeline. Thus, CombiGEM could be used to rapidly characterize phenotypes resulting from combinatorial genetic interactions to further our understanding of complex diseases. For example, large-scale combinatorial genetic screens could be used to perturb and discover gene networks that affect important phenotypes such as cancer cell invasion and metastasis47, neurodegeneration48, and cellular reprogramming49. Moreover, systematically mapping the phenotypes of combinatorial genetic signatures could allow them to be used as biomarkers for predicting drug responses and other disease-related phenotypes.
CombiGEM enables the scalable generation of high-order barcoded combinatorial libraries, but a practical consideration for large-scale pooled screening is the limited number of cells that can be cultured in a given experimental setting, which can determine the number of combinations that can be studied at once. Advancements and scale-ups in cell culture systems should allow pooled screens to be performed at larger scales and with enhanced confidence via greater representation of library members. Computational analysis to prioritize a limited set of putative gene candidates to be studied could also help to constrain the scalability challenges associated with large high-order combinatorial screens.
In addition, CombiGEM could be extended to implement combinations of diverse genetic elements to achieve both upregulation and downregulation of desired targets. These elements could include gene overexpression constructs7, short hairpin RNAs for genetic knockdowns9, miRNA sponges50, large intergenic noncoding RNAs51, and CRISPR-Cas9-based genome engineering toolkits and regulatory modulators52,53. A drawback of using lentiviral systems is its packaging limit of ~7 kilobases, which poses a restriction for combinatorial overexpression of full-length open reading frames. Small genetic effectors such as short hairpin RNA for mRNA knockdown and CRISPR-Cas guide RNAs for the activation, repression, and/or knockout of endogenous genes could enable multiple combinatorial perturbations to be accommodated within a single lentiviral vector. To accommodate even larger combinatorial constructs, one could construct the genetic libraries in destination vectors for integration into genomic safe harbor sites using established tools based on zinc finger, TALE, CRISPR-Cas9 (ref. 54) or recombinase-based landing pads55. Ultimately, we envision that CombiGEM will facilitate the unbiased mapping and modulation of complex gene networks relevant to many biomedical, therapeutic and biotechnology applications.
ONLINE METHODS
Construction of combinatorial miRNA expression and sensor vectors
The vectors used in this study (Supplementary Table 13) were constructed using standard molecular cloning techniques, including PCR, restriction enzyme digestion, ligation, and Gibson assembly. Custom oligonucleotides and gene fragments were purchased from Integrated DNA Technologies and GenScript. The vector constructs were transformed into E. coli strain DH5α, and 50 μg/ml of carbenicillin (Teknova) was used to isolate colonies harboring the constructs. DNA was extracted and purified using Qiagen Plasmid Mini or Midi Kit (Qiagen). Sequences of the vector constructs were verified with Genewiz’s DNA sequencing service. The constructs for CombiGEM are widely available to the academic community through Addgene.
To create a lentiviral vector for expression of dual fluorescent protein reporters (pAWp7; pFUGW-UBCp-RFP-CMVp-GFP), turboRFP (Addgene #31779)20 and CMV promoter sequences were amplified by PCR using Phusion DNA polymerase (New England BioLabs) and cloned into the pAWp6 vector backbone (pFUGW-UBCp-GFP; a gift from L. Nissim in the T.K. Lu laboratory, MIT) using Gibson Assembly Master Mix (New England BioLabs). To express miRNAs, miRNA precursor sequences of miR-124 (Addgene #31779)20, miR-128 (a gift from M.F. Wilkinson, University of California San Diego, USA)56 and miR-132 (a gift from R.H. Goodman, Oregon Health and Science University, USA)57 were amplified by PCR and cloned downstream of the GFP sequence in pAWp7 vector using Gibson assembly. During PCR, four restriction digestion sites (BglII, BamHI, EcoRI and MfeI) were added to flank the miRNA precursor sequences, resulting in a BglII-BamHI-EcoRI-miRNA precursor-MfeI configuration that facilitated cloning of additional miRNA precursors for generating combinatorial miRNA expression cassettes. To construct two-wise miRNA precursor expression cassettes, the single miRNA precursor expression vectors were digested with BamHI and EcoRI (Thermo Scientific) and ligated using T4 DNA ligase (New England BioLabs) with the compatible sticky ends of the miRNA precursor inserts prepared from digestion of the respective PCR product with BglII and MfeI (Thermo Scientific). Likewise, three-wise miRNA precursor expression cassettes were built by ligating the BglII- and MfeI-digested two-wise miRNA precursor expression vectors with BamHI- and EcoRI-digested miRNA precursor inserts. To report on miRNA activities, we amplified miRNA sensors harboring four tandem repeats of the reverse-complemented sequences of the mature miRNAs by PCR from synthesized gene fragments, and inserted them by means of a SbfI cleavage site into the 3′ UTR of RFP of pAWp7 or the combinatorial miRNA precursor expression vectors using Gibson assembly.
Creation of the barcoded single miRNA precursor library
Each of the 39 miRNA precursor sequences (with lengths of ~261–641 base pairs) was amplified from human genomic DNA (Promega) as described previously8 by PCR using Phusion (New England BioLabs) or Kapa HiFi (Kapa Biosystems) DNA polymerases and primers listed in Supplementary Table 1. 8-base-pair bar-codes unique to each miRNA precursor were added during PCR. The barcode sequences differed from each other by at least two bases. In addition, restriction enzyme sites BglII and MfeI were added to flank the ends, and cleavage sites BamHI and EcoRI were introduced in between the miRNA precursor and the barcode sequences. Each PCR product herein was thus configured as BglII-miRNA precursor-BamHI-EcoRI-Barcode-MfeI. The PCR product of each barcoded miRNA precursor was then ligated into the pBT264 storage vector (Addgene #27428)58 using sites BglII and MfeI.
Pooled combinatorial miRNA library assembly for high-throughput screening
Storage vectors harboring the 39 barcoded miRNA precursors were mixed at equal molar ratios. Pooled inserts were generated by single-pot digestion of the pooled storage vectors with BglII and MfeI. The destination lentiviral vector (pAWp11; modified from the pAWp7 vector) was digested with BamHI and EcoRI. The digested inserts and vectors were ligated via their compatible sticky ends (i.e., BamHI + BglII & EcoRI + MfeI) to create a pooled single–miRNA precursor library in lentiviral vector. The single–miRNA precursor vector library was digested again with BamHI and EcoRI, and ligated with the same 39 miRNA precursor insert pool to assemble the two-wise miRNA precursor library (39 × 39 miRNAs = 1,521 total combinations). Ligation was performed with the BamHI- and EcoRI-digested two-wise miRNA precursor vector library and the same pooled inserts to generate the three-wise miRNA precursor library (39 × 39 × 39 miRNAs = 59,319 total combinations). After each pooled assembly step, the miRNA precursors were localized to one end of the vector construct and their respective barcodes were concatenated at the other end.
Generation of combinatorial miRNA vectors for individual validation assays
Lentiviral vectors harboring single, two-wise or three-wise miRNA precursors were constructed with the same strategy as used for the generation of combinatorial miRNA libraries described above, except that the assembly was performed with individual inserts and vectors, instead of pooled ones.
Human cell culture
HEK293T and MCF7 cells were obtained from American Type Culture Collection (ATCC). T1074 cells were obtained from Applied Biological Materials. HOSE 11-12 and HOSE 17-1 cells were gifts from G.S.W. Tsao (University of Hong Kong, Hong Kong). OVCAR8 and OVCAR8-ADR cells were gifts from S.N. Bhatia (Massachusetts Institute of Technology, USA)59 and T. Ochiya (Japanese National Cancer Center Research Institute, Japan)22, respectively. The identity of the OVCAR8-ADR cells was confirmed by a cell line authentication test (Genetica DNA Laboratories). HEK293T cells were cultured in DMEM supplemented with 10% heat-inactivated FBS and 1× antibiotic-antimycotic (Life Technologies) at 37 °C with 5% CO2. MCF7, T1074, HOSE 11-12, HOSE 17-1, OVCAR8 and OVCAR8-ADR cells were cultured in RPMI supplemented with 10% heat-inactivated FBS and 1× antibiotic-antimycotic (Life Technologies) at 37 °C with 5% CO2. For drug sensitivity assays, docetaxel (LC Laboratories) or vehicle control was added to the cell cultures at the indicated doses and time periods.
Lentivirus production and transduction
Lentiviruses were produced in 6-well plates with 250,000 HEK293T cells per well. Cells were transfected using FuGENE HD transfection reagents (Promega) with 0.5 μg of lentiviral vector, 1 μg of pCMV-dR8.2-dvpr vector, and 0.5 μg of pCMV-VSV-G vector mixed in 100 μl of OptiMEM medium (Life Technologies) for 10 min. The medium was replaced with fresh culture medium 1 day after transfection. Viral supernatants were then collected every 24 h between 48 to 96 h after transfection, pooled together and filtered through a 0.45 μm polyethersulfone membrane (Pall). For transduction with individual vector constructs, 500 μl filtered viral supernatant was used to infect 250,000 cells in the presence of 8 μg/ml polybrene (Sigma) overnight. For transduction with pooled libraries, lentivirus production was scaled up using the same experimental conditions. Filtered viral supernatant was concentrated at 50-fold using an Amicon Ultra Centrifugal Filter Unit (Millipore) and used to infect a starting cell population containing ~300-fold more cells than the library size to be tested. MOIs of 0.3 to 0.5 were used to give an infection efficiency of ~30–40% in the presence of 8 μg/ml polybrene. Cells were washed with fresh culture medium 1 day after infection, and cultured for 3 more days before experiments.
Sample preparation for barcode sequencing
For the combinatorial miRNA vector libraries, plasmid DNA was extracted from E. coli transformed with the vector library using the Qiagen Plasmid Mini kit (Qiagen). For the human cell pools infected with the combinatorial miRNA libraries, genomic DNA of cells collected from various experimental conditions was extracted using DNeasy Blood & Tissue Kit (Qiagen). DNA concentrations were measured by Quant-iT PicoGreen dsDNA Assay Kit (Life Technologies).
PCR amplification of a 359-base-pair fragment containing unique CombiGEM barcodes representing each combination within the pooled vector and infected cell libraries was performed using Kapa HiFi Hotstart Ready-mix (Kapa Biosystems). During PCR, each sample had Illumina anchor sequences and an 8-base-pair indexing barcode for multiplexed sequencing added. The forward and reverse primers used were 5′-AATGATACGGCGACCAC CGAGATCTACACGGATCCGCAACGGAATTC-3′ and 5′-CAAGCAGAAGACGGCATACGAGATNNNNNNNNGGTTGCGTCAGCAAACACAG-3′ where NNNNNNNN denotes a specific indexing barcode assigned for each experimental sample.
0.5 ng of plasmid DNA was added as template in a 12.5 μl PCR reaction, whereas 800 ng of genomic DNA was used per 50-μl PCR reaction. Eight and 80 PCR reactions were performed for human cell pools infected with two-wise and three-wise miRNA library, respectively, to reach at least 50-fold representation for each combination. To avoid bias in PCR that could skew the population distribution, we optimized PCR conditions to ensure the amplification occurred during the exponential phase. PCR products were run on a 1.5% agarose gel, and the 359-base-pair fragment was isolated using QIAquick Gel Extraction Kit (Qiagen). Concentrations of the PCR products were determined by quantitative PCR using Kapa SYBR Fast qPCR Master Mix (Kapa Biosystems) with a Mastercycler Ep Realplex machine (Eppendorf). Forward and reverse primers used for quantitative PCR were 5′-AATGATACGGCGACCACCGA-3 ′and 5′ -CAAGCAGAAGACGGCATACGA-3′ respectively. The quantified PCR products were then pooled at desired ratio for multiplexing samples and run for Illumina HiSeq using CombiGEM barcode primer (5′ -CCACCGAG ATCTACACGGATCCGCAACGGAATTC-3′) and indexing barcode primer (5′-GTGGCGTGGTGTGCACTGTGTTTGCTGACGCAACC-3′).
Data analysis
Barcode reads for each miRNA combination were processed from sequencing data. CombiGEM barcode reads representing each combination were normalized per million reads for each sample categorized by the indexing barcodes. Screens were performed in two biological replicates with independent infections of the same lentiviral libraries. As measures of drug sensitivity and cell proliferation, barcode count ratios of normalized CombiGEM barcode reads comparing the experimental group against the paired control group for each replicate that originated from the same infected cell pool were calculated as fold changes. For each replicate, the fold changes of the different possible orders of each same miRNA combination were averaged, and high consistency in the fold-changes was observed (i.e., coefficient of variation (CV) < 0.2) for 92–98% of the combinations (Supplementary Fig. 5). The calculated ratio was log transformed. The mean log2 ratio determined from the two replicates was used as a measure of drug sensitivity or cell proliferation. Only barcodes that gave more than ~100 absolute reads in both control groups from the two replicates were analyzed to improve data reliability.
Combinations were ranked by the mean log2 ratio across all experimental conditions. The frequency distributions of log2 ratios for the pooled screens are shown in Supplementary Figure 17. We defined the top screen hits based on two criteria: (i) with >25% more or fewer barcode counts in the experimental versus control group (i.e., log2 ratios that were greater than 0.32 or less than −0.42), and (ii) recovered at a low false-discovery rate (FDR). We calculated the P-value for the log2 ratio of each combination by comparing its log2 ratios with those of the entire population obtained from the two replicates of screening data using the Student’s t-test (two-sample, two-tailed; MATLAB function ‘ttest2’). To correct for multiple hypothesis testing, we used a previously developed FDR method33. Specifically, we calculated the adjusted P values (i.e., Q values) based on the distribution of P-values (MATLAB function ‘mafdr’). A log2 ratio was considered statistically significant relative to the overall population based on a specific Q-value cutoff. The cutoff was set such that the number of false positives expected among the significant log2 ratios is <1. The sets of top screen hits are listed in Supplementary Tables 5–9. In this comparison, we used the entire population as the reference to isolate hits with strong modifying effects, based on the assumption that most combinations do not confer large changes in the phenotypes. Control vectors can be included during library creation in future screens to provide an alternative reference for comparison. To enhance visualization in the two-dimensional heatmap and three-dimensional plots, hierarchical clustering was performed to group combinations that shared similar log2 ratio profiles based on Euclidean distance.
To determine miRNA interactions, we applied a scoring system similar to one previously described for measuring genetic interactions16, and calculated genetic interaction (GI) scores for each two- and three-wise combination. Combinations were grouped based on their GI scores to evaluate the frequency of genetic interactions as shown in the histograms in Figure 5d–f. In general terms, combinations that exhibited stronger phenotypes than predicted by the additive effect of individual phenotypes were defined as synergistic, whereas combinations with weaker than expected phenotypes based on an additive model were defined as buffering. The definition and representation of genetic interactions are complex60. Sign epistasis is more difficult to present using existing scoring methods31. For simplicity in visualizing genetic interactions, detailed definitions are illustrated below and in Supplementary Figure 9.
As described above, positive and negative phenotypes had averaged fold changes of normalized barcode reads of >1 and <1 respectively, whereas no phenotypic change resulted in a fold change = 1. For miRNA [A] and [B] with individual phenotypes “A” and “B,” the expected phenotype for the two-wise combination [A,B] is (“A” + “B” − 1), according to the additive model, where “A” and “B” are calculated based on the median fold changes of normalized barcode reads determined for combinations [A,X] and [B,X], respectively, and [X] represents all 39 library members. Similarly, the expected phenotype for three-wise combination [A,B,C] is (“A,B” + “C” − 1), where “A,B” and “C” are the median fold changes of normalized barcode reads determined for combinations [A,B,X] and [C,X,X], respectively, and [X] represents all 39 library members.
The GI score of a given two-wise combination was determined as follows (Supplementary Fig. 9):
Definition of deviation = observed phenotype − expected phenotype,
If phenotype “A” and “B” are both > 1 and deviation > 0, the interaction is defined as synergistic. GI score = | deviation |
If phenotype “A” and “B” are both > 1 and deviation < 0, the interaction is defined as buffering. GI score = − | deviation |
If phenotype “A” and “B” are both < 1 and deviation > 0, the interaction is defined as buffering. GI score = − | deviation |
If phenotype “A” and “B” are both < 1 and deviation < 0, the interaction is defined as synergistic. GI score = | deviation |
If phenotype “A” > 1 and “B” < 1, or vice versa, and observed phenotype > both “A” and “B,” the interaction is defined as synergistic. GI score = | deviation |
If phenotype “A” > 1 and “B” < 1, or vice versa, and observed phenotype < both “A” and “B,” the interaction is defined as synergistic. GI score = | deviation |
If phenotype “A” > 1 and “B” < 1, or vice versa, and observed phenotype is neither > both “A” and “B” nor < both “A” and “B,” the interaction is defined as buffering. GI score = − | deviation |
The GI score for a given three-wise combination was calculated using the same method. For each three-wise combination, three GI scores were determined for the three possible permutations (i.e., “A,B” + “C,” “A,C” + “B,” “B,C” + “A”). The GI score for “B,A” + “C” was the same as for “A,B” + “C” because the fold changes for different orders of the same pair of miRNAs were averaged, as described above.
To determine the statistical significance of GI scores, the P-value for the GI score of each combination was calculated by comparing its deviation (i.e., observed phenotype − expected phenotype) with the deviations of all combinations in the library obtained from the two replicates of screening data using the Student’s t-test (two-sample, two-tailed; MATLAB function ‘ttest2’). To correct for multiple hypothesis testing, the Q values were computed based on the distribution of P-values (MATLAB function ‘mafdr’)33. We considered a GI score as statistically significant compared with the entire population based on a specific Q-value cutoff. The cutoff was defined such that the number of false positives expected among the significant GI scores is ~1 or less. Two-wise and three-wise miRNA combinations with GI scores below the Q-value cutoffs (i.e., <0.03 and <0.002, respectively) are listed in Supplementary Tables 10–12. To generate the GI heatmaps in Figure 5a and Supplementary Figure 11b–d, the calculated GI scores for two- and three-wise combinations were displayed in the same order as for the two-dimensional heatmap for easy comparison.
We also formulated GIs for each two- and three-wise combination based on the expected phenotype produced by the multiplicative model1,16, and similar GIs were observed as with the additive model (data not shown). Other models such as the log-multiplicative model61 for studying epistasis can be applied to evaluate the genetic interactions between miRNAs. For further analysis, our data are available upon request. In future work, it could be beneficial to include a single–miRNA precursor library in the pooled screens to enable comparisons of genetic combinations with their single-gene constituents and to increase the representation of each genetic combination to minimize potential errors due to limited sample sizes.
Flow cytometry
Four days post-infection, cells were washed and resuspended with 1× PBS supplemented with 2% heat-inactivated FBS, and assayed with a LSRII Fortessa flow cytometer (Becton Dickinson). Cells were gated on forward and side scatter. At least 20,000 cells were recorded per sample in each data set.
Fluorescence microscopy
To visualize GFP and RFP, cells were directly observed under an inverted fluorescence microscope (Zeiss) after 4 days post-infection.
Cell viability assays
For the MTT assay, 100 μl of MTT (3-(4,5-dimethylthiazol-2-yl)-2,5-diphenyltetrazolium bromide) solution (Sigma) was added to the cell cultures in 96-well plates and incubated at 37 °C with 5% CO2 for 2 h. Viable cells transform the soluble MTT salt to insoluble blue formazan crystals. Formazan crystals formed were dissolved with 100 μl of solubilization buffer at 37 °C. The absorbance of the solubilized formazan was measured at an optical density (OD) of 570 nm (along with the reference OD at 650 nm) using a Synergy H1 Microplate Reader (BioTek). For the trypan blue exclusion assay, cells were trypsinized and stained with 0.4% trypan blue dye solution (Sigma). Viable cells were counted in four different fields of a hemocytometer under microscopy.
Colony formation assay
10,000 cells were plated in 96-well plates and treated with 25 nM of docetaxel. Cells were trypsinized and transferred to 6-well plates. After 11 days, cells were fixed in ice-cold 100% methanol for 10 min, and stained with crystal violet solution for 20 min. The colony area percentage and number of colonies in each sample were determined using ImageJ software.
RNA extraction and quantitative RT-PCR (qRT-PCR)
RNA was extracted from cells using TRIzol Plus RNA Purification Kit (Invitrogen) and treated with DNase using PureLink DNase Set (Invitrogen), according to the manufacturer’s protocols and quantified using a Nanodrop Spectrophotometer. RNA samples were reverse-transcribed using GoScript Reverse Transcriptase (Promega), Random Primer Mix (New England BioLabs) and RNase OUT (Invitrogen). qRT-PCR was performed on the LightCycler480 system (Roche) using SYBR FAST qPCR Master Mix (KAPA). LightCycler 480 SW 1.1 was used for TM curves evaluation and quantification. PCR primers are listed in Supplementary Table 14.
Supplementary Material
Acknowledgments
We thank members of the Lu laboratory and H. Ding for helpful discussions. We thank S. Patnaik of the Roswell Park Cancer Institute for processing miRNA expression data from the ArrayExpress database of European Bioinformatics Institute, the Massachusetts Institute of Technology BioMicroCenter for technical support on Illumina HiSeq, J. Weis for assisting computational analysis of next-generation sequencing data and C. Cui for technical assistance on cell viability assays. This work was supported by the US National Institutes of Health (DP2 OD008435 and P50 GM098792), the Office of Naval Research (N00014-13-1-0424), the Ellison Foundation New Scholar in Aging Award, the Defense Advanced Research Projects Agency and the Defense Threat Reduction Agency (HDTRA1-15-1-0050). A.S.L.W. was supported by the Croucher Foundation. The pAWp6 vector backbone (pFUGW-UBCp-GFP) was a gift from L. Nissim of the T.K. Lu laboratory, MIT; miR-128 was a gift from M.F. Wilkinson, University of California San Diego, USA and miR-132 was a gift from R.H. Goodman, Oregon Health and Science University, USA; HOSE 11-12 and HOSE 17-1 cells were gifts from G.S.W. Tsao, University of Hong Kong, Hong Kong; OVCAR8 and OVCAR8-ADR cells were gifts from S.N. Bhatia, MIT, and T. Ochiya, Japanese National Cancer Center Research Institute, Japan, respectively.
Footnotes
AUTHOR CONTRIBUTIONS
A.S.L.W., G.C.G.C., A.A.C. and T.K.L. conceived the work. A.S.L.W. and G.C.G.C. performed experiments. A.S.L.W., G.C.G.C., A.A.C. and O.P. performed computational analyses on next-generation sequencing data. A.S.L.W., G.C.G.C. and T.K.L. designed the experiments, interpreted and analyzed the data. A.S.L.W. and T.K.L. wrote the paper.
COMPETING FINANCIAL INTERESTS
The authors declare competing financial interests: details are available in the online version of the paper.
Note: Any Supplementary Information and Source Data files are available in the online version of the paper.
References
- 1.Dixon SJ, Costanzo M, Baryshnikova A, Andrews B, Boone C. Systematic mapping of genetic interaction networks. Annu Rev Genet. 2009;43:601–625. doi: 10.1146/annurev.genet.39.073003.114751. [DOI] [PubMed] [Google Scholar]
- 2.Vierbuchen T, Wernig M. Molecular roadblocks for cellular reprogramming. Mol Cell. 2012;47:827–838. doi: 10.1016/j.molcel.2012.09.008. [DOI] [PMC free article] [PubMed] [Google Scholar]
- 3.Al-Lazikani B, Banerji U, Workman P. Combinatorial drug therapy for cancer in the post-genomic era. Nat Biotechnol. 2012;30:679–692. doi: 10.1038/nbt.2284. [DOI] [PubMed] [Google Scholar]
- 4.Zuk O, Hechter E, Sunyaev SR, Lander ES. The mystery of missing heritability: Genetic interactions create phantom heritability. Proc Natl Acad Sci USA. 2012;109:1193–1198. doi: 10.1073/pnas.1119675109. [DOI] [PMC free article] [PubMed] [Google Scholar]
- 5.Eichler EE, et al. Missing heritability and strategies for finding the underlying causes of complex disease. Nat Rev Genet. 2010;11:446–450. doi: 10.1038/nrg2809. [DOI] [PMC free article] [PubMed] [Google Scholar]
- 6.Manolio TA, et al. Finding the missing heritability of complex diseases. Nature. 2009;461:747–753. doi: 10.1038/nature08494. [DOI] [PMC free article] [PubMed] [Google Scholar]
- 7.Johannessen CM, et al. A melanocyte lineage program confers resistance to MAP kinase pathway inhibition. Nature. 2013;504:138–142. doi: 10.1038/nature12688. [DOI] [PMC free article] [PubMed] [Google Scholar]
- 8.Voorhoeve PM, et al. A genetic screen implicates miRNA-372 and miRNA-373 as oncogenes in testicular germ cell tumors. Cell. 2006;124:1169–1181. doi: 10.1016/j.cell.2006.02.037. [DOI] [PubMed] [Google Scholar]
- 9.Moffat J, Sabatini DM. Building mammalian signaling pathways with RNAi screens. Nat Rev Mol Cell Biol. 2006;7:177–187. doi: 10.1038/nrm1860. [DOI] [PubMed] [Google Scholar]
- 10.Zhou Y, et al. High-throughput screening of a CRISPR/Cas9 library for functional genomics in human cells. Nature. 2014;509:487–491. doi: 10.1038/nature13166. [DOI] [PubMed] [Google Scholar]
- 11.Koike-Yusa H, Li Y, Tan EP, Velasco-Herrera MDC, Yusa K. Genome-wide recessive genetic screening in mammalian cells with a lentiviral CRISPR-guide RNA library. Nat Biotechnol. 2014;32:267–273. doi: 10.1038/nbt.2800. [DOI] [PubMed] [Google Scholar]
- 12.Shalem O, et al. Genome-scale CRISPR-Cas9 knockout screening in human cells. Science. 2014;343:84–87. doi: 10.1126/science.1247005. [DOI] [PMC free article] [PubMed] [Google Scholar]
- 13.Wang T, Wei JJ, Sabatini DM, Lander ES. Genetic screens in human cells using the CRISPR-Cas9 system. Science. 2014;343:80–84. doi: 10.1126/science.1246981. [DOI] [PMC free article] [PubMed] [Google Scholar]
- 14.Metzker ML. Sequencing technologies - the next generation. Nat Rev Genet. 2010;11:31–46. doi: 10.1038/nrg2626. [DOI] [PubMed] [Google Scholar]
- 15.Yu H, et al. Next-generation sequencing to generate interactome datasets. Nat Methods. 2011;8:478–480. doi: 10.1038/nmeth.1597. [DOI] [PMC free article] [PubMed] [Google Scholar]
- 16.Bassik MC, et al. A systematic mammalian genetic interaction map reveals pathways underlying ricin susceptibility. Cell. 2013;152:909–922. doi: 10.1016/j.cell.2013.01.030. [DOI] [PMC free article] [PubMed] [Google Scholar]
- 17.Engler C, Kandzia R, Marillonnet S. A one pot, one step, precision cloning method with high throughput capability. PLoS ONE. 2008;3:e3647. doi: 10.1371/journal.pone.0003647. [DOI] [PMC free article] [PubMed] [Google Scholar]
- 18.Gibson DG, et al. Enzymatic assembly of DNA molecules up to several hundred kilobases. Nat Methods. 2009;6:343–345. doi: 10.1038/nmeth.1318. [DOI] [PubMed] [Google Scholar]
- 19.Zelcbuch L, et al. Spanning high-dimensional expression space using ribosome-binding site combinatorics. Nucleic Acids Res. 2013;41:e98. doi: 10.1093/nar/gkt151. [DOI] [PMC free article] [PubMed] [Google Scholar]
- 20.Yoo AS, et al. MicroRNA-mediated conversion of human fibroblasts to neurons. Nature. 2011;476:228–231. doi: 10.1038/nature10323. [DOI] [PMC free article] [PubMed] [Google Scholar]
- 21.Brown BD, Naldini L. Exploiting and antagonizing microRNA regulation for therapeutic and experimental applications. Nat Rev Genet. 2009;10:578–585. doi: 10.1038/nrg2628. [DOI] [PubMed] [Google Scholar]
- 22.Honma K, et al. RPN2 gene confers docetaxel resistance in breast cancer. Nat Med. 2008;14:939–948. doi: 10.1038/nm.1858. [DOI] [PubMed] [Google Scholar]
- 23.Creighton CJ, et al. Proteomic and transcriptomic profiling reveals a link between the PI3K pathway and lower estrogen-receptor (ER) levels and activity in ER+ breast cancer. Breast Cancer Res. 2010;12:R40. doi: 10.1186/bcr2594. [DOI] [PMC free article] [PubMed] [Google Scholar]
- 24.Blower PE, et al. MicroRNA expression profiles for the NCI-60 cancer cell panel. Mol Cancer Ther. 2007;6:1483–1491. doi: 10.1158/1535-7163.MCT-07-0009. [DOI] [PubMed] [Google Scholar]
- 25.Patnaik SK, et al. Expression of microRNAs in the NCI-60 cancer cell-lines. PLoS ONE. 2012;7:e49918. doi: 10.1371/journal.pone.0049918. [DOI] [PMC free article] [PubMed] [Google Scholar]
- 26.Gholami AM, et al. Global proteome analysis of the NCI-60 cell line panel. Cell Reports. 2013;4:609–620. doi: 10.1016/j.celrep.2013.07.018. [DOI] [PubMed] [Google Scholar]
- 27.Hsu S-D, et al. MiRTarBase update 2014: an information resource for experimentally validated miRNA-target interactions. Nucleic Acids Res. 2014;42:D78–D85. doi: 10.1093/nar/gkt1266. [DOI] [PMC free article] [PubMed] [Google Scholar]
- 28.Strezoska Ž, et al. Optimized PCR conditions and increased shRNA fold representation improve reproducibility of pooled shRNA screens. PLoS ONE. 2012;7:e42341. doi: 10.1371/journal.pone.0042341. [DOI] [PMC free article] [PubMed] [Google Scholar]
- 29.Bhattacharya R, et al. MiR-15a and MiR-16 control Bmi-1 expression in ovarian cancer. Cancer Res. 2009;69:9090–9095. doi: 10.1158/0008-5472.CAN-09-2552. [DOI] [PMC free article] [PubMed] [Google Scholar]
- 30.Cheng AA, Ding H, Lu TK. Enhanced killing of antibiotic-resistant bacteria enabled by massively parallel combinatorial genetics. Proc Natl Acad Sci USA. 2014;111:12462–12467. doi: 10.1073/pnas.1400093111. [DOI] [PMC free article] [PubMed] [Google Scholar]
- 31.Kampmann M, Bassik MC, Weissman JS. Integrated platform for genome-wide screening and construction of high-density genetic interaction maps in mammalian cells. Proc Natl Acad Sci USA. 2013;110:E2317–E2326. doi: 10.1073/pnas.1307002110. [DOI] [PMC free article] [PubMed] [Google Scholar]
- 32.Pierce SE, Davis RW, Nislow C, Giaever G. Genome-wide analysis of barcoded Saccharomyces cerevisiae gene-deletion mutants in pooled cultures. Nat Protoc. 2007;2:2958–2974. doi: 10.1038/nprot.2007.427. [DOI] [PubMed] [Google Scholar]
- 33.Storey JD, Tibshirani R. Statistical significance for genomewide studies. Proc Natl Acad Sci USA. 2003;100:9440–9445. doi: 10.1073/pnas.1530509100. [DOI] [PMC free article] [PubMed] [Google Scholar]
- 34.Xia L, et al. miR-15b and miR-16 modulate multidrug resistance by targeting BCL2 in human gastric cancer cells. Int J Cancer. 2008;123:372–379. doi: 10.1002/ijc.23501. [DOI] [PubMed] [Google Scholar]
- 35.Kastl L, Brown I, Schofield AC. MiRNA-34a is associated with docetaxel resistance in human breast cancer cells. Breast Cancer Res Treat. 2012;131:445–454. doi: 10.1007/s10549-011-1424-3. [DOI] [PubMed] [Google Scholar]
- 36.Krek A, et al. Combinatorial microRNA target predictions. Nat Genet. 2005;37:495–500. doi: 10.1038/ng1536. [DOI] [PubMed] [Google Scholar]
- 37.Jacobsen A, et al. Analysis of microRNA-target interactions across diverse cancer types. Nat Struct Mol Biol. 2013;20:1325–1332. doi: 10.1038/nsmb.2678. [DOI] [PMC free article] [PubMed] [Google Scholar]
- 38.Lewis BP, Burge CB, Bartel DP. Conserved seed pairing, often flanked by adenosines, indicates that thousands of human genes are microRNA targets. Cell. 2005;120:15–20. doi: 10.1016/j.cell.2004.12.035. [DOI] [PubMed] [Google Scholar]
- 39.Guillamot M, et al. Cdc14b regulates mammalian RNA polymerase II and represses cell cycle transcription. Sci Rep. 2011;1:189. doi: 10.1038/srep00189. [DOI] [PMC free article] [PubMed] [Google Scholar]
- 40.Huntzinger E, Izaurralde E. Gene silencing by microRNAs: contributions of translational repression and mRNA decay. Nat Rev Genet. 2011;12:99–110. doi: 10.1038/nrg2936. [DOI] [PubMed] [Google Scholar]
- 41.McLornan DP, List A, Mufti GJ. Applying synthetic lethality for the selective targeting of cancer. N Engl J Med. 2014;371:1725–1735. doi: 10.1056/NEJMra1407390. [DOI] [PubMed] [Google Scholar]
- 42.The Cancer Genome Atlas Research Network. The Cancer Genome Atlas Pan-Cancer analysis project. Nat Genet. 2013;45:1113–1120. doi: 10.1038/ng.2764. [DOI] [PMC free article] [PubMed] [Google Scholar]
- 43.Andersson R, et al. An atlas of active enhancers across human cell types and tissues. Nature. 2014;507:455–461. doi: 10.1038/nature12787. [DOI] [PMC free article] [PubMed] [Google Scholar]
- 44.FANTOM Consortium and the RIKEN PMI and CLST (DGT) A promoter-level mammalian expression atlas. Nature. 2014;507:462–470. doi: 10.1038/nature13182. [DOI] [PMC free article] [PubMed] [Google Scholar]
- 45.Gandhi S, Wood NW. Genome-wide association studies: the key to unlocking neurodegeneration? Nat Neurosci. 2010;13:789–794. doi: 10.1038/nn.2584. [DOI] [PubMed] [Google Scholar]
- 46.Peden JF, Farrall M. Thirty-five common variants for coronary artery disease: the fruits of much collaborative labour. Hum Mol Genet. 2011;20:R198–R205. doi: 10.1093/hmg/ddr384. [DOI] [PMC free article] [PubMed] [Google Scholar]
- 47.Gobeil S, Zhu X, Doillon CJ, Green MR. A genome-wide shRNA screen identifies GAS1 as a novel melanoma metastasis suppressor gene. Genes Dev. 2008;22:2932–2940. doi: 10.1101/gad.1714608. [DOI] [PMC free article] [PubMed] [Google Scholar]
- 48.Park J, et al. RAS–MAPK–MSK1 pathway modulates ataxin 1 protein levels and toxicity in SCA1. Nature. 2013;498:325–331. doi: 10.1038/nature12204. [DOI] [PMC free article] [PubMed] [Google Scholar]
- 49.Chia N-Y, et al. A genome-wide RNAi screen reveals determinants of human embryonic stem cell identity. Nature. 2010;468:316–320. doi: 10.1038/nature09531. [DOI] [PubMed] [Google Scholar]
- 50.Ebert MS, Neilson JR, Sharp PA. MicroRNA sponges: competitive inhibitors of small RNAs in mammalian cells. Nat Methods. 2007;4:721–726. doi: 10.1038/nmeth1079. [DOI] [PMC free article] [PubMed] [Google Scholar]
- 51.Guttman M, et al. lincRNAs act in the circuitry controlling pluripotency and differentiation. Nature. 2011;477:295–300. doi: 10.1038/nature10398. [DOI] [PMC free article] [PubMed] [Google Scholar]
- 52.Gilbert LA, et al. Genome-scale CRISPR-mediated control of gene repression and activation. Cell. 2014;159:647–661. doi: 10.1016/j.cell.2014.09.029. [DOI] [PMC free article] [PubMed] [Google Scholar]
- 53.Hsu PD, Lander ES, Zhang F. Development and applications of CRISPR-Cas9 for genome engineering. Cell. 2014;157:1262–1278. doi: 10.1016/j.cell.2014.05.010. [DOI] [PMC free article] [PubMed] [Google Scholar]
- 54.Gaj T, Gersbach CA, Barbas CF. ZFN, TALEN, and CRISPR/Cas-based methods for genome engineering. Trends Biotechnol. 2013;31:397–405. doi: 10.1016/j.tibtech.2013.04.004. [DOI] [PMC free article] [PubMed] [Google Scholar]
- 55.Zhu F, et al. DICE, an efficient system for iterative genomic editing in human pluripotent stem cells. Nucleic Acids Res. 2014;42:e34. doi: 10.1093/nar/gkt1290. [DOI] [PMC free article] [PubMed] [Google Scholar]
- 56.Bruno IG, et al. Identification of a microRNA that activates gene expression by repressing nonsense-mediated RNA decay. Mol Cell. 2011;42:500–510. doi: 10.1016/j.molcel.2011.04.018. [DOI] [PMC free article] [PubMed] [Google Scholar]
- 57.Klein ME, et al. Homeostatic regulation of MeCP2 expression by a CREB-induced microRNA. Nat Neurosci. 2007;10:1513–1514. doi: 10.1038/nn2010. [DOI] [PubMed] [Google Scholar]
- 58.Miyamichi K, et al. Cortical representations of olfactory input by trans-synaptic tracing. Nature. 2011;472:191–196. doi: 10.1038/nature09714. [DOI] [PMC free article] [PubMed] [Google Scholar]
- 59.Ren Y, et al. Targeted tumor-penetrating siRNA nanocomplexes for credentialing the ovarian cancer oncogene ID4. Sci Transl Med. 2012;4:147ra112. doi: 10.1126/scitranslmed.3003778. [DOI] [PMC free article] [PubMed] [Google Scholar]
- 60.Drees BL, et al. Derivation of genetic interaction networks from quantitative phenotype data. Genome Biol. 2005;6:R38. doi: 10.1186/gb-2005-6-4-r38. [DOI] [PMC free article] [PubMed] [Google Scholar]
- 61.Tong AHY, et al. Global mapping of the yeast genetic interaction network. Science. 2004;303:808–813. doi: 10.1126/science.1091317. [DOI] [PubMed] [Google Scholar]
Associated Data
This section collects any data citations, data availability statements, or supplementary materials included in this article.