

Abstract
Conventional histologic methods provide valuable information regarding the physical nature of damage in fatigue-loaded tendons, limited to thin, two-dimensional sections. We introduce an imaging method that characterizes tendon microstructure three-dimensionally and develop quantitative, spatial measures of damage formation within tendons. Rat patellar tendons were fatigue loaded in vivo to low, moderate, and high damage levels. Tendon microstructure was characterized using multiphoton microscopy by capturing second harmonic generation signals. Image stacks were analyzed using Fourier transform-derived computations to assess frequency-based properties of damage. Results showed 3D microstructure with progressively increased density and variety of damage patterns, characterized by kinked deformations at low, fiber dissociation at moderate, and fiber thinning and out-of-plane discontinuities at high damage levels. Image analysis generated radial distributions of power spectral gradients, establishing a “fingerprint” of tendon damage. Additionally, matrix damage was mapped using local, discretized orientation vectors. The frequency distribution of vector angles, a measure of damage content, differed from one damage level to the next. This study established an objective 3D imaging and analysis method for tendon microstructure, which characterizes directionality and anisotropy of the tendon microstructure and quantitative measures of damage that will advance investigations of the microstructural basis of degradation that precedes overuse injuries.
Keywords: Tendon, Collagen, Damage, Microstructure, Second harmonic generation, Fourier transform
INTRODUCTION
The ability of tendons to transfer loads from muscle contractions to drive joint movement and maintain joint stability is largely attributed to the presence of fibrous collagen and its microstructural organization. Collagen organization follows a hierarchical formation, with the smallest unit, tropocollagen, aggregated into subfibrils, fibrils, fibers, and then fascicles assembled longitudinally along the length of the tendon.7,32 Exposure to aggressive and/or repetitive movements, as seen in occupational and athletic activities, makes the tendon susceptible to cumulative damage and consequently mechanical degradation of the matrix. Both clinical histopathological studies24,31 and experimental models1,6,19,28,33 of tendon pathology have commonly reported evidence of fiber disorganization and angulation, and presence of microtears and fiber delaminations in the matrix of overused and overloaded tendons. Given that collagen microstructure is a primary determinant of tendon strength and mechanical behavior, measurements of microstructural anisotropy have been previously examined as indicators of the quality and structural integrity of tendon and various tissues.2,9,21,22,29,36,40,41
Previous studies on evaluating collagenous microstructure primarily employed conventional histologic techniques, such as bright-field, polarized light, scanning electron and confocal microscopy. These techniques provide valuable information regarding tendon microstructure, but routine analyses are limited to planar representations of the tissue from thin sectioning, making it difficult to fully assess matrix level damage in three dimensions and introducing the danger of misinterpreting sectioning artifact as damage. Developing a standardized method to quantify and objectively interpret tendon damage will advance our understanding of the relationship between fatigue-induced damage and the degradation of mechanical properties that contributes to tendon rupture.
Recent advances in imaging and analysis techniques allow us to explore novel approaches to further advance the current methodology in studying tendon microstructure. In particular, multiphoton microscopy has demonstrated its ability to penetrate into tissue to probe for various constituents of connective tissues. 11,17,20 Specifically, for the application of studying collagenous microstructure, second harmonic generation (SHG) signals, an inherent, second-order optical property of fibrous collagen, can be invoked using a laser tuned to the near-infrared range, providing submicron imaging of tissue microstructure within thick tissue sections, thus allowing visualization of tendon without mechanical sectioning artifact.11,15–17,20,42 Independently, in histomorphometric studies of fibrous networks, methods based on the Fourier transform have been implemented to delineate textural changes and disruption in directional anisotropy of fiber/tissue organization that characterize pathologies of various tissues.21,23,41 Using these methods, complex spatial features are quantitatively characterized by their frequency analogs, thereby identifying mathematical correlates of pathologic changes in tissue morphology.
The purpose of the current study was to develop an imaging and analysis approach based on SHG imaging and Fourier transform-derived computations that allows for three-dimensional visualization and characterization of tendon damage. Further, because methods are sensitive to changes in matrix architecture, we hypothesize that our developed imaging and analysis approach could be used to quantify different levels of fatigue damage in tendons. We used a previously established in vivo rat model of tendon fatigue18,34 to induce repeatable levels of cumulative damage in the tendon. These methods may provide a way to quantify matrix changes that occur in the process of damage accumulation associated with the progression of mechanical degradation and tissue degeneration, advancing our understanding of the biological mechanisms associated with tendon injury.
METHODS
In Vivo Tendon Fatigue Loading
Adult female Sprague–Dawley rats (N = 21; 320 ± 15 g) (Charles River Laboratories, Ltd., Wilmington, MA, USA) were used in the current study. Surgery, instrumentation, and loading were conducted under aseptic conditions and continuous administration of gas (isoflurane) anesthesia (2–3% by volume, flow rate 0.4 L/min). All procedures were approved by the Institutional Animal Care and Use Committee.
We used an in vivo tendon fatigue loading model developed in our laboratory to induce progressive levels of fatigue damage in the patellar tendon.18,34 Briefly, rats were anesthetized and placed in a supine position with the knee flexed at 30° on the stage of a servo-hydraulic mini-testing system (Instron 8841, Canton, MA, USA). The patella was exposed by a 10 mm cutaneous incision and a custom-made clamp, which was connected in series with a 50-lb load cell and the actuator, gripped the patella without making any contact with the tendon. A specialized tibial clamp was used to provide fixation of the tibia to the base of the testing system. Tendons were preloaded at 3 N to establish the initial length, L0, and initial actuator position, d0, preconditioned and then loaded cyclically at 1 to 35 N (40 ± 7% of the monotonic failure strength,18 within physiologic load range) using a load-control loading algorithm with a haversine waveform. Force and cyclic displacement were continuously monitored during loading. Tendons were loaded until reaching one of three endpoints, defined at peak grip-to-grip tendon strain of 0.6% (low level damage; n = 8), 1.7% (moderate level damage; n = 3), and 3.5% (high level damage; n = 2) increase beyond baseline measurement.34 The endpoints were determined based on previous studies of in vivo tendon fatigue behavior conducted in our laboratory, which demonstrated that the tendon fatigue life is triphasic in nature and that key stages of the progression of fatigue damage are marked by these peak grip-to-grip strain levels.18 Peak grip-to-grip strain was computed as (d′ − d0)/L0, where d′ is the actuator position at peak cyclic load. Nonloaded tendons in additional animals (n = 8) were used as controls.
Microstructural Studies/Second Harmonic Generation Imaging
Animals were euthanized using carbon dioxide at the completion of the fatigue loading upon reaching the desired fatigue damage level. Quadriceps-patellapatellar tendon-tibia complexes were harvested and fixed in neutral buffered formalin under tension. The specimens were processed for histologic evaluation using a polymethyl methacrylate embedding protocol. 26 Thick sections (~200 μm) were cut in the sagittal plane using a diamond wafering saw (Isomet; Buehler, Ltd., Lake Bluff, IL, USA) with a silicone-based lubricant (Eros; Megasol Cosmetic GmbH, Germany) to prevent hydration of the embedded tissue that produces artifactual fibril fraying during cutting. The thick sections were mounted on glass slides for SHG imaging with no additional preparation (e.g., staining, polishing).
SHG imaging on tendon sections (one section per animal) was performed on an upright laser-scanning multiphoton microscope (BioRad Radiance2000; Carl Zeiss Microimaging Inc., Thornwood, NY), with a 10-Watt Verdi V10-Mira 900 Ti:Sapphire laser (Coherent Inc., Santa Clara, CA), tuned to 840 nm. A 60× (NA = 1.4) oil immersion objective was used for focusing the excitation beam on slides that were mounted on the stage with the longitudinal axis of the tendon aligned with the horizontal axis of the visual field. Reflected SHG signals were collected using an external detector via a bandpass filter (450/80 nm). Under these configurations, 8-bit grayscale images were acquired at 1024 × 1024 pixel resolution on a field of view of 205 μm at a scan speed of 50 lines/s and 1 μm optical sections through the entire thickness of the midlength region of the central sagittal tendon section. Images were stored in TIFF format and image stacks were reconstructed to characterize the 3D morphological features of the tendon. Qualitative assessment of tendon images was made by a blinded observer.
Fourier Transform-Based Analysis
We developed objective, computational parameters to characterize the extent to which damage is present within the tendon microstructure based on Fourier transform methods, which convert complex spatial patterns (represented by changes in pixel intensity values) into directionally dependent frequency components. 29 We used this method because fatigue-induced damage was expected to disrupt the normal alignment of collagen fibrils and this disorganization will alter the frequency components relative to non-damaged control tendons. Using a custom-written algorithm in MATLAB (Mathworks, Natick, MA), fast Fourier transform (FFT) was performed on each image (of dimensions N × N; N = 1024), converting it from spatial to frequency domain according to Eq. (1):
| (1) |
where f(a, b), the image function in spatial coordinates, corresponds on a point-to-point basis to the transform function F(k,l) in frequency space. The transform coefficient, F(k,l), which has both real and imaginary components, is expressed in its absolute form, P(k,l), which is the amplitude of transform equation, based on Eq. (2):
| (2) |
Plotting P(k,l) results in a power spectrum, which is a graphical representation of the distribution of frequency components that make up the tendon image, rotated counterclockwise by 90° and mapped radially with P(0,0) representing the DC component, or the average brightness of the image (Fig. 1). The radial axis represents spatial frequency; therefore, pixels surrounding the center correspond to the lowest frequencies. As an inherent property of the FFT power spectrum of images with patterns of spatial alignment, pixels displaying high intensity values are clustered along the orientation of the highest degree of fiber directional anisotropy (or the principle orientation of fiber alignment22; 90° and 270°) (Fig. 1b). A cross-sectional profile graphically shows the greater contribution of low-frequency components than those of high frequency to the image along this orientation (Fig. 1c). In contrast, along the orientation with the lowest degree of directional anisotropy (or the direction of highest periodicity, which is transverse to that of principle fiber alignment; 0° and 180°), the intensity profile shows similar contribution of low and high frequency components (Fig. 1d). Clustering of pixels diminishes with the degree of anisotropy; a random organization of fibers with no anisotropy is characterized by a spectral distribution of intensities that resembles a circular, dispersed pattern.
FIGURE 1.

Fourier transform-based analysis. Beginning with a multiphoton micrograph (a), its corresponding Fourier transform power spectrum is generated (b), which is inherently rotated by 90°. Based on which, the log–log relationship between spatial frequency and pixel intensity was plotted along all radial directions at 1° increments. Representative plots at 90° (c) and 0° (d) are shown; the slope of the line fitted in these plots, which characterizes the relative distribution among low and high frequency components, is defined as the power spectral gradient (PSG).
Power Spectral Gradient
We developed a fractal-based algorithm to characterize the distribution of pixel intensities in the power spectra.22 Initially, image contrast was maximized by linearly expanding the intensity range from 0 to 255 within each image. Along all radial directions spaced at 1° increments, the power spectral intensity values, or amplitudes, were expressed as a function of spatial frequency magnitude on a log–log plot (Figs. 1c and 1d). The log–log relationship was then fitted using linear regression, with the slope determined as the power spectral gradient (PSG). This was repeated in all radial directions, resulting in a radial profile of PSGs. The mean PSG profile for each tendon was determined by averaging the PSGs of images through the entire image stack at each radial direction. The PSG aspect ratio was determined by normalizing the maximum by the minimum values from the PSG profile as a measurement of fiber anisotropy.
Local Fiber Orientation Mapping
In addition to determining fiber anisotropy at the field of view (FOV) scale, damage was also assessed at the local scale to evaluate changes in local fiber orientation in the control and damage matrix. This measure will provide a three-dimensional map of damage that can be used to quantify damage distribution and density. Variation in damage distribution and density are expected to contribute to the variation in tendon mechanical degradation following cyclic loading. Each image was first discretized into small, 30 × 30 pixel (~6 μm) windows, which correspond to the approximate width of a few fibrils. Each window was processed using FFT to generate the power spectrum, based on which a simple, thresholding algorithm was implemented to isolate the cluster of high-intensity pixels. Linear regression was used to determine the alignment of the clustered pixels, which is orthogonal to the principle orientation among the fibrils within the window. Analysis of all windows on each image results in a vector map that characterizes local fiber orientations. Data from the analysis of each tendon were presented as a distribution of angles deviating from the principle axis of the tendon, reflecting the degree of fiber anisotropy. Distributions across tendons among the experimental and control groups of tendons were compared statistically using the Kolmogorov–Smirnoff test. Additionally, density of damage was characterized by angles of deviation within one, two, and three standard deviations among tendons of the control and experimental groups were determined and compared statistically using the Kruskal–Wallis test, followed by Dunn’s post-hoc test. Statistical significance was set at p ≤ 0.05.
RESULTS
SHG images showed the collagen fibril architecture in remarkable detail in both control and fatigue damaged tendons. Control tendons exhibited highly aligned, parallel collagen fibers throughout the depth of the tendon with no evidence of matrix disruption (Figs. 2a and 2e). At low fatigue, the tendon microstructure includes isolated kinked deformation patterns that span transversely across multiple fibers and penetrated into the depth of the section (Figs. 2b and 2f). Spaces between fibers appeared to have widened slightly; these morphological changes appeared throughout the thickness of the tendon, as clearly shown on the cross section of the 3D reconstruction (Fig. 2f). Otherwise, the collagen microarchitecture remained intact, with no signs of rupture. At moderate fatigue, there was an observable increased density of kinked fiber patterns in the matrix (Figs. 2c and 2g), which exhibited a staggered formation, suggesting the occurrence of slippage at the interface between the fibers. Interfiber space appeared to have grown in width and established some connectivity with each other (Fig. 2g). Occasionally, at the apex of the kink patterns, fibrils with frayed ends were observed. At high fatigue, the matrix is severely disrupted (Figs. 2d and 2h), with poor fiber alignment, further widening of interfiber space, and a further increased density of damage patterns in the tissue. Severely deformed fibers exhibited a curled pattern that appears to have resulted from a recoiling of overstretched fibers. The deformation may follow an in-plane or out-of-plane trajectory, resulting in the formation of a void in the matrix. There is also evidence of fiber rupture and fiber thinning with poor fibril definition and reduced signal intensity.
FIGURE 2.

Representative SHG images (a–d) and 3D reconstruction (e–h) of control and fatigue damaged tendons. Images of the control tendon show no evidence of disruption of the matrix (a, e). At low level fatigue, angulated, kinked, fiber formations are observed (b), while interfiber space becomes evident on the cross section (f). Moderate fatigue damage is characterized by an increased density of fiber deformation patterns (c), while the cross section shows interfiber spaces that appear to have established some connectivity with each other (g). At high level fatigue, matrix discontinuities are observed at planar level (d), which appears to have resulted from fibers deforming severely in an in- and out-of-plane pattern (h; indicated by curved arrows).
FFT analysis of the multiphoton micrographs showed that different levels of fatigue damage were represented by different power spectra and PSG profiles. Images of control tendons showed a power spectrum that was characterized by a narrow band of high intensities aligned along the transverse axis of the image (Fig. 3a). The mean PSG profile, with an aspect ratio of 3.50, revealed two sharply defined minima occurring near 0° and 180°, which correspond to the direction transverse to principle fiber orientation, and maxima at 90° and 270°, which correspond to principle fiber alignment. Power spectra for fatigue loaded tendons were characterized by decreasingly skewed (i.e., more circular) patterns of spectral intensity distribution with increases in damage level; clustering of high-intensity pixels into a narrow band becomes increasingly widened (Figs. 3b–3d). These changes are represented quantitatively by a generalized increase of spectral gradient values along all radial directions (Fig. 3). Notably, mean PSG profiles showed increases in PSG values along orientations away from the 90° and 270°. These changes are reflected by decreases in aspect ratios of 2.43, 2.38, and 1.64 for the low, moderate, and high-level damage groups, respectively (Fig. 3e).
FIGURE 3.

FFT spectra quantification. Representative FFT power spectra for the images of the control (a), low (b), moderate (c) and high (d) level fatigue tendons are shown. The power spectrum of the control tendons (a) is characterized by a narrow band of high intensities aligned along the transverse axis of the image (a). Power spectra for fatigue loaded tendons are characterized by a decreasingly skewed (i.e., more circular) patterns of spectral intensities distribution with increase in damage level (b–d). PSG calculations are performed in all images at all radial angles (1° increments) to determine the mean PSG profile, based on which an aspect ratio is computed. Mean PSG profile for the control tendons, with an aspect ratio of 3.50, reveals two sharply defined minima occurring near 0° and 180° (e). These changes are represented quantitatively by a generalized increase of spectral gradient values along all radial directions. These changes are reflected by decreases in aspect ratios of 2.43, 2.38, and 1.64 for the low, moderate, and high level damage groups, respectively (e).
FFT methods were also used to evaluate the local orientations of the fiber microstructure. Qualitative assessment showed that the vectors accurately describe local fiber angulations (Fig. 4). Tabulated angles of deviation (from the principal direction of fiber alignment) among mapped vectors for tendons in each group are expressed as histograms (Fig. 5), which demonstrated a good fit using Gaussian distributions (with an r2 ≤ 0.954). Statistical analysis demonstrated that the distribution of local orientation vectors shows less organization (or anisotropy) with each level of increased fatigue (p ≤ 0.026). As a measure of density of damage, angles of deviation at 1σ, 2σ, and 3σ standard deviations are shown in Fig. 6; significant increase from control was observed in the high damage at 1σ, and in both moderate and high damage groups at 2σ and 3σ (p < 0.05).
FIGURE 4.
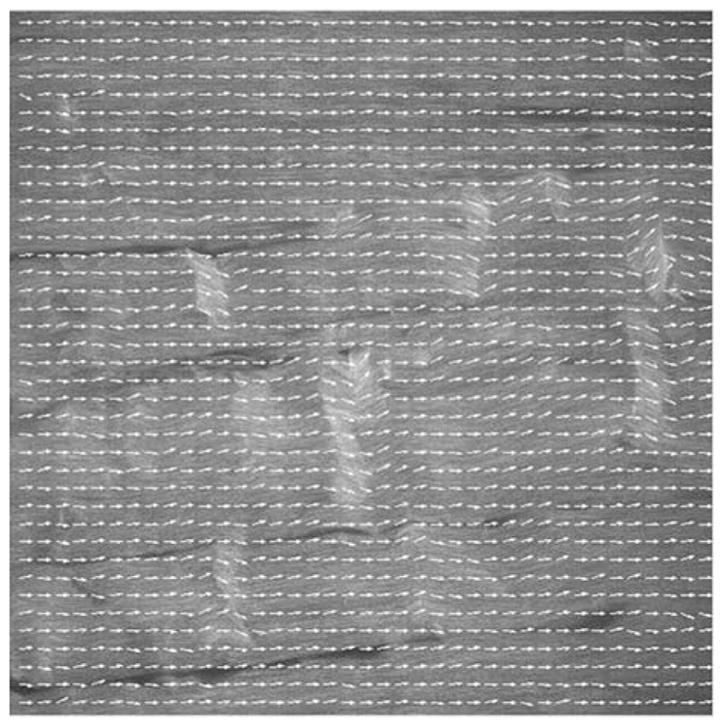
Vector map of local fiber orientations. Each image is first discretized into small, 30 × 30 pixel (~6 μm) windows, which are then processed individually using FFT to generate the power spectrum. Based on which, the alignment of the clustering pattern of high intensity pixels is determined and its orthogonal direction represents the principle orientation among the fibrils within the window. Analysis shows that this technique characterizes faithfully the local orientation of the fibers.
FIGURE 5.

Distribution of local fiber orientation. Angles of deviation representing the mapped vectors for tendons in the control (a), low (b), moderate (c), and high (d) damage levels are tabulated and fitted using Gaussian distribution (with an r2 ≤ 0.954). Distribution of local orientation vectors shows significantly less organization (or anisotropy) from one fatigue level to the next (p ≤ 0.026).
FIGURE 6.

Distribution of local fiber orientations expressed in one (1σ), two (2σ), and three (3σ) standard deviations among the different damage groups. At 1σ (a), significant difference in the angle of deviation is observed between the control and high level damage tendons. At 2σ (b) and 3σ (c), significant difference in the angle of deviation is observed between the control and moderate or high level damage tendons (p ≤ 0.05).
DISCUSSION
Clinical histopathological studies24,31 and animal models1,6,28,33 of tendon pathology have revealed various forms of disruptions of the collagen fiber microarchitecture. However, the spatial and cumulative nature of these microstructural changes and their manifestation in mechanical behavior remain unclear. Existing analysis methods of tendon morphology using routine, conventional histological techniques are largely limited to visualization of the tendon matrix in planar dimensions and nonstandardized, subjective interpretation of damage. To circumvent these limitations, we developed an imaging and analysis approach by capturing SHG signals from the tendon tissue under multiphoton microscopy and quantifying microstructural organization of matrix using Fourier transform-derived methods. This approach enabled novel visualization of the 3D microstructure of the collagenous matrix without stain or the attendant potential for cutting artifact and allowed for the development of measures of fiber anisotropy.
Characterization of tendon microstructure using SHG imaging of thick sections revealed morphological features that provided insight into mechanisms of loading and damage at the matrix level. 3D reconstruction of control tendons revealed a densely packed, fibrous matrix. At low fatigue, the matrix showed spatially localized, kinked fiber deformations. These are likely the manifestation of local areas of the matrix with inferior material properties that have been stretched to the plastic range or failure. Cross-sectional views of the image reconstructions demonstrated widened spaces between individual fibers, which appears to be present through the thickness of the tendon section and not associated with the deformed fibers. Similar types of morphological changes were also observed in tendons at moderate fatigue levels, but in an increasingly severe form, with evidence of interfiber slippage (Fig. 2c) and coalescence of interfiber spaces (Fig. 2g). This observation suggested that, mechanistically, fatigue loading delivered distributed stresses across the tissue and imposed a dissociative, “loosening” effect among individual fibers early in fatigue life. We speculate that this results from the disruption of interfiber links that cross adjacent fibers. At high fatigue levels, the tissue matrix was grossly disrupted, with further widening of interfiber spaces, while some fibers were severely deformed in in- and out-of-plane directions, leading to the creation of voids that penetrate the depth of the tissue section. Thin section cutting in conventional histologic methods may produce a visual artifact in which voids are interpreted as fiber discontinuity when, in fact, they resulted from recoiling of grossly deformed fibers that remain intact. Furthermore, presence of thinning of individual fibers supports the occurrence of an additional mode of tissue damage, which involves interfibrillar sliding and dissociation, attributed to the disruption of molecules, such as proteoglycans, that bridge among fibrils,30 and may not be clearly demonstrated using conventional histologic methods on thin sections.
The analysis method developed in the current study successfully quantified different levels of tendon fatigue damage. Microstructural damage is manifested by frequency-domain representations of images using the PSG profile. Regardless of damage level, the principle fiber axis was identified on the PSG radial plots by orientation at which peak PSG values are aligned. In control tendons, PSG plots showed an elongated, highly skewed profile (with a high aspect ratio of 3.50), with the minimum value occurring transverse to the principle fiber axis Microstructurally, this reflects undisturbed, parallel alignment of the collagen fibers. At low and moderate levels of damage, the aspect ratios are reduced (2.42 at low and 2.38 at moderate level of damage), with a generalized increase in PSG values relative to control. This is attributed to the formation of kinked fiber patterns and widened inter-fiber spaces, which disrupted transverse periodicity and directional anisotropy, resulting in alternation of frequency components in all orientations. The PSG profiles showed less apparent changes from low to moderate fatigue level since the type of damage patterns were similar between the two states; however, images do show the accumulation of transversely oriented deformation patterns. Hence, this was reflected by an increase of PSG values in the 90° and 270° orientations (along the principle axis of the tendon). At high fatigue damage, characteristic microstructural changes, including grossly disrupted fiber alignment and voids in the matrix, introduced an overall reduction in anisotropy in the alignment patterns. This corresponds to a PSG profile markedly reduced in its skewness (aspect ratio of 1.64), approaching the shape of a circle. As such, these radial PSG plots may be considered “fingerprints” of tendon microstructure at progressive levels of fatigue damage, manifesting geometric properties of the images in the frequency domain.
Variation of directional anisotropy among different damage levels was also demonstrated when analyzed at a local level. FFT analysis of images discretized into small windows resulted in a vector map that faithfully described the local fiber orientations throughout the matrix. This analysis approach advances the study of tendon microstructure by applying FFT methods, which were used to characterize the global frequency response of an image (PSG profile), to identifying quantitative, orientation-specific descriptions of fibers at the local scale (vector map). While the population of vectors among the various damage groups all followed a Gaussian distribution (r2 ≤ 0.954), statistical analysis showed they are significantly different from one another. These findings demonstrated that FFT assessment of local fiber directional anisotropy is a sensitive measure of microstructural damage that could be used as a marker of increasing levels of microstructural damage in tendons. As a measure of density of damage, we used standard deviations about the average as thresholds of progressive damage among the distributions of the damage groups. Interestingly, statistical significance was not observed between control and low level damage, suggesting that occurrences of low level damage, seen as small changes in fiber angulation, are so sparse that they are not measured when the parameter is derived to represent 68% (1σ), 95% (2σ), or 99.7% (3σ) of the vector population, but are reflected by variations in the entire distribution of directional vectors. Nonetheless, a stepwise increase in density with damage level was observed. Together with the PSG profile, matrix distribution of local fiber orientations establishes a set of mathematical parameters that allow morphological changes to be associated with previously observed alterations in mechanical properties in damaged tendons.
We implemented an advanced imaging technique, which exhibits tendon morphology by detecting a nonlinear optical property, SHG, inherent to fibrillar collagen. SHG imaging has been previously implemented to visualize various biological tissues.8,10,12,15,35,37,42,43 This imaging technique is able to penetrate into the depth of the section; therefore, the tendon matrix could be visualized deep into the thickness of the tissue in high spatial resolution without staining or being susceptible to cutting artifact from thin sectioning. Similarly, Fourier transform-derived techniques have been used to assess the microarchitecture of collagenous tissues,14,36,38 tissue engineered scaffolds,3,4 and collagen matrix culture. 25,27 Measurements of anisotropy have also been devised to characterize trabecular bone microarchitecture 40 in studies of osteoporosis13,39 and pathologic states of microvasculature in cirrhotic liver.21 However, the current study is the first of which we are aware to incorporate an FFT-based method to characterize 3D morphological features and progression of a type of tissue pathology based on SHG imaging.
While variability in data acquisition could be introduced by observer preference and hardware configuration 5 (such as laser characteristics, acquisition properties, filter settings and polarization), which is likely different from one multiphoton microscope to another, or within the same microscope at different scanning sessions, care was taken to ensure that the visual field was maximally illuminated prior to every scan, while illumination was optimized based on visualization of the optical section in the middle of the stack. To enhance contrast within each image, background brightness was eliminated by assigning zero value to the center pixel of the power spectrum. We conducted pilot studies to determine that noise, which may be amplified with high gain settings during data acquisition, did not produce a significant effect on the analysis results; therefore, images were not filtered.
We note several limitations in the current study. The methods in characterizing fiber anisotropy were conducted on planar images; kinking of fibers is a 2D projection of a spatial deformation pattern that exists in three dimensions. Therefore, quantitative characterization of damage likely underestimates the actual amount of damage. Future studies may investigate the effect that the plane of orientation has on the quantitative measures. Alternatively, an increasingly sophisticated algorithm would be required to establish connectivity of sometimes severely deformed fibers, which requires substantial interpolation and approximation. Additionally, location of the scan was selected in the tendon midsubstance. Additional systematic image sampling within and across individual tendons would improve the frequency-domain characterization of damage. Furthermore, imaging studies were performed in devitalized, plastic embedded tendon samples. In addition, tendons were fixed under tension during histologic preparation, which straightens the crimp inherent to the fibers/fibrils in their unloaded state. However, this will unlikely diminish the sensitivity of the PSG analysis in characterizing damage, since disruptive, fiber damage patterns from fatigue loading are what contribute to alterations to a frequency content that represent an otherwise well-aligned fibrous microstructure with high periodicity, in presence or absence of crimps.
Studies are underway to examine whether the approach could be applied effectively to analyze data acquired from clinically available imaging modalities (such as ultrasound, computed tomography, and magnetic resonance imaging) and evaluate other tissue pathologies in which changes in microstructural organization underlies the progression of the disease. To bridge the gap between our image analysis techniques and clinical images derived from in vivo tendon samples, we are investigating the feasibility of capturing SHG images of fresh and ultimately in vivo tendon samples. Developing a protocol for non-destructively imaging in vivo tendon samples and processing those images using automatic analysis techniques to measure quantitative outputs may provide a means for measuring diagnosing subclinical tendinosis and ultimately reducing the overall morbidity and costs associated with tendon injury.
In conclusion, we developed an imaging and computational approach to objectively assess fatigue damage in tendons. Under the multiphoton microscope, with the laser tuned to 840 nm, tendon microstructure was characterized by capturing SHG signals from fibrillar collagen. The method allows visualization of the microstructure into the depth of the tendon section (~200 μm thick), not only the cut surface of the section, and is limited only by the penetration of the SHG signal, thus allowing 3D characterization of sections throughout the thickness, without the use of stains. Imaging results showed presence of kinked, or angulated, fiber deformation patterns and widening of interfiber space at low levels of damage, and grossly deformed fibers, fiber rupture and presence of voids at a high level of damage. We assessed that damage using Fourier transform-based methods and derived PSG profiles that are characteristic to each level of damage reflect the morphological nature of the damage. Additionally, analysis of the images discretized into small regions resulted in a vector map that quantifies the local fiber orientation in the matrix. Angular distribution of the local fiber orientations showed that the matrix is significantly less organized from one damage level to the next. These findings established these Fourier transform-derived measures as quantitative markers of tissue damage in tendon fatigue. Application of the methods will be extended to examine systematically the process of tendon damage formation and accumulation by assessing the spatial, clustering/focal nature and the growth of fiber patterns within the tendon at the organ level with loading. Moreover, the current imaging and analysis approach are implemented in continuing studies to investigate mechanisms of damage formation and accumulation by delineating precise changes in the microstructure with their manifestations in mechanical behavior.
Acknowledgments
This study was supported by grants from the Aircast Foundation and NIH Grants AR41210, AR44927, AR49967, and AR52743.
References
- 1.Archambault JM, Hart DA, Herzog W. Response of rabbit Achilles tendon to chronic repetitive loading. Connect Tissue Res. 2001;42(1):13–23. doi: 10.3109/03008200109014245. [DOI] [PubMed] [Google Scholar]
- 2.Avolio A, Jones D, Tafazzoli-Shadpour M. Quantification of alterations in structure and function of elastin in the arterial media. Hypertension. 1998;32(1):170–175. doi: 10.1161/01.hyp.32.1.170. [DOI] [PubMed] [Google Scholar]
- 3.Ayres C, Bowlin GL, Henderson SC, Taylor L, Shultz J, Alexander J, Telemeco TA, Simpson DG. Modulation of anisotropy in electrospun tissue-engineering scaffolds: analysis of fiber alignment by the fast Fourier transform. Biomaterials. 2006;27(32):5524–5534. doi: 10.1016/j.biomaterials.2006.06.014. [DOI] [PMC free article] [PubMed] [Google Scholar]
- 4.Ayres CE, Bowlin GL, Pizinger R, Taylor LT, Keen CA, Simpson DG. Incremental changes in anisotropy induce incremental changes in the material properties of electrospun scaffolds. Acta Biomater. 2007;3(5):651–661. doi: 10.1016/j.actbio.2007.02.010. [DOI] [PMC free article] [PubMed] [Google Scholar]
- 5.Ayres CE, Jha BS, Meredith H, Bowman JR, Bowlin GL, Henderson SC, Simpson DG. Measuring fiber alignment in electrospun scaffolds: a user’s guide to the 2D fast Fourier transform approach. J Biomater Sci Polym Ed. 2008;19(5):603–621. doi: 10.1163/156856208784089643. [DOI] [PubMed] [Google Scholar]
- 6.Backman C, Boquist L, Friden J, Lorentzon R, Toolanen G. Chronic achilles paratenonitis with tendinosis: an experimental model in the rabbit. J Orthop Res. 1990;8(4):541–547. doi: 10.1002/jor.1100080410. [DOI] [PubMed] [Google Scholar]
- 7.Blevins FT, Djurasovic M, Flatow EL, Vogel KG. Biology of the rotator cuff tendon. Orthop Clin North Am. 1997;28(1):1–16. doi: 10.1016/s0030-5898(05)70260-1. [DOI] [PubMed] [Google Scholar]
- 8.Brown E, McKee T, diTomaso E, Pluen A, Seed B, Boucher Y, Jain RK. Dynamic imaging of collagen and its modulation in tumors in vivo using second-harmonic generation. Nat Med. 2003;9(6):796–800. doi: 10.1038/nm879. [DOI] [PubMed] [Google Scholar]
- 9.Caligiuri P, Giger ML, Favus M. Multifractal radiographic analysis of osteoporosis. Med Phys. 1994;21(4):503–508. doi: 10.1118/1.597390. [DOI] [PubMed] [Google Scholar]
- 10.Campagnola PJ, Clark HA, Mohler WA, Lewis A, Loew LM. Second-harmonic imaging microscopy of living cells. J Biomed Opt. 2001;6(3):277–286. doi: 10.1117/1.1383294. [DOI] [PubMed] [Google Scholar]
- 11.Campagnola PJ, Loew LM. High-resolution nonlinear optical imaging of live cells by second harmonic generation. Biophys J. 1999;77:3341–3349. doi: 10.1016/S0006-3495(99)77165-1. [DOI] [PMC free article] [PubMed] [Google Scholar]
- 12.Campagnola PJ, Loew LM. Second-harmonic imaging microscopy for visualizing biomolecular arrays in cells, tissues and organisms. Nat Biotechnol. 2003;21(11):1356–1360. doi: 10.1038/nbt894. [DOI] [PubMed] [Google Scholar]
- 13.Chappard C, Brunet-Imbault B, Lemineur G, Giraudeau B, Basillais A, Harba R, Benhamou CL. Anisotropy changes in post-menopausal osteoporosis: characterization by a new index applied to trabecular bone radiographic images. Osteoporos Int. 2005;16(10):1193–1202. doi: 10.1007/s00198-004-1829-5. [DOI] [PubMed] [Google Scholar]
- 14.Chaudhuri S, Nguyen H, Rangayyan RM, Walsh S, Frank CB. A Fourier domain directional filtering method for analysis of collagen alignment in ligaments. IEEE Trans Biomed Eng. 1987;34(7):509–518. doi: 10.1109/tbme.1987.325980. [DOI] [PubMed] [Google Scholar]
- 15.Cox G, Kable E, Jones A, Fraser I, Manconi F, Gorrell MD. 3-Dimensional imaging of collagen using second harmonic generation. J Struct Biol. 2003;141(1):53–62. doi: 10.1016/s1047-8477(02)00576-2. [DOI] [PubMed] [Google Scholar]
- 16.Deng X, Williams ED, Thompson EW, Gan X, Gu M. Second-harmonic generation from biological tissues: effect of excitation wavelength. Scanning. 2002;24(4):175–178. doi: 10.1002/sca.4950240403. [DOI] [PubMed] [Google Scholar]
- 17.Denk W, Stickler JH, Webb WW. Two-photon laser scanning laser fluorescence. Science. 1990;248:73–76. doi: 10.1126/science.2321027. [DOI] [PubMed] [Google Scholar]
- 18.Fung DT, Wang VM, Andarawis-Puri N, Basta-Pljakic J, Li Y, Laudier DM, Sun HB, Jepsen KJ, Schaffler MB, Flatow EL. Early response to tendon fatigue damage in a novel in vivo model. J Biomech. 2009 doi: 10.1016/j.jbiomech.2009.08.039. accepted. [DOI] [PMC free article] [PubMed] [Google Scholar]
- 19.Fung DT, V, Wang M, Laudier DM, Shine JH, Basta-Pljakic J, Jepsen KJ, Schaffler MB, Flatow EL. Subrupture tendon fatigue damage. J Orthop Res. 2009;27(2):264–273. doi: 10.1002/jor.20722. [DOI] [PMC free article] [PubMed] [Google Scholar]
- 20.Gauderon R, Lukins PB, Sheppard CJ. Three-dimensional second harmonic generation imaging with femtosecond laser pulses. Optics Lett. 1998;23:1209–1211. doi: 10.1364/ol.23.001209. [DOI] [PubMed] [Google Scholar]
- 21.Gaudio E, Chaberek S, Montella A, Pannarale L, Morini S, Novelli G, Borghese F, Conte D, Ostrowski K. Fractal and Fourier analysis of the hepatic sinusoidal network in normal and cirrhotic rat liver. J Anat. 2005;207(2):107–115. doi: 10.1111/j.1469-7580.2005.00436.x. [DOI] [PMC free article] [PubMed] [Google Scholar]
- 22.Jiang CF, Avolio AP. Characterisation of structural changes in the arterial elastic matrix by a new fractal feature: directional fractal curve. Med Biol Eng Comput. 1997;35(3):246–252. doi: 10.1007/BF02530045. [DOI] [PubMed] [Google Scholar]
- 23.Jiang C, Pitt RE, Bertram JE, Aneshansley DJ. Fractal-based image texture analysis of trabecular bone architecture. Med Biol Eng Comput. 1999;37(4):413–418. doi: 10.1007/BF02513322. [DOI] [PubMed] [Google Scholar]
- 24.Kannus P, Jozsa L. Histopathological changes preceding spontaneous rupture of a tendon. A controlled study of 891 patients. J Bone Joint Surg Am. 1991;73(10):1507–1525. [PubMed] [Google Scholar]
- 25.Kim A, Lakshman N, Petroll WM. Quantitative assessment of local collagen matrix remodeling in 3-D culture: the role of Rho kinase. Exp Cell Res. 2006;312(18):3683–3692. doi: 10.1016/j.yexcr.2006.08.009. [DOI] [PMC free article] [PubMed] [Google Scholar]
- 26.Laudier D, Schaffler MB, Flatow EL, Wang VM. Novel procedure for high-fidelity tendon histology. J Orthop Res. 2007;25(3):390–395. doi: 10.1002/jor.20304. [DOI] [PubMed] [Google Scholar]
- 27.Marquez JP. Fourier analysis and automated measurement of cell and fiber angular orientation distributions. Int J Solids Struct. 2006;43:6413–6423. [Google Scholar]
- 28.Nakama LH, King KB, Abrahamsson S, Rempel DM. Evidence of tendon microtears due to cyclical loading in an in vivo tendinopathy model. J Orthop Res. 2005;23(5):1199–1205. doi: 10.1016/j.orthres.2005.03.006. [DOI] [PubMed] [Google Scholar]
- 29.Sander EA, Barocas VH. Comparison of 2D fiber network orientation measurement methods. J Biomed Mater Res A. 2008 doi: 10.1002/jbm.a.31847. [DOI] [PubMed] [Google Scholar]
- 30.Scott JE. Proteoglycan-fibrillar collagen interactions. Biochem J. 1988;252(2):313–323. doi: 10.1042/bj2520313. [DOI] [PMC free article] [PubMed] [Google Scholar]
- 31.Sonnabend DH, Watson EM. Structural factors affecting the outcome of rotator cuff repair. J Shoulder Elbow Surg. 2002;11(3):212–218. doi: 10.1067/mse.2002.122272. [DOI] [PubMed] [Google Scholar]
- 32.Soslowsky LJ, Carpenter JE, Bucchieri JS, Flatow EL. Biomechanics of the rotator cuff. Orthop Clin North Am. 1997;28(1):17–30. doi: 10.1016/s0030-5898(05)70261-3. [DOI] [PubMed] [Google Scholar]
- 33.Soslowsky LJ, Thomopoulos S, Tun S, Flanagan CL, Keefer CC, Mastaw J, Carpenter JE Neer Award 1999. Overuse activity injures the supraspinatus tendon in an animal model: a histologic and biomechanical study. J Shoulder Elbow Surg. 2000;9(2):79–84. [PubMed] [Google Scholar]
- 34.Sun HB, Li Y, Fung DT, Majeska RJ, Schaffler MB, Flatow EL. Coordinate regulation of IL-1beta and MMP-13 in rat tendons following subrupture fatigue damage. Clin Orthop Relat Res. 2008;466(7):1555–1561. doi: 10.1007/s11999-008-0278-4. [DOI] [PMC free article] [PubMed] [Google Scholar]
- 35.Teng SW, Tan HY, Peng JL, Lin HH, Kim KH, Lo W, Sun Y, Lin WC, Lin SJ, Jee SH, So PT, Dong CY. Multiphoton autofluorescence and second-harmonic generation imaging of the ex vivo porcine eye. Invest Ophthalmol Vis Sci. 2006;47(3):1216–1224. doi: 10.1167/iovs.04-1520. [DOI] [PubMed] [Google Scholar]
- 36.van Zuijlen PP, de Vries HJ, Lamme EN, Coppens JE, van Marle J, Kreis RW, Middelkoop E. Morphometry of dermal collagen orientation by Fourier analysis is superior to multi-observer assessment. J Pathol. 2002;198(3):284–291. doi: 10.1002/path.1219. [DOI] [PubMed] [Google Scholar]
- 37.Williams RM, Zipfel WR, Webb WW. Interpreting second-harmonic generation images of collagen I fibrils. Biophys J. 2005;88(2):1377–1386. doi: 10.1529/biophysj.104.047308. [DOI] [PMC free article] [PubMed] [Google Scholar]
- 38.Xia Y, Elder K. Quantification of the graphical details of collagen fibrils in transmission electron micrographs. J Microsc. 2001;204(Pt 1):3–16. doi: 10.1046/j.1365-2818.2001.00925.x. [DOI] [PubMed] [Google Scholar]
- 39.Yi WJ, Heo MS, Lee SS, Choi SC, Huh KH. Comparison of trabecular bone anisotropies based on fractal dimensions and mean intercept length determined by principal axes of inertia. Med Biol Eng Comput. 2007;45(4):357–364. doi: 10.1007/s11517-006-0152-z. [DOI] [PubMed] [Google Scholar]
- 40.Yi WJ, Heo MS, Lee SS, Choi SC, Huh KH, Lee SP. Direct measurement of trabecular bone anisotropy using directional fractal dimension and principal axes of inertia. Oral Surg Oral Med Oral Pathol Oral Radiol Endod. 2007;104(1):110–116. doi: 10.1016/j.tripleo.2006.11.005. [DOI] [PubMed] [Google Scholar]
- 41.Zhang L, Dean D, Liu JZ, Sahgal V, Wang X, Yue GH. Quantifying degeneration of white matter in normal aging using fractal dimension. Neurobiol Aging. 2007;28(10):1543–1555. doi: 10.1016/j.neurobiolaging.2006.06.020. [DOI] [PubMed] [Google Scholar]
- 42.Zipfel WR, Williams RM, Christie R, Nikitin AY, Hyman BT, Webb WW. Live tissue intrinsic emission microscopy using multiphoton-excited native fluorescence and second harmonic generation. Proc Natl Acad Sci USA. 2003;100(12):7075–7080. doi: 10.1073/pnas.0832308100. [DOI] [PMC free article] [PubMed] [Google Scholar]
- 43.Zoumi A, Yeh A, Tromberg BJ. Imaging cells and extracellular matrix in vivo by using second-harmonic generation and two-photon excited fluorescence. Proc Natl Acad Sci USA. 2002;99(17):11014–11019. doi: 10.1073/pnas.172368799. [DOI] [PMC free article] [PubMed] [Google Scholar]