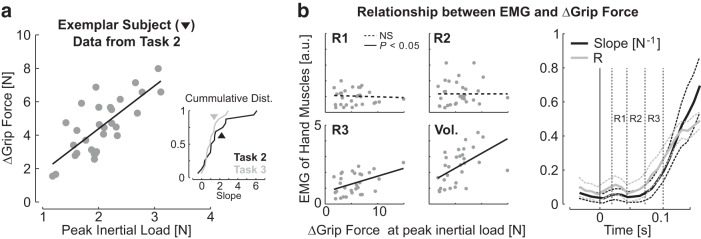
Figure 5.
a, Trial-by-trial modulation of grip force with the peak inertial loads from one representative subject. The side plot presents the cumulative distributions of modulation slopes across participants in black and gray for Tasks 2 and 3, respectively. The black triangle corresponds to the exemplar participant. b, Relationship between hand EMG and increments of grip force measured at the time of peak inertial load. The four panels in the left illustrate the gradually better correlation between the change in grip force and the EMG averaged across the different epochs for one representative subject. Data from individual trials were normalized to the grand-average from the pre-perturbation epoch. Right, Regression slopes and correlations between changes in grip force and the average EMG. Dashed traces represent 1 SEM.

