

Abstract
Background
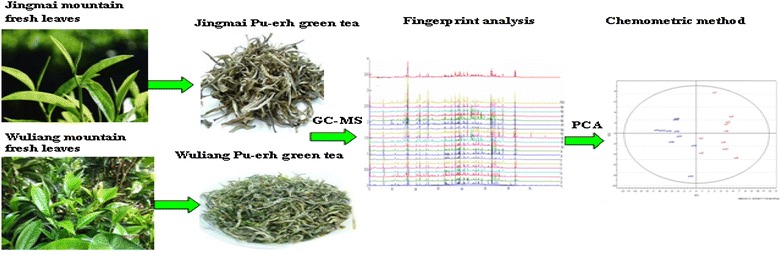
Modern instrumental analysis technology can provide various chemical data and information on tea samples. Unfortunately, it remains difficult to extract the useful information. We describe the use of chemical fingerprint similarities, combined with principal component and cluster analyses, to distinguish and recognize Pu-erh green teas, which from two tea mountains, Wuliang and Jingmai, in the Pu-erh district of Yunnan province. The volatile components of all 20 Pu-erh green teas (10 Wuliang and 10 Jingmai teas) were extracted and identified by headspace solid-phase micro extraction (HS-SPME) combined with gas chromatography-mass spectrometry (GC-MS).
Results
Sixty-three volatiles (including alcohols, hydrocarbons, ketones, and aldehydes) were identified in the 20 Pu-erh green teas, and differences in compound compositions between them were also observed. Through fingerprint similarity, combined with principal component and cluster analyses, the 20 Pu-erh green teas were differentiated successfully based on their volatile characteristics.
Conclusions
This study demonstrates that the GC-MS combined with chemical fingerprint and unsupervised pattern recognition method is suitable for the investigation of the volatile profiling and evaluating the quality and authenticity of teas related to the different origins.
Graphical abstract.
Differentiate Pu-erh green teas from different tea mountains by using chemical fingerprint similarity and multivariate statistical methods
Electronic supplementary material
The online version of this article (doi:10.1186/s13065-016-0159-y) contains supplementary material, which is available to authorized users.
Keywords: Pu-erh green tea, Gas chromatography-mass spectrometry, Chemical fingerprint similarity, Principal component analysis, Cluster analysis
Background
Pu-erh tea has been produced from the big-leaf species of tea trees in China’s Yunnan province for 1700 years [1]. Pu-erh tea can be further divided into green tea and ripe tea based on different processing techniques. Pu-erh green tea retains the original color of the tea leaves and is not fermented during processing, whereas ripe tea is fermented before drying [2]. Pu-erh green tea is very popular and attracts numerous domestic and foreign consumers owing to its distinct flavor and potential biological and pharmaceutical properties, such as anticancer, hypolipidemic, antioxidant, and oxygen free radical elimination [3].
Yunnan’s forests and smallholder agro-ecosystems result in a diversity of teas, including dozens of wild relatives and hundreds of cultivars and local varieties [4]. Tea in Yunnan grows in forests (mountain), agro-forests, mixed crop fields, and terrace plantations. Forest (mountain) tea generally includes tea trees that are wild, were sparsely planted in forests, or were cultivated and have become feral. Because of the absence of artificial watering, spraying pesticides and fertilizing, forest (mountain) tea usually is better adapted ecologically and environmentally and is of better quality, has more abundant minerals, and a stronger fragrance and taste, compared with tableland teas. However, the forest tea is relatively more expensive than tableland tea owing to its low yield and difficulty in harvesting.
Jingmai and Wuliang mountains are two representative tea mountains in Yunnan province. Jingmai mountain is in the Lancang county of the Pu-erh district. Jingmai ancient tea gardens are regarded as the provenance of the well-known Pu-erh tea. Jingmai tea has an intense and persistent fragrance, and its tea infusion has a relatively weak bitter and strong astringent taste. Wuliang mountain, which is in the Jingdong county of Pu-erh district, has rich resources of aged tea trees, and is one of the largest Pu-erh tea producing mountains. The Wuliang tea infusion has a relatively strong bitter and weak astringent taste, and its fragrance is rich and lasting. Benefiting from different geographical locations and natural resources, the Pu-erh teas produced from these two tea mountains exhibit different quality characteristics. The differences in altitudes, climates, rainfalls, and soil mineral structures between the mountains are potential factors in influencing tea quality, and even results in notable fragrance differences that form special “mountain incense”. Artificial cultivation of tea trees leads to the absorption of more superficial soil nutrients, and the application of unified fertilizing guidelines and chemical fertilizers can result in the origin-related special fragrance gradually disappearing with storage time [5, 6].
Because Pu-erh green tea from different tea mountains has different quality characteristics, their prices can vary widely. Thus, it is necessary to develop a rapid method to identify the producing area and authenticity of Pu-erh tea. Traditionally, the origins of tea have been partially judged by experts based on taste and aroma, but this is often unreliable [7]. The chromatographic fingerprint technique, widely used in traditional Chinese medicines for quality control, has been attracting attention because it emphasizes the systematic characterization of the composition, identification and the evaluation of sample stability [8]. In recent years, chromatogram fingerprint technology has been introduced into tea quality control research. Metabolic fingerprinting, which is based on modern separation techniques, can fully indicate the tea components and their relative proportions, and thus, has been widely used to identify the geographical origin and authenticity of various teas [9, 10]. Several chromatographic methods, including headspace solid-phase micro extraction (HS-SPME) combined with gas chromatography-mass spectrometry (GC-MS), high performance liquid chromatography (HPLC) and ultra-performance liquid chromatography tandem mass-spectrometry (UPLC-MS), have been used to explore the fingerprints of various teas [11–13]. As far as we know, no study has reported the ability to discriminate between sun-dried Pu-erh green teas from different tea mountains using chemical fingerprint similarity calculation software combined with principal component analysis (PCA) and cluster analysis (CA).
In this work, the volatile components of Pu-erh green teas were extracted and identified by HS-SPME combined with GC-MS. The chemical fingerprint similarity, combined with PCA and CA, were developed to evaluate the differences between Pu-erh green teas from two tea mountains (Jingmai and Wuliang). The objective of the current work was to develop an effective tool to identify the origins and authenticity of different Pu-erh green teas.
Results and discussions
Similarity analysis
The similarity analysis of volatile fingerprints was performed using computer-aided similarity evaluation software. Sixty-eight chromatographic peaks were recognized in the sun-dried Pu-erh green teas and 63 peaks were identified using NIST 08.L MS library and retention indices (RIs). Of these, 45 peaks were common to all of the Pu-erh green teas. The common peaks were confirmed by relative standard deviation (RSD %) values having relative retention time values of less than 1 %.
Comparing the fingerprints of Pu-erh green teas from Jingmai and Wuliang mountains
The overlaid GC-MS chromatograms of 20 Pu-erh green teas from Jingmai and Wuliang mountain are shown in Fig. 1. All of the peaks were integrated using a computer-aided similarity evaluation system. As shown in Fig. 1, the volatile fingerprint information for these teas was abundant. A common reference chromatogram is usually regarded as the standardized characteristic fingerprint of the samples to be analyzed. Our reference chromatogram was automatically generated from the 20 overlaid GC-MS chromatograms by the computer-aided similarity evaluation system. The similarity values of all 20 inputted total ion chromatograms (TICs), relative to the reference chromatogram, can be calculated by correlation and congruence coefficients with median or averaged data [14, 15]. When the coefficient values are close to one, the two chromatographic fingerprints will show a high similarity. The similarities of all 20 Pu-erh green teas were calculated based their common model and the results are shown in Table 1.
Fig. 1.
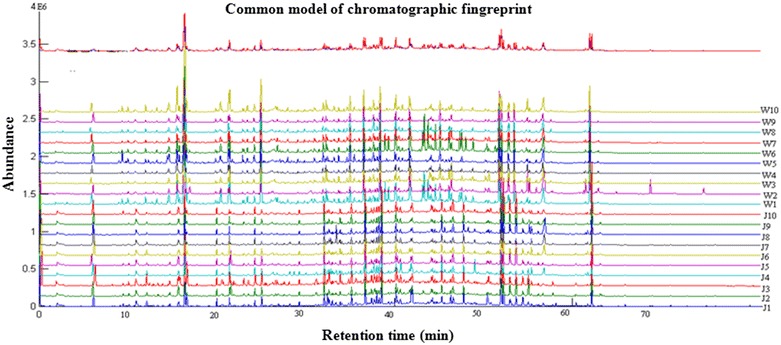
The overlapping GC-MS fingerprint plots of 20 Pu-erh green tea samples
Table 1.
Evaluation of the similarity of 20 Pu-erh green tea samples using their common model of chromatographic fingerprints
| Sample no. | Correlation coefficient | Congruence coefficient (R) | ||
|---|---|---|---|---|
| Median | Average | Median | Average | |
| J1 | 0.6347 | 0.6741 | 0.7254 | 0.7525 |
| J2 | 0.7110 | 0.7465 | 0.7743 | 0.8009 |
| J3 | 0.5918 | 0.6542 | 0.6947 | 0.7382 |
| J4 | 0.7544 | 0.7076 | 0.8278 | 0.7912 |
| J5 | 0.6534 | 0.7082 | 0.7149 | 0.7580 |
| J6 | 0.6028 | 0.6284 | 0.6920 | 0.7096 |
| J7 | 0.5844 | 0.6141 | 0.6893 | 0.7083 |
| J8 | 0.5931 | 0.6554 | 0.6880 | 0.7329 |
| I9 | 0.5614 | 0.6502 | 0.6453 | 0.7133 |
| J10 | 0.6515 | 0.6715 | 0.7293 | 0.7433 |
| W1 | 0.6770 | 0.7901 | 0.7344 | 0.8230 |
| W2 | 0.7012 | 0.7299 | 0.7553 | 0.7782 |
| W3 | 0.8195 | 0.8075 | 0.8596 | 0.8510 |
| W4 | 0.7935 | 0.7840 | 0.8237 | 0.8185 |
| W5 | 0.7292 | 0.8262 | 0.7703 | 0.8480 |
| W6 | 0.7086 | 0.8081 | 0.7580 | 0.8366 |
| W7 | 0.7788 | 0.7947 | 0.8291 | 0.8411 |
| W8 | 0.7489 | 0.7336 | 0.7973 | 0.7863 |
| W9 | 0.6789 | 0.6942 | 0.7399 | 0.7518 |
| W10 | 0.6877 | 0.7878 | 0.7385 | 0.8180 |
As seen in Fig. 1 and Table 1, the chromatograms of the 20 Pu-erh green tea samples were similar, and the similarities among them were relatively high. Thus, these data provided little information on the differences among the 20 teas from the two tea mountains. However, the high degree of similarity between them implies that these samples have similar compositions and aroma contents. Using the data presented in Table 1 and Fig. 1, the teas from the two tea mountains cannot be distinguished from one another.
Construction of the typical GC-MS fingerprint of Jingmai Pu-erh green tea
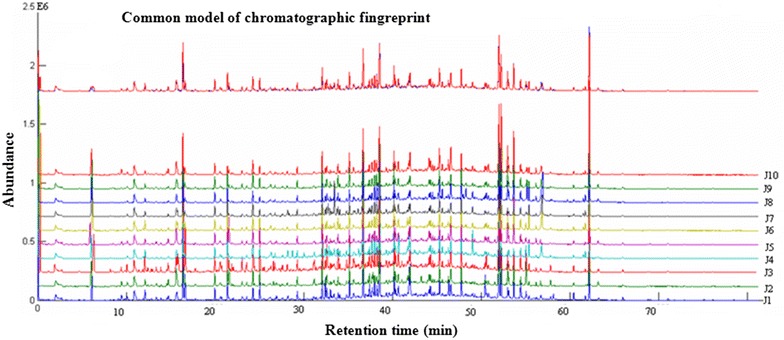
The overlaid GC-MS chromatograms of the 10 Pu-erh green teas from the Jingmai mountain are shown in Additional file 1: Figure S1 (see supporting information). Forty-eight common peaks were found in these 10 Jingmai Pu-erh green teas, and the similarity analysis result based on their common model is shown in Table 2. The similarity value for the 10 Jingmai Pu-erh green teas was more than 0.7500, indicating a high degree of similarity in fingerprint characteristics among samples from the same tea mountain. However, when the chromatograms of the 10 Wuliang Pu-erh green teas were analyzed with the similarity evaluation software using the common model of 10 Jingmai Pu-erh green teas, their similarity value was significantly less (Table 2), implying that there were differences between the Jingmai and Wuliang mountain teas.
Table 2.
Evaluation of the similarity of 20 Pu-erh green tea samples using Jingmai Pu-erh green tea common model of chromatographic fingerprints
| Sample no. | Correlation coefficient | Congruence coefficient (R) | ||
|---|---|---|---|---|
| Median | Average | Median | Average | |
| J1 | 0.7959 | 0.8705 | 0.8391 | 0.8985 |
| J2 | 0.9059 | 0.9067 | 0.9237 | 0.9241 |
| J3 | 0.7500 | 0.8086 | 0.8030 | 0.8504 |
| J4 | 0.8181 | 0.8263 | 0.8606 | 0.8694 |
| J5 | 0.8853 | 0.8708 | 0.9009 | 0.8878 |
| J6 | 0.7766 | 0.7968 | 0.8187 | 0.8354 |
| J7 | 0.7547 | 0.8009 | 0.7821 | 0.8435 |
| J8 | 0.8290 | 0.8853 | 0.8617 | 0.9066 |
| I9 | 0.8158 | 0.8710 | 0.8428 | 0.8869 |
| J10 | 0.9575 | 0.9207 | 0.9649 | 0.9349 |
| W1 | 0.2594 | 0.3101 | 0.4008 | 0.4469 |
| W2 | 0.2853 | 0.3898 | 0.4139 | 0.5036 |
| W3 | 0.2314 | 0.3259 | 0.3785 | 0.4598 |
| W4 | 0.3382 | 0.3564 | 0.4799 | 0.4998 |
| W5 | 0.2766 | 0.3615 | 0.3907 | 0.4654 |
| W6 | 0.2620 | 0.2875 | 0.3913 | 0.4169 |
| W7 | 0.2403 | 0.2565 | 0.3835 | 0.4020 |
| W8 | 0.2314 | 0.2528 | 0.3681 | 0.3906 |
| W9 | 0.2146 | 0.2619 | 0.3366 | 0.3804 |
| W10 | 0.2570 | 0.2743 | 0.3902 | 0.4092 |
Construction of the typical GC-MS fingerprint of Wuliang Pu-erh green tea
Using the same method, the typical GC-MS fingerprint of the 10 Wuliang Pu-erh green teas was constructed, and the overlaid GC-MS chromatograms are shown in Additional file 2: Figure S2 (see supporting information). Fifty-four common peaks were found in the 10 Wuliang Pu-erh green teas. The similarities among the 10 Wuliang Pu-erh green teas were calculated based on their common model as shown in Table 3. We also analyzed the chromatograms of the 10 Jingmai Pu-erh green teas with the similarity evaluation software using the common model of the 10 Wuliang Pu-erh green teas. The results (Table 3) showed that samples from same mountain were highly similar, their similarity value all more than 0.7523, indicating a stable aroma characteristic for samples from the same mountain. Interestingly, an obvious decrease in the similarities among the 10 Jingmai Pu-erh green tea samples was observed when using the common model of the 10 Wuliang Pu-erh green teas. This indicated that there were some differences between Pu-erh green teas from the Wuliang and Jingmai mountains. Thus, 20 Pu-erh green tea samples from the two tea mountains can be distinguished by their volatile fingerprints using the fingerprint similarity method.
Table 3.
Evaluation of the similarity of 20 Pu-erh green tea samples using Wuliang Pu-erh green tea common model of chromatographic fingerprints
| Sample no. | Correlation coefficient | Congruence coefficient (R) | ||
|---|---|---|---|---|
| Median | Average | Median | Average | |
| W1 | 0.7944 | 0.8597 | 0.7527 | 0.8814 |
| W2 | 0.8395 | 0.8341 | 0.8651 | 0.8610 |
| W3 | 0.9633 | 0.9137 | 0.9698 | 0.9305 |
| W4 | 0.9663 | 0.9093 | 0.9708 | 0.9228 |
| W5 | 0.7876 | 0.8912 | 0.8189 | 0.9058 |
| W6 | 0.7590 | 0.8977 | 0.7966 | 0.9128 |
| W7 | 0.9624 | 0.9274 | 0.9691 | 0.9415 |
| W8 | 0.9323 | 0.8751 | 0.9439 | 0.8970 |
| W9 | 0.8512 | 0.8326 | 0.8753 | 0.8602 |
| W10 | 0.7523 | 0.8681 | 0.7731 | 0.8873 |
| J1 | 0.2594 | 0.3101 | 0.4008 | 0.4469 |
| J2 | 0.2853 | 0.3898 | 0.4139 | 0.5036 |
| J3 | 0.2314 | 0.3259 | 0.3785 | 0.4598 |
| J4 | 0.3382 | 0.3564 | 0.4799 | 0.4998 |
| J5 | 0.2766 | 0.3615 | 0.3907 | 0.4654 |
| J6 | 0.2620 | 0.2875 | 0.3913 | 0.4169 |
| J7 | 0.2403 | 0.2565 | 0.3835 | 0.4020 |
| J8 | 0.2314 | 0.2528 | 0.3681 | 0.3906 |
| J9 | 0.2146 | 0.2619 | 0.3366 | 0.3804 |
| J10 | 0.2570 | 0.2743 | 0.3902 | 0.4092 |
Methodology validation
The accuracy of the GC-MS analysis was evaluated by the continuous extraction and injection of the J1 sample five times under the same GC-MS conditions. The results indicated that the RSD values of the relative retention times of common peaks were less than 0.31 % and the RSD values of relative peak areas of common peaks were less than 2.01 %, thereby, validating the accuracy of the GC-MS analysis. The stability was determined at 0, 1, 2, 4, 8, 12, and 24 h by extracting J1 sample under the same GC-MS conditions. The results indicated that the RSD values of the relative retention times and relative peak areas of volatiles were less than 0.42 and 3.96 %, respectively, suggesting that the reasonable time length for sample analysis is within 24 h.
Peak alignment and recognition by principal component analysis
A chromatographic fingerprint may contain a huge number of peaks, requiring chemometric methods to extract the desired information, such as common peaks, similarities among chromatograms, and projection and clustering plots of samples [16]. The computer-aided similarity evaluation software can perform whole spectrum recognition based on integrated fingerprint information and can directly determine relationships between samples in the two-dimensional projection cluster plot of the PCA. Prior to the runtime analysis of the PCA, the chromatographic fingerprints were preprocessed using wavelet smoothness. The PCA result based on all 20 TICs using fingerprint similarity evaluation software is shown in Fig. 2. The fingerprints were divided into two groups, and the group containing fingerprints 1–10 represented the Jingmai Pu-erh green teas and the other group, consisting of fingerprints 11–20, represented the Wuliang Pu-erh green teas. These results indicated that tea samples from different tea mountains have differences in volatile accumulation.
Fig. 2.
The results of the PCA-based chromatographic fingerprints of Jingmai and Wuliang Pu-erh green teas
Analysis of volatile compounds in Jingmai and Wuliang Pu-erh green teas
The volatiles of 20 Pu-erh green tea samples from the Wuliang and Jingmai mountain were isolated and identified using HS-SPME/GC-MS analysis. Table 4 lists the 63 identified volatile components. All 20 tea samples had very similar aroma compositions, mainly including alcohols, hydrocarbons (alkane, olefin, and aromatic hydrocarbon), and ketones. There were significant differences (p < 0.05) in the alcohol contents between the Wuliang (50.77 %) and Jingmai (29.81 %) Pu-erh green teas. The hydrocarbons contents showed little difference (p > 0.05), while the ketones were significantly different between the Wuliang and Jingmai Pu-erh green teas (p < 0.05).
Table 4.
Volatile compounds and their relative contents of Jingmai and Wuliang Pu-erh green tea
| No | RIa | Compoundb | Relative percentage contentc | |
|---|---|---|---|---|
| Jingmai mountain (n = 10) | Wuliang mountain (n = 10) | |||
| 1 | 957 | Benzaldehyde | 0.11 ± 0.10a | 0.10 ± 0.07a |
| 2 | 979 | 1-Octen-3-ol | 0.44 ± 0.35a | 0.65 ± 0.44a |
| 3 | 985 | 6-Methyl-5-heptene-2-one | 0.08 ± 0.12a | 0.14 ± 0.09a |
| 4 | 989 | 2-Pentyl-furan | 0.52 ± 0.23a | 0.63 ± 0.10a |
| 5 | 997 | α-Phellandrene | 0.12 ± 0.12a | 0.06 ± 0.08a |
| 6 | 1011 | α-Terpinene | 0.12 ± 0.09a | 0.06 ± 0.06a |
| 7 | 1026 | D-Limonene | 1.12 ± 0.47a | 0.64 ± 0.22b |
| 8 | 1034 | Benzyl alcohol | 0.16 ± 0.11a | 0.21 ± 0.13a |
| 9 | 1037 | (E)-3,7-Dimethyl-1,3,6-octatriene | 0.11 ± 0.10a | 0.20 ± 0.05b |
| 10 | 1042 | Phenyl acetaldehyde | 0.11 ± 0.07a | 0.21 ± 0.18b |
| 11 | 1048 | Ocimene | 0.32 ± 0.09a | 0.42 ± 0.13a |
| 12 | 1056 | γ-Terpinene | 0.27 ± 0.11a | 0.21 ± 0.06a |
| 13 | 1068 | (E)-2-Octen-1-ol | 0.23 ± 0.23a | 0.38 ± 0.32a |
| 14 | 1072 | Linalool oxide I | 0.75 ± 0.25a | 1.75 ± 0.29b |
| 15 | 1087 | Linalool oxide II | 2.24 ± 0.80a | 3.21 ± 0.96b |
| 16 | 1098 | Linalool | 7.86 ± 2.44a | 20.56 ± 3.47a |
| 17 | 1100 | Hotrienol | 1.50 ± 1.30a | 1.32 ± 0.48a |
| 18 | 1110 | Phenylethyl alcohol | 0.07 ± 0.10a | 0.65 ± 0.83b |
| 19 | 1175 | Linalool oxide IV | 0.57 ± 0.23a | 1.62 ± 0.32b |
| 20 | 1178 | Naphthalene | 0.23 ± 0.14a | 0.23 ± 0.17a |
| 21 | 1188 | α-Terpineol | 2.43 ± 0.84a | 2.16 ± 0.53a |
| 22 | 1190 | Methyl salicylate | 0.99 ± 1.19a | 2.91 ± 0.76a |
| 23 | 1196 | Safranal | 0.29 ± 0.07a | 0.35 ± 0.10a |
| 24 | 1218 | β-Cyclocitral | 0.59 ± 0.20a | 0.66 ± 0.24a |
| 25 | 1228 | Nerol | 0.46 ± 0.15a | 0.77 ± 0.17b |
| 26 | 1256 | Geraniol | 1.58 ± 0.59a | 5.41 ± 1.65b |
| 27 | 1289 | Indole | 0.13 ± 0.22a | 0.53 ± 0.34b |
| 28 | 1300 | Tridecane | 0.17 ± 0.07a | 0.18 ± 0.08a |
| 29 | 1302 | 1-Methyl-naphthalene | 0.40 ± 0.10a | 0.18 ± 0.13b |
| 30 | 1316 | 1,2,3-Trimethoxybenzene | 0.56 ± 0.41a | 0.44 ± 0.25a |
| 31 | 1351 | 2,6-Dimethoxyphenol | 0.15 ± 0.22a | 0.32 ± 0.20a |
| 32 | 1397 | cis-Jasmone | 0.86 ± 0.61a | 1.30 ± 0.56a |
| 33 | 1400 | Tetradecane | 1.48 ± 0.31a | 0.64 ± 0.09b |
| 34 | 1417 | β-Caryophyllene | 1.00 ± 1.57a | 0.39 ± 0.22a |
| 35 | 1428 | α-Ionone | 1.22 ± 0.29a | 0.77 ± 0.18b |
| 36 | 1455 | Geranyl acetone | 2.08 ± 0.42a | 1.96 ± 0.46a |
| 37 | 1487 | β-Ionone | 5.28 ± 1.45a | 3.44 ± 0.64b |
| 38 | 1500 | Pentadecane | 0.84 ± 0.30a | 0.53 ± 0.13a |
| 39 | 1506 | Dibenzofuran | 1.25 ± 0.77a | 0.53 ± 0.09b |
| 40 | 1508 | α-Farnesene | 0.30 ± 0.40a | 1.19 ± 0.87b |
| 41 | 1528 | Dihydroactinidiolide | 6.81 ± 1.53a | 3.80 ± 0.55b |
| 42 | 1554 | Nerolidol | 1.10 ± 0.25a | 1.94 ± 0.69b |
| 43 | 1572 | Fluorene | 1.63 ± 0.70a | 0.88 ± 0.15a |
| 44 | 1598 | Cedrol | 1.18 ± 0.65a | 2.76 ± 0.98b |
| 45 | 1600 | Hexadecane | 1.76 ± 0.62a | 1.10 ± 0.29a |
| 46 | 1653 | α-Cadinol | 1.06 ± 0.19a | 0.83 ± 0.17b |
| 47 | 1659 | 2,2′,5,5′-Tetramethyl-1,1′-biphenyl | 0.70 ± 0.19a | 0.32 ± 0.10a |
| 48 | 1664 | 2-Methyl-hexadecane | 0.50 ± 0.09a | 0.11 ± 0.23a |
| 49 | 1700 | Heptadecane | 0.97 ± 0.30a | 0.82 ± 0.31a |
| 50 | 1706 | 2,6,10,14-Tetramethyl pentadecane | 2.35 ± 0.60a | 1.45 ± 0.79a |
| 51 | 1765 | Anthracene | 0.92 ± 1.17a | 0.50 ± 0.18a |
| 52 | 1800 | Octadecane | 0.69 ± 0.50a | 0.30 ± 0.11a |
| 53 | 1809 | 2,6,10,14-Tetramethyl hexadecane | 0.89 ± 0.33a | 0.64 ± 0.42a |
| 54 | 1828 | Isopropyl myristate | 0.08 ± 0.12a | 0.11 ± 0.12a |
| 55 | 1840 | Caffeine | 9.10 ± 2.82a | 5.07 ± 1.55a |
| 56 | 1846 | Phytone | 4.58 ± 2.08a | 2.31 ± 0.83a |
| 57 | 1918 | Farnesyl acetone | 1.21 ± .32a | 0.26 ± 0.24b |
| 58 | 1927 | Hexadecanoic acid methyl ester | 1.16 ± 0.69a | 0.51 ± 0.34b |
| 59 | 1949 | Isophytol | 0.47 ± 0.19a | 0.35 ± 0.11a |
| 60 | 1975 | Hexadecanoic acid | 1.83 ± 1.79a | 3.75 ± 1.47a |
| 61 | 2093 | Methyl linoleate | 0.26 ± 0.23a | 0.19 ± 0.09a |
| 62 | 2099 | Methyl linolenate | 0.57 ± 0.34a | 0.46 ± 0.28a |
| 63 | 2122 | Phytol | 7.71 ± 4.14a | 6.20 ± 1.93a |
| Alcohols | 29.81a | 50.77b | ||
| Hydrocarbons | 16.89a | 11.05a | ||
| Ketones | 15.31a | 10.18b | ||
| Esters | 3.06a | 4.18a | ||
| Aldehydes | 1.10a | 1.32a | ||
| Nitrogen compounds | 9.23a | 5.60a | ||
| Lactones | 6.81a | 3.80b | ||
| Others | 4.31a | 5.67a | ||
| Identified | 86.52 | 92.57 | ||
a RI retention indices as determined on HP-5MS column using the homologous series of n-alkanes (C8–C40)
bCompounds are listed in order of retention time
cThe content of volatile compounds were represented as mean value ± standard deviation (mean ± SD), same letter in the same row indicates no significant differences (p < 0.05)
The identified volatiles in the Jingmai Pu-erh green teas mainly included caffeine, linalool, phytol, dihydroactinidiolide, β-ionone, phytone, α-terpineol, and 2,6,10,14-tetramethyl pentadecane, while the identified volatiles in the Wuliang Pu-erh green teas mainly included linalool, phytol, geraniol, caffeine, hexadecanoic acid, β-ionone, linalool oxide II, methyl salicylate, cedrol, and phytone. Because these two teas were produced using the same processing technology, it is not surprising that they had similar aroma compositions and contents. However, as seen in Table 4, some aroma components were significantly different between Jingmai and Wuliang Pu-erh green teas, especially some terpene alcohols and ketones, such as linalool and its oxides, hotrienol, nerol, geraniol, nerolidol, α-ionone, β-ionone, phytone, and farnesyl acetone. Volatile terpenoids, which generally have a green, fresh, or citrus-flavored fruit-juice, and a sweet and flowery aroma, are important for the tea’s quality [17, 18]. The sweet and floral aroma of linalool oxides are not from the oxidization of linalool, instead they come from the glycoside forms of linalool oxides in fresh tea leaves [19]. Ketone compounds were mainly biosynthesized by carotenoid. Carotenoid-derived volatile compounds can contribute to the woody fragrance of tea [20]. For example, β-ionone, which has a low odor threshold of 0.007 ppb, is a significant contributor to the flavor of green and black teas, and β-ionone can be produced either by enzymatic reactions during fermentation or by thermal degradation during the green tea manufacturing process [21, 22].
The characteristic volatile components of Pu-erh green teas may result from the different tea mountains and tea genotypes. Jingmai and Wuliang mountains have different environmental and geographical conditions, such as sunlight, rainfall, and soil type. Additionally, their tea trees may be different strains, which could result in different contents of aroma precursors during biosynthesis. Even if Pu-erh green teas have been treated by the same processing technology, the above mentioned factors may still result in differences in their aroma component contents. The biosynthetic pathways of different volatile components and their impact factors will be studied in the future.
Principal component analysis of Jingmai and Wuliang Pu-erh green teas based on volatile components
PCA is an unsupervised statistical method used to investigate the differences between sample groups by the reduction in the dimensions of the principal components [23–25]. PCA is frequently applied as a tool to exploratory data analysis [26]. In this work, PCA was applied to determine whether there were differences in the volatile patterns between Jingmai and Wuliang Pu-erh green teas. The identified volatiles (Table 4) in the 20 Pu-erh green tea samples were manually integrated and their relative percentages were analyzed using PCA. Prior to the runtime analysis of the PCA, the data were preprocessed by par scaling (the variables are centered and divided by the square root of their standard deviation). Figure 3a shows the score plot of the third principal components, PC1, PC2, and PC3, which represent 92.06 % of the total variability. Figure 3b shows the loading scatter plot, which establishes the relative importance of each variable, and it was used to study the relationships among variables and tea samples. As can be seen from Fig. 3a, the 20 Pu-erh tea green tea samples were successfully divided into two groups based on the relationships between the mountains (scores) and their volatile compound contents (loadings). Additionally, samples J2 and J5, and samples W2 and W3, were found in close proximity to each other. Figure 3b indicated that loadings V55 (caffeine), V41 (dihydroactinidiolide), V63 (phytol), V56 (phytone), V37 (β-ionone), V18 (phenylethyl alcohol), V40 (α-farnesene), V27 (indole), and V26 (geraniol) may have more influence on the ability to discriminate between samples from the two tea mountains than other volatile components. Overall, originating from different mountains results in the teas having some differences, while the same processing technology results in similarities among the volatile components.
Fig. 3.
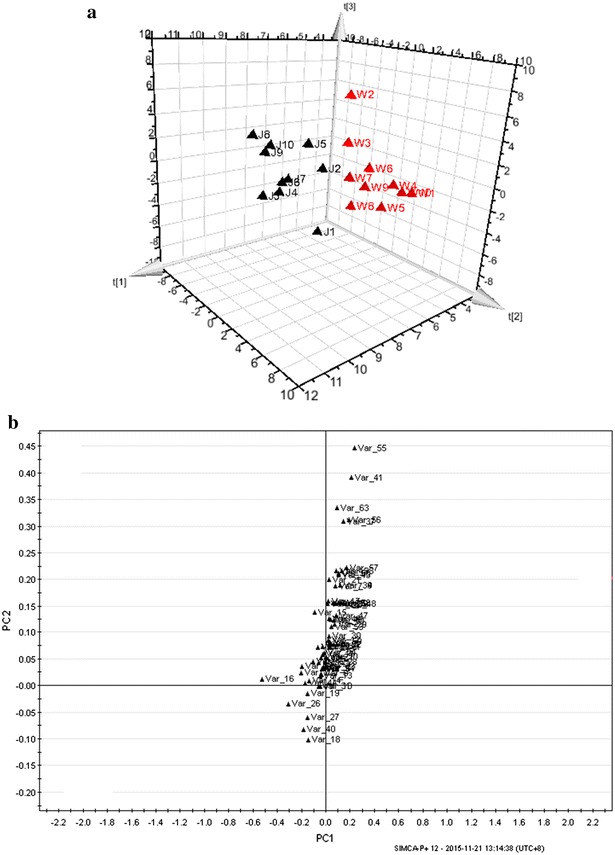
3D PCA score plots (a) and loading (b) plots derived from 63 volatile compounds in the 20 Pu-erh green tea samples
Cluster analysis
Like PCA, CA is also an unsupervised data analysis method that requires no prior knowledge of the test sample. CA is another method that was applied to extract information on the differences among different Pu-erh teas. It finds the dissimilarities among objects in a multidimensional space and divides all of the samples into groups (clusters) based on these dissimilarities [27, 28]. In the present study, all of the percentage quantitative data of the 63 volatile compounds were used in the CA model. The sample similarities were calculated based on the Euclidean distance [29], and Ward’s method was used as the amalgamation rule. The dendrogram result of the CA, indicating that these Pu-erh green tea samples were clustered into two groups, similar to the PCA results, are shown in Fig. 4.
Fig. 4.
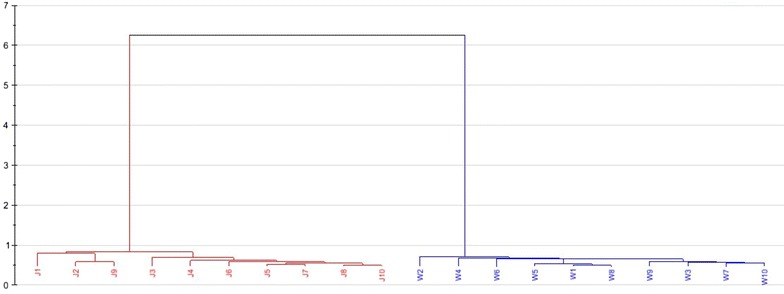
CA analysis based on the 63 volatile compounds of the 20 Pu-erh green tea samples
An attempt has been made to recognize and differentiate Pu-erh green tea samples having different mountains of origin using HS-SPME extraction technique combined with GC-MS and multivariate statistical analyses. Based on the fingerprint similarity and PCA results, Pu-erh green tea samples from Jingmai and Wuliang mountain can be distinguished. This is likely related to different altitudes, climate conditions, geographical environments, ecology factors, tea varieties, cultivation conditions, and exogenous induction factors between these two tea mountains. However, the number of samples analyzed was relatively small, and the data analysis model was limited. To minimize the possibility of false results, future studies should include larger numbers of tea samples and employ more data processing methods. Nevertheless, the developed method can serve as a tool to distinguish between Pu-erh green teas of different origins, and the method can also be applied to other types of tea.
Experimental
Tea samples
Twenty sun-dried Pu-erh green teas, half from Jingmai mountain and half from Wuliang mountain were used in this work. All of these samples were produced in April 2014, and processed using the same technology.
HS-SPME method
The solid-phase extraction coating (65 µm polydimethylsiloxane/divinylbenzene) was provided by Supelco (Bellefonte, PA, USA). The HS-SPME method was verified in our previous study [30]. The ground tea samples (2.0 g) were weighed and placed in 20 mL sealed headspace vials. After adding 4 g potassium chloride and 20 mL water, the vials were tightly sealed with a PTFA septum. The sample vials were equilibrated for 15 min in an 80 °C water bath shaking at 400 rpm, and then a fiber was exposed to the headspace over the sample for 60 min. Finally, the fiber was exposed in the GC injector for 3.5 min.
GC-MS analysis
A 7890A GC-5975C MS system (Agilent Technologies, USA) was used for the separation and identification of tea volatile components. An HP-5MS capillary column (30 m × 0.25 mm × 0.25 µm film thicknesses) was used for the GC separation. Helium was used as the carrier gas at a flow rate of 1 mL min−1. The injector temperature was 250 °C and equipped with a split less injector. The employed temperature program had the following settings: an initial temperature of 50 °C (held for 1 min), increased to 210 °C at 3 °C min−1 (held for 3 min); and then increased to 230 °C at 15 °C min−1. The mass spectrometer was operated in an electron-impact mode of 70 eV. The mass scan range was 35–500 amu. The temperatures of the interface, ion source and quadrupole were 280, 230 and 150 °C, respectively. The solvent delay time was 2.8 min.
Data processing
The volatile compounds were identified by comparing their mass spectra with those of the mass spectra libraries NIST 08 and Wiley 7. Additionally, a series of n-alkanes (C8–C40) were run under the same chromatographic conditions to calculate the RIs of detected compounds by comparing them with the RIs provided by the NIST Chemistry Web Book (http://webbook.nist.gov/chemistry/) and in previous literature [31–36].
The PCA and CA were performed using the SIMCA-P12 package (Umetrics, Umea, Sweden). The algorithms for the PCA and CA were from the SIMCA toolbox and were operated in SIMCA-P12. In addition, the fingerprint similarity analysis was performed using the traditional Chinese medicine fingerprint similarity evaluation system (Version 1.0 for Windows, Central South University, China), which was provided by the Research Center for Modernization of Chinese Medicines of the Central South University. The correlation (R1) and congruence (R2) coefficients between two fingerprints were calculated with median or average data and were then expressed as follows:
| 1 |
| 2 |
″x and y were the median values, the Eq. (2) is the famous cosine measure; it produces exactly the same values as Eq. (1) if the data are centered. Significant differences were determined by t test analyses of independent samples using the SPSS statistical package (version 17.0 for Window, SPSS, Inc., Chicago, USA).
Conclusions
The volatile profiles of Pu-erh green teas from different mountains of origin (Jingmai and Wuliang) were evaluated by combining HS-SPME/GC-MS with multivariate statistical methods. There were some differences between Jingmai and Wuliang Pu-erh green teas, and it was possible to divide these samples into two groups that corresponded to their mountain origin using GC-MS information. Sixty-three volatiles were identified, with alcohols and hydrocarbons being the major aroma components in all 20 tea samples. Some aroma components exhibited significant differences between depending on the tea mountain origin, especially some terpene alcohol compounds and ketones. In conclusion, the combination of the GC-MS analysis with PCA and CA can successfully discriminate between mountain origins of Pu-erh green teas and, therefore, can be further applied to identify and authenticate Pu-erh green teas.
Authors’ contributions
YW, SL, CW, XG, JL performed the experiments; QM designed the study and interpreted the results; SL, YW collected test data and drafted the manuscript. All authors read and approved the final manuscript.
Acknowledgements
This work was supported by the National Natural Science Foundation of China (No. 31460228) and scientific research funds in Yunnan Province department of education (No. 2014Y089).
Competing interests
The authors declare that they have no competing interests.
Additional files
10.1186/s13065-016-0159-y The overlapping plots of the GC-MS fingerprints for 10 Jingmai Pu-erh green tea samples.
10.1186/s13065-016-0159-y The overlapping plots of the GC-MS fingerprints in 10 Wuliang Pu-erh green tea samples.
Footnotes
Yuanshuang Wu and Shidong Lv contributed equally to this work
Contributor Information
Yuanshuang Wu, Email: wyswu@hotmail.com.
Shidong Lv, Email: shidonglv@163.com.
Chen Wang, Email: bingoshinel@yahoo.com.
Xuemei Gao, Email: beyond4amni@163.com.
Jiangbing Li, Email: ljb216970@sina.com.
Qingxiong Meng, Phone: +86-871-65920541, Email: qxmeng@scbg.ac.cn.
References
- 1.Wang D, Meng J, Xu K, Xiao R, Xu M, Liu Y, et al. Evaluation of oral subchronic toxicity of Pu-erh green tea (Camellia sinensis var. Assamica) extract in Sprague Dawley rats. J Ethnopharmacol. 2012;142:836–844. doi: 10.1016/j.jep.2012.06.011. [DOI] [PubMed] [Google Scholar]
- 2.Hou Y, Shao W, Xiao R, Xu K, Ma Z, Johnstone BH, et al. Pu-erh tea aqueous extracts lower atherosclerotic risk factors in a rat hyperlipidemia model. Exp Gerontol. 2009;44:434–439. doi: 10.1016/j.exger.2009.03.007. [DOI] [PubMed] [Google Scholar]
- 3.Kuo KL, Weng MS, Chiang CT, Tsai YJ, Lin-Shiau SY, Lin JK. Comparative studies on the hypolipidemic and growth suppressive effects of oolong, black, Pu-erh, and green tea leaves in rats. J Agric Food Chem. 2004;53:480–489. doi: 10.1021/jf049375k. [DOI] [PubMed] [Google Scholar]
- 4.Ahmed S, Unachukwu U, Stepp JR, Peters CM, Long C, Kennelly E. Pu-erh tea tasting in Yunnan, China: correlation of drinkers’ perceptions to phytochemistry. J Ethnopharmacol. 2010;132:176–185. doi: 10.1016/j.jep.2010.08.016. [DOI] [PubMed] [Google Scholar]
- 5.Li Y, Zhou B, Yang C, Luo L, Guo W, Chai J, et al. Study on establishment of fingerprint map of spring “Shaiqingmao” tea in Jingmai tea area. Acta Agric Jiangxi. 2012;24:153–155. [Google Scholar]
- 6.Sun X, Huang M, Liu B, Li Y, Song W, Ma L, et al. Geographic distribution and morphological diversity of wild tea germplasms from Yunnan. Chinese Agric Sci Bull. 2012;28:277–288. [Google Scholar]
- 7.Yu H, Wang Y, Wang J. Identification of tea storage times by linear discrimination analysis and back-propagation neural network techniques based on the eigenvalues of principal components analysis of e-nose sensor signals. Sensors. 2009;9:8073–8082. doi: 10.3390/s91008073. [DOI] [PMC free article] [PubMed] [Google Scholar]
- 8.Song S, Zhang X, Hayat K, Xiao Z, Niu Y, Eric K. Coordinating fingerprint determination of solid-phase microextraction/gas chromatography-mass spectrometry and chemometric methods for quality control of oxidized tallow. J Chromatogr A. 2013;1278:145–152. doi: 10.1016/j.chroma.2012.12.062. [DOI] [PubMed] [Google Scholar]
- 9.Wang Y, Li Q, Wang Q, Li Y, Ling J, Liu L, et al. Simultaneous determination of seven bioactive components in Oolong tea Camellia sinensis: quality control by chemical composition and HPLC fingerprints. J Agric Food Chem. 2012;60:256–260. doi: 10.1021/jf204312w. [DOI] [PubMed] [Google Scholar]
- 10.He X, Li J, Zhao W, Liu R, Zhang L, Kong X. Chemical fingerprint analysis for quality control and identification of Ziyang green tea by HPLC. Food Chem. 2015;171:405–411. doi: 10.1016/j.foodchem.2014.09.026. [DOI] [PubMed] [Google Scholar]
- 11.Lv SD, Wu YS, Song YZ, Zhou JS, Lian M, Wang C, et al. Multivariate analysis based on GC-MS fingerprint and volatile composition for the quality evaluation of Pu-erh green tea. Food Anal Methods. 2015;8:321–333. doi: 10.1007/s12161-014-9900-0. [DOI] [Google Scholar]
- 12.Zhang R, Chen J, Shi Q, Li Z, Peng Z, Zheng L, et al. Quality control method for commercially available wild jujube leaf tea based on HPLC characteristic fingerprint analysis of flavonoid compounds. J Sep Sci. 2014;37:45–52. doi: 10.1002/jssc.201300841. [DOI] [PubMed] [Google Scholar]
- 13.Zhao Y, Chen P, Lin L, Harnly J, Yu L, Li Z. Tentative identification, quantitation, and principal component analysis of green Pu-erh, green, and white teas using UPLC/DAD/MS. Food Chem. 2011;126:1269–1277. doi: 10.1016/j.foodchem.2010.11.055. [DOI] [PMC free article] [PubMed] [Google Scholar]
- 14.Jin Y, Liang T, Fu Q, Xiao YS, Feng JT, Ke YX. Fingerprint analysis of Ligusticum Chuanxiong using hydrophilic interaction chromatography and reversed-phase liquid chromatography. J Chromatogr A. 2009;1216:2136–2141. doi: 10.1016/j.chroma.2008.04.010. [DOI] [PubMed] [Google Scholar]
- 15.Sun X, Wang H, Han X, Chen S, Zhu S, Dai J. Fingerprint analysis of polysaccharides from different Ganoderma by HPLC combined with chemometrics methods. Carbohyd Polym. 2014;114:432–439. doi: 10.1016/j.carbpol.2014.08.048. [DOI] [PubMed] [Google Scholar]
- 16.Viaene J, Goodarzi M, Dejaegher B, Tistaert C, Hoang Le Tuan A, Nguyen Hoai N, et al. Discrimination and classification techniques applied on Mallotus and Phyllanthus high performance liquid chromatography fingerprints. Anal Chim Acta. 2015;877:41–50. doi: 10.1016/j.aca.2015.02.034. [DOI] [PubMed] [Google Scholar]
- 17.Yang Z, Baldermann S, Watanabe N. Recent studies of the volatile compounds in tea. Food Res Int. 2013;53:585–599. doi: 10.1016/j.foodres.2013.02.011. [DOI] [Google Scholar]
- 18.Kaminaga Y, Schnepp J, Peel G, Kish CM, Ben-Nissan G, Weiss D, et al. Plant phenylacetaldehyde synthase is a bifunctional homotetrameric enzyme that catalyzes phenylalanine decarboxylation and oxidation. J Biol Chem. 2006;281:23357–23366. doi: 10.1074/jbc.M602708200. [DOI] [PubMed] [Google Scholar]
- 19.Wang D, Yoshimura T, Kubota K, Kobayashi A. Analysis of glycosidically bound aroma precursors in tea leaves: qualitative and quantitative analyses of glycosides with aglycons as aroma compounds. J Agric Food Chem. 2000;48:5411–5418. doi: 10.1021/jf000443m. [DOI] [PubMed] [Google Scholar]
- 20.Ho CT, Zheng X, Li S. Tea aroma formation. Food Sci Human Wellness. 2015;4:9–27. doi: 10.1016/j.fshw.2015.04.001. [DOI] [Google Scholar]
- 21.Schuh C, Schieberle P. Characterization of the key aroma compounds in the beverage prepared from Darjeeling black tea: quantitative differences between tea leaves and infusion. J Agric Food Chem. 2006;54:916–924. doi: 10.1021/jf052495n. [DOI] [PubMed] [Google Scholar]
- 22.Kanasawud P, Crouzet JC. Mechanism of formation of volatile compounds by thermal degradation of carotenoids in aqueous medium. II: beta-carotene degradation. J Agric Food Chem. 1990;38:237–243. doi: 10.1021/jf00091a052. [DOI] [Google Scholar]
- 23.Mazina J, Vaher M, Kuhtinskaja M, Poryvkina L, Kaljurand M. Fluorescence, electrophoretic and chromatographic fingerprints of herbal medicines and their comparative chemometric analysis. Talanta. 2015;139:233–246. doi: 10.1016/j.talanta.2015.02.050. [DOI] [PubMed] [Google Scholar]
- 24.Wu SB, Meyer RS, Whitaker BD, Litt A, Kennelly EJ. A new liquid chromatography-mass spectrometry-based strategy to integrate chemistry, morphology, and evolution of eggplant (Solanum) species. J Chromatogr A. 2013;1314:154–172. doi: 10.1016/j.chroma.2013.09.017. [DOI] [PubMed] [Google Scholar]
- 25.Wu SB, Wu J, Yin Z, Zhang J, Long C, Kennelly EJ, et al. Bioactive and marker compounds from two edible dark-colored Myrciaria fruits and the synthesis of jaboticabin. J Agric Food Chem. 2013;61:4035–4043. doi: 10.1021/jf400487g. [DOI] [PubMed] [Google Scholar]
- 26.Kovács Z, Dalmadi I, Lukács L, Spies L, Szántai-Kőhegyi K, Kókai Z, et al. Geographical origin identification of pure Sri Lanka tea infusions with electronic nose, electronic tongue and sensory profile analysis. J Cheminform. 2010;2:121–130. [Google Scholar]
- 27.Morlock GE, Ristivojevic P, Chernetsova ES. Combined multivariate data analysis of high-performance thin-layer chromatography fingerprints and direct analysis in real time mass spectra for profiling of natural products like propolis. J Chromatogr A. 2014;1328:104–112. doi: 10.1016/j.chroma.2013.12.053. [DOI] [PubMed] [Google Scholar]
- 28.Sârbu C, Naşcu-Briciu RD, Kot-Wasik A, Gorinstein S, Wasik A, Namieśnik J. Classification and fingerprinting of kiwi and pomelo fruits by multivariate analysis of chromatographic and spectroscopic data. Food Chem. 2012;130:994–1002. doi: 10.1016/j.foodchem.2011.07.120. [DOI] [Google Scholar]
- 29.Bajusz D, Rácz A, Héberger K. Why is Tanimoto index an appropriate choice for fingerprint-based similarity calculations? J Cheminform. 2015;7:20. doi: 10.1186/s13321-015-0069-3. [DOI] [PMC free article] [PubMed] [Google Scholar]
- 30.Lv S, Wu Y, Li C, Xu Y, Liu L, Meng Q. Comparative analysis of Pu-erh and Fuzhuan teas by fully automatic headspace solid-phase micro extraction coupled with gas chromatography-mass spectrometry and chemometric methods. J Agric Food Chem. 2014;62:1810–1818. doi: 10.1021/jf405237u. [DOI] [PubMed] [Google Scholar]
- 31.Bilia A, Flamini G, Taglioli V, Morelli I, Vincieri F. GC-MS analysis of essential oil of some commercial fennel teas. Food Chem. 2002;76:307–310. doi: 10.1016/S0308-8146(01)00277-1. [DOI] [Google Scholar]
- 32.Lin J, Dai Y, Guo Y, Xu H, Wang X. Volatile profile analysis and quality prediction of Longjing tea (Camellia sinensis) by HS-SPME/GC-MS. J Zhejiang Univ Sci B. 2012;13:972–980. doi: 10.1631/jzus.B1200086. [DOI] [PMC free article] [PubMed] [Google Scholar]
- 33.Lv HP, Zhong QS, Lin Z, Wang L, Tan JF, Guo L. Aroma characterisation of Pu-erh tea using headspace-solid phase micro extraction combined with GC/MS and GC-olfactometry. Food Chem. 2012;130:1074–1081. doi: 10.1016/j.foodchem.2011.07.135. [DOI] [Google Scholar]
- 34.Msaada K, Hosni K, Taarit MB, Chahed T, Kchouk ME, Marzouk B. Changes on essential oil composition of coriander (Coriandrum sativum l.) fruits during three stages of maturity. Food Chem. 2007;102:1131–1134. doi: 10.1016/j.foodchem.2006.06.046. [DOI] [Google Scholar]
- 35.Qiao Y, Xie BJ, Zhang Y, Zhang Y, Fan G, Yao XL, et al. Characterization of aroma active compounds in fruit juice and peel oil of jinchen sweet orange fruit (Citrus sinensis (L.) Osbeck) by GC-MS and GC-O. Molecules. 2008;13:1333–1344. doi: 10.3390/molecules13061333. [DOI] [PMC free article] [PubMed] [Google Scholar]
- 36.Lv S, Wu Y, Wei J, Lian M, Wang C, Gao X, et al. Application of gas chromatography-mass spectrometry and chemometrics methods for assessing volatile profiles of Pu-erh tea with different processing methods and ageing years. RSC Adv. 2015;5:87806–87817. doi: 10.1039/C5RA15381F. [DOI] [Google Scholar]