

Abstract
The contemporary distribution of biological diversity cannot be understood without knowledge of how organisms responded to the geological and climatic history of Earth. In particular, Quaternary expansions and contractions of glacial ice sheets are thought to have played an important role in shaping the distribution of biodiversity among current populations in the north-temperate region. In the central U.S., fossil and palynological data provide support for the maintenance of a large southeastern refuge during the last glacial maximum, and many temperate organisms are believed to have responded to glacial expansion by shifting their ranges to southern refugia and recolonizing northward to track the receding ice sheets. Thus, organisms are assumed to track favorable climates, and species ranges are expected to have shifted significantly. Here we present data from a deciduous forest vertebrate, the eastern chipmunk (Tamias striatus) in the central U.S., indicating the maintenance of multiple refugial sources as well as a southward expansion from a northern refugium. These results challenge the view that, during glacial maxima, organisms must have migrated south out of their ranges to track favorable climates.
Phylogeographic patterns from contemporary genetic samples have proven highly informative in recovering the demographic histories of species in glaciated landscapes (1–4). Phylogeographic principles have been applied to many European organisms uncovering characteristically lower genetic variation in northern populations and providing evidence of range expansions from multiple southern refugia (5, 6). In North America, some studies have uncovered reduced levels of genetic variation in northern populations supporting expansions from southern refugia (7–9). However, phylogeographic surveys of the central U.S. are incomplete, and recolonization scenarios have not been adequately tested (10, 11).
Several lines of evidence are emerging that suggest organisms may not have consistently recolonized glaciated landscapes from southern refugia. In Europe, trace amounts of pollen, charcoal, and macrofossils from thermophilous plants as well as fossils of temperate mammals have been recovered from glacial age sediments far north of their predicted distributions in southern refugia (12). Although these findings are often attributed to long-distance dispersal or stratigraphic mixing of fossils, the presence of northern refugia would help explain both postglacial colonizations that appear to exceed migration rates (Reid's Paradox, ref. 13) and nonanalogue assemblages of tundra and deciduous forest species that have been recovered throughout glaciated landscapes (14).
In the central U.S., geological evidence indicates that during the last glacial maximum, an extensive area remained free of ice despite the expansion of the Laurentide ice sheet much farther to the south (Fig. 1; ref. 15). This “driftless region” traditionally was predicted to consist of tundra or taiga-like vegetation during the last glacial maximum (16). However, recent data suggest that deciduous forests may have persisted in this region. Modern palynological techniques have uncovered trace amounts of deciduous tree pollen such as Quercus in the driftless region, suggesting the possible persistence of small stands of trees during the last glacial maximum (17). Furthermore, divergent chloroplast DNA sequences from extant populations of several deciduous forest trees near the southern limit of the Laurentide ice sheet indicate the maintenance of separate lineages that may have persisted closer to the ice sheets than previously expected (18). Together, these data raise the intriguing possibility that populations of some deciduous forest-dependent vertebrates persisted north of the southern extent of the Laurentide ice sheet at its last maximum.
Fig. 1.

Frequency of haplotypes from the western clade (white, red, green, and yellow) and the eastern clades (blue) in each sampling site (same as Fig. 4). The black shading indicates the location of the driftless region during the Illinoian glacial maximum. The dashed line indicates the extent of the Laurentide ice sheet during the Wisconsin glaciation. Haplotypes from the eastern clades are restricted to southern and eastern sites with a sharp increase in frequency in the three easternmost sites. Ancestral western clade haplotypes IL-NW and WI-NW (yellow) are found only in northwestern sites. All western clade haplotypes found in southernmost populations (red) are derived from haplotype IL-C (green) that was derived from the ancestral haplotypes.
We present geographic variation from the mtDNA control region of eastern chipmunks, Tamias striatus, distributed across the central U.S., which are informative of the expansion of populations into this region since the last glacial maximum. The fossil record of T. striatus in the central U.S. demonstrates that T. striatus have had a continuous but dynamic presence in the region (14, 19). Fossils of T. striatus dated to the last glacial cycle have been recovered from southeastern sites as well as far west of their current range, indicating that they may have persisted in multiple glacial refugia. However, the location of particular refugia is not discernible from the fossil record. T. striatus fossils from the late Pleistocene also have been recovered with fossils of species characteristic of boreal forests, suggesting that T. striatus could have survived in regions of cooler climate than those in which they exist today. These data suggest that T. striatus may have persisted in a complex set of glacial refugia, and that they colonized glaciated regions of the central U.S. from areas other than the south. We present mtDNA evidence that populations of T. striatus in the central U.S. expanded south from a northern refuge.
Methods
Sampling. A total of 244 T. striatus were collected from 25 sites across Wisconsin, Illinois, Indiana, and Michigan (Fig. 1 and Table 4, which is published as supporting information on the PNAS web site). Animals were trapped in Sherman live traps (7 × 8.5 × 22.5 cm) and released on site. A small (3 × 10-mm) piece of tissue was cut from the pinna by using cuticle scissors. Tissue was stored in 90% ethanol and placed on dry ice until storage at –20°C.
Laboratory Techniques. DNA was extracted by using DNeasy Tissue Kits (Qiagen, Chatsworth, CA). We amplified the entire control region plus the Pro tRNA for all 244 individuals. Primers were located in Phe tRNA (5′ CATTTCCAGTGCTTTGCTTT 3′) and Thr tRNA (5′ ATTACTCTGGTCTTGTAAACC 3′) that flank the control region. Primers were designed by using the program primer from published sequences of 12sRNA (20) and cytochrome b (21). Resultant sequences were compared to sequences on the National Center for Biotechnology Information GenBank database by using blastn to confirm that the primers amplified mitochondrial control region DNA. PCR were run in a total volume of 25 μl by using standard conditions. PCR products were purified by using QIAquick PCR purification kits (Qiagen). Sequencing reactions were carried out in a volume of 20 μl by using the BigDye Terminator Cycle Sequencing Ready Reaction Kit version III (Applied Biosystems) under standard conditions. Sequence products were run on an ABI 3730 (Applied Biosystems) automated sequencer. Sequences were aligned by using sequencher 3.0 (Gene Codes, Ann Arbor, MI). Ambiguous base pairs were removed from the beginning and end of the sequences.
Phylogenetic Analyses. Evolutionary relationships among haplotypes were estimated by constructing phylogenetic trees by using Bayesian, parsimony, and distance methods. A HKY85 + I + Γ model of substitution was determined by hierarchical likelihood ratio tests with modeltest 3.06 (22). Bayesian analyses were conducted with mrbayes 3.0B4 (23). The likelihood model was run with default settings, except the number of substitution types (Nst) was set to 2 (allows transitions and transversions to differ), and 100,000 generations were run. Parsimony and distance trees were estimated by using paup 4.0b10 (24) with 100 bootstrap replicates, nearest neighbor interchange branch swapping, and gaps treated as a fifth state. Distance trees were constructed with 1,000 bootstrap replicates, neighbor-joining search, and HKY85 distance correction.
Molecular diversity for each clade was calculated by using arlequin 2.0 (25) with a Tamura and Nei distance method, allowing for different transversion and transition rates. A Γ correction of 0.7057 was used as estimated by modeltest 3.06.
Pairwise Comparisons and Estimating Time of Expansion. Mismatch distributions of pairwise differences among all haplotypes were calculated by using arlequin 2.0 and a Tamura and Nei distance method. The mode of the first peak was estimated in arlequin 2.0 by running only western clade haplotypes. The mode of the second peak was estimated from Fig. 3. The time of population expansion was calculated from the modes of the two peaks. As a rough estimate of divergence time based on control region sequences, we used molecular clock estimates of 15% sequence divergence per million years as previously applied to cytochrome b third codon positions (26–29).
Fig. 3.

Mismatch distribution of pairwise comparisons of all haplotypes. Expected frequencies of pairwise differences between haplotypes under a step-wise expansion model are indicated by ○. Observed frequencies of pairwise differences between haplotypes are indicated by ♦. Modes indicate that most haplotypes coalesce to a narrow time interval that represents the time of expansion. The first mode is generated by comparisons of haplotypes from the western clade (mean 0.62% divergence). The second mode is generated by comparison of haplotypes from the multiple divergent clades (mean 3.2% divergence). Thus, the expansion of the western clade is restricted to a recent time interval on the order of tens of thousands of years, and the divergence of the western and eastern clades is also restricted to a narrow time interval on the order of 200,000 years.
Molecular Diversity Estimation. In recolonizing glaciated landscapes, most species are expected to exhibit leading-edge leptokurtic dispersal, whereby rare long-distance colonizers contribute most significantly to genetic variation, and migrants between established populations are expected to contribute negligibly (30). Traditional expectations are that as populations expand in this fashion, genetic variation is lost, and the origins of range expansions are in the direction of higher diversity and heterozygosity (31). Standard molecular diversity indices were calculated for the western clade by using arlequin 2.0 to test whether populations have expanded from south to north as expected. Gene diversity is defined as the probability that two randomly chosen haplotypes are different in the sample. Pairwise differences are the mean number of base-pair differences between all pairs of haplotypes in the sample. Nucleotide diversity is the probability that two randomly chosen homologous nucleotides are different. Haplotype diversity was calculated by dividing the number of haplotypes recovered from a population by the number of samples from that population. Molecular diversity indices were plotted against latitude by using excel Ver. X (Microsoft). Regressions were calculated in systat 5.2.1 (Systat, Point Richmond, CA) with molecular diversity as the dependent variable and latitude as the independent variable. These indices were used to test the expectation that, if range expansions are from south to north, then genetic diversity should be greater in the southern populations sampled.
Haplotype Networks. A haplotype network was constructed by using tcs 1.13 (32). This program uses statistical parsimony to connect haplotypes based on a 95% confidence interval. Haplotypes separated from other haplotypes by >14 mutational steps could not be connected to the network with 95% confidence. All haplotypes from the eastern clade were >14 mutational steps away from all haplotypes in the western clade. Thus, the network contains only western clade haplotypes.
To calculate how derived populations were on average, the number of mutational steps each haplotype is from the ancestral haplotypes was counted. Ancestral haplotypes are identifiable by their internal position in the network, by the number of lineages that arise from them, and by their commonness (33). Tip clades that are connected to the remainder of the network by only one connecting branch are considered derived. A weighted average number of mutational steps away from the ancestral haplotypes per population was calculated for each population by multiplying the number of mutational steps for each haplotype found in the population by the number of individuals in the population with that haplotype, summing the haplotypes together, and dividing by the total population size. The weighted average number of mutational steps per population was plotted against latitude by using excel Ver. X. Regressions were calculated in systat 5.2.1, with mutational steps as the dependent variable and latitude as the independent variable.
Results and Discussion
Phylogenetic Analyses. Sequencing recovered 964 unambiguous base pairs for 244 T. striatus samples, uncovering 95 unique haplotypes. Estimates from phylogenetic trees of the evolutionary relationships among these haplotypes recovered multiple divergent clades. Seventy-eight haplotypes are recovered from a widely distributed western clade (Fig. 2) that is marked by shallow sequence divergence (0.0071 mean within-clade divergence) with no bootstrap support for relationships along the backbone. This star-like phylogeny contains haplotypes recovered from populations distributed from northern Wisconsin to southern Illinois, Indiana, and southern Michigan (Fig. 1). The remaining 17 haplotypes are recovered from multiple southern and eastern clades (eastern). The haplotypes in the eastern clades were recovered from populations from northern Michigan through Indiana and eastern Illinois to southern Illinois (Fig. 1). These clades, although not as thoroughly sampled as the western clade, demonstrate that the western clade is a geographically localized and monophyletic lineage, indicating that ancestors of T. striatus from the western clade have been isolated in the past from the ancestors of the eastern clades. Divergence among all clades is much deeper than within the western clade (0.0206 mean among-clade divergence), with strong bootstrap support for all clades (Fig. 2). The deep branch lengths among clades demonstrate that the lack of differentiation among haplotypes within the western clade is not inherent to mtDNA from the control region of T. striatus. Together, these data indicate that T. striatus from the western clade are descended from a population that has recently expanded out of a small glacial refugium.
Fig. 2.

Bayesian consensus tree for mtDNA control region sequence data. Values above the branches are Bayesian consensus values. Parentheses indicate additional sites where a haplotype was recovered. Western clade haplotypes (white bar) form a classic star-like topology with most haplotypes coalescing along the backbone of the clade. Haplotypes from the eastern clades (black bar) do not form a star-like topology and are both deeply divergent from all western clade haplotypes as well as divergent from each other. This tree is unrooted and is drawn with the eastern clades as basal to illustrate the monophyly of the western clade. The tree could also be drawn with the western clade as basal.
Pairwise Comparison. Pairwise comparison of all haplotypes produces a bimodal distribution consistent with two past population expansions (ref. 33; Fig. 3). The first mode is produced by pairwise comparison of haplotypes in the western clade with a mean of 6.02 pairwise differences (0.62% divergence). This indicates that a population expansion occurred <50,000 years ago (26–29), consistent with an effect of the Wisconsin glacial cycle (79,000–18,000 years ago maximum; ref. 15). The second mode, at ≈32.5 pairwise differences (≈3.2% divergence), is produced by comparison of haplotypes from the divergent clades, indicating a population expansion on the order of 200,000 years ago. This is consistent with a shared ancestry of the multiple clades in the Illinoian glacial cycle (300,000–130,000 years ago; ref. 15). Thus, the distribution of pairwise haplotype comparisons indicates that during the Wisconsin T. striatus from the western clade may have survived in a separate refugium, whereas during the Illinoian, they may have expanded from the same source as the other clades.
Population Genetic Analyses. Rapid range expansions out of refugia involving serial population bottlenecks during founder events are expected to exhibit decreasing genetic diversity as sampling moves away from the source, particularly in allele or haplotype number (30, 31). If T. striatus from the western clade expanded from south to north, genetic diversity should be greater in the southern populations sampled. No significant relationships were uncovered among any of the genetic diversity indices (mean pairwise differences, gene diversity, and nucleotide diversity) and latitude (R2 = 0.0003, 0.0989, and 0.0003 respectively; all P > 0.10) across the range of the western clade. However, a significant positive relationship between latitude and haplotype diversity was recovered (R2 = 0.29, P = 0.015, slope = 0.045). Thus, contrary to expectations for a northward expansion out of a southern refugium, genetic diversity is not higher in southern populations, and we recover evidence for higher haplotype numbers in northern populations.
The hypothesis of a north-to-south expansion was tested further by comparing the geographic location of ancestral and derived haplotypes. The exponential growth of newly founded populations would lead to weak genetic drift and an increased survival of neutral lineages (35). Thus range expansion, including both bottlenecks and exponential population growth, may allow the replacement of ancestral haplotypes with novel derived haplotypes, especially at loci with high mutation rates such as the mtDNA control region (36). If ancestral and derived haplotypes do not overlap and are located in different geographic areas, then ancestral haplotypes should be found close to the origin of range expansion, whereas derived haplotypes are more likely to be found at the leading edge of the range expansion.
Haplotype networks allow inference of ancestral (internal) versus derived (tip) relationships among haplotypes. The haplotype network clearly indicates Illinois–northwest (IL-NW) to be the most ancestral (Fig. 4, in yellow). IL-NW is the most internal and the most common haplotype and gives rise to 11 independent clades. A second haplotype [Wisconsin–northwest (WI-NW)], just one mutational step away from IL-NW, is also internal and ancestral to five independent clades (Fig. 4). Furthermore, if IL-NW and WI-NW are removed from the analysis, no other haplotype takes a central internal position, and the network is without clear ancestral haplotypes. IL-NW and WI-NW are found in three populations in northwestern Illinois and one population in northwestern Wisconsin (IL-1, IL-4, IL-7, and WI-1; Fig. 1).
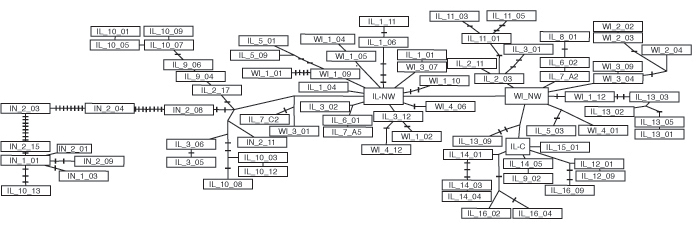
Fig. 4.

Western clade haplotype network reduced to indicate major clades (see Fig. 5, which is published as supporting information on the PNAS web site, for the complete network and Table 2, which is published as supporting information on the PNAS web site, for a description of the membership of each clade). Clades containing multiple haplotypes are indicated by circles, and haplotypes are indicated by rectangles. Branch lengths are drawn to scale of the total number of mutational steps in each clade, except the single mutational step between IL-NW and WI-NW and the abbreviated branch to clade VIIB. Colors correspond to frequencies in Fig. 1. IL-NW and WI-NW are ancestral haplotypes (yellow). They are both internal and give rise to 11 and 6 clades, respectively, and IL-NW is the most common haplotype. All western clade haplotypes from the four southern sites (red) are monophyletic and derived from a single common haplotype IL-C (green), indicating that these populations are derived.
In sharp contrast, the haplotypes found in four of the southernmost populations sampled (IL-12, -14, -15, and -16) are localized to one clade (clade XV, in red) and are all derived from a single haplotype, Illinois–central (IL-C, in green), found in two populations just to the north (IL-11 and -13). The IL-C haplotype, although ancestral to all of the haplotypes in the southernmost populations, is derived from ancestral haplotype WI-NW. Haplotypes thus appear to become increasingly derived from north to south. The average number of mutational steps away from the ancestral haplotype (IL-NW) per population is negatively related to latitude across Illinois and Wisconsin (Fig. 6 A, which is published as supporting information on the PNAS web site; R2 = 0.25, P = 0.008). To confirm that this relationship is not just a distance effect, we also treated haplotypes in IL-16 (our southernmost site) as the ancestral haplotypes and plotted the average number of mutational steps per population away from the IL-16 haplotypes against latitude. When IL-16 is treated as containing the ancestral haplotypes, no significant relationship is found between latitude and average number of mutational steps (Fig. 6B, R2 = 0.04, P = 0.46). In other words, haplotypes become increasingly divergent from those in northern populations southward but not from those in southern populations northward. The most parsimonious explanation is that populations containing ancestral haplotypes would give rise to populations containing derived haplotypes, suggesting that Illinois was recolonized from north to south. Forcing the data from T. striatus to fit a south-to-north recolonization would require that all ancestral haplotypes in all source populations were lost, and ancestral haplotypes were maintained only in derived populations.
The phylogeographic analyses presented herein indicate that T. striatus populations in parts of Wisconsin and Illinois have recently expanded from a northern refugium near the Laurentide ice sheet in the upper central U.S. This finding is consistent with recent discoveries supporting the possible persistence of deciduous forest trees in this region during the last glacial maximum (17, 18). These data suggest that some populations of deciduous forest vertebrates may have tolerated the climatic changes of glacial advance in cryptic northern refugia rather than migrating south to track favorable climates. The presence of northern refugia in glacial landscapes would have important implications for resolving postglacial colonizations that appear to exceed migration rates and the assemblage of nonanalogue communities. These analyses also recovered cryptic geographically partitioned deep structure among mtDNA lineages of T. striatus, suggesting that multiple isolated refugia provided the source of postglacial colonists to the central U.S. Thus, these data demonstrate that the demographic histories of species in glaciated landscapes are often more complex and variable than one would intuitively expect.
Supplementary Material
Acknowledgments
We thank Susannah French for assistance with field work, Kelly and Erin Cushing for assistance with lab work, Dr. Andrew Suarez for critical comments, the many landowners and state land managers who allowed collection of tissue samples from their properties, and the Center for Wildlife Ecology at the Illinois Natural History Survey for support of this research. This project was funded by grants to K.C.R. from the American Museum of Natural History and the American Society of Mammalogists. Additional support was also provided by National Science Foundation Grant NSF-DEB00-92554 (to K.N.P.). K.C.R. is supported by a National Science Foundation Predoctoral Fellowship.
This paper was submitted directly (Track II) to the PNAS office.
Abbreviations: IL-NW, Illinois–northwest; WI-NW, Wisconsin–northwest.
Data deposition: The sequences reported in this paper have been deposited in the GenBank database (accession nos. AY557233–AY557328).
References
- 1.Lessa, E. P., Cook, J. A. & Patton, J. L. (2003) Proc. Natl. Acad. Sci. USA 100, 10331–10334. [DOI] [PMC free article] [PubMed] [Google Scholar]
- 2.Avise, J. C. (2000) in Phylogeography: The History and Formation of Species (Harvard Univ. Press, Cambridge, MA), pp. 135–147.
- 3.Templeton, A. R., Routman, E. R. & Phillips, C. A. (1995) Genetics 140, 767–782. [DOI] [PMC free article] [PubMed] [Google Scholar]
- 4.Hewitt, G. M. (2000) Nature 405, 907–913. [DOI] [PubMed] [Google Scholar]
- 5.Taberlet, P., Fumagalli, L., Wust-Saucy, A. & Cosson, J. (1998) Mol. Ecol. 7, 453–464. [DOI] [PubMed] [Google Scholar]
- 6.Hewitt, G. M. (1999) Biol. J. Linn. Soc. 68, 87–112. [Google Scholar]
- 7.Sage, R. D. & Wolff, J. O. (1986) Evolution (Lawrence, Kans.) 40, 1092–1095. [DOI] [PubMed] [Google Scholar]
- 8.Hayes, J. P. & Harrison, R. G. (1992) Syst. Biol. 41, 331–344. [Google Scholar]
- 9.Merilä, J. M., Bjorkland, M. & Baker, A. J. (1997) Evolution (Lawrence, Kans.) 51, 946–956. [DOI] [PubMed] [Google Scholar]
- 10.Zamudio, K. R. & Savage, W. K. (2003) Evolution (Lawrence, Kans.) 57, 1631–1652. [DOI] [PubMed] [Google Scholar]
- 11.Burbrink, F. T., Lawson, R. & Slowinski, J. B. (2000) Evolution (Lawrence, Kans.) 54, 2107–2118. [DOI] [PubMed] [Google Scholar]
- 12.Stewart, J. R. & Lister, A. M. (2001) TREE 16, 608–613. [Google Scholar]
- 13.Clark, J. S., Fastie, S., Hurtt, G., Jackson, S. T., Johnson, C., King, G. A., Lewis, M., Lynch, J., Pacala, S., Prentice, C., et al. (1998) BioScience 48, 13–24. [Google Scholar]
- 14.Graham, R.W., Ernest, L. L., Jr., Graham, M. A., Schroeder, E. K., Toomey, R. S., III, Anderson, E., Barnosky, A. D., Burns, J. A., Churcher, C. S., Grayson, D. K., et al. (1996) Science 272, 1601–1605. [DOI] [PubMed] [Google Scholar]
- 15.Holliday, V. T., Knox, J. C., Running, G. L., IV, Mandel, R. D. & Ferring, C. R. (2002) in The Physical Geography of North America, ed. Orme, A. R. (Oxford Univ. Press, Oxford, U.K.), pp. 335–362.
- 16.Delcourt, P. A. & Delcourt, H. R. (1981) in Geobotany II, ed. Romans, R. C. (Plenum, New York), pp. 123–166.
- 17.Jackson, S. A., Webb, R. S., Anderson, K. H., Overpeck, J. T., Webb, T., III, Williams, J. W. & Hansen, B. C. S. (2000) Q. Sci. Rev. 19, 489–508. [Google Scholar]
- 18.McLachlan, J. S. (2003) Ph.D thesis (Duke University, Durham, NC).
- 19.Purdue, J. R. & Styles, B. W. (1986) Ill. State Mus. Rep. Invest. 41, 1–63. [Google Scholar]
- 20.Springer, M. S., Hollar, L. J. & Burk, A. (1995) Mol. Biol. Evol. 12, 1138–1150. [DOI] [PubMed] [Google Scholar]
- 21.Piaggio, A. J. & Spicer, G. S. (2001) Mol. Phylogenet. Evol. 20, 335–350. [DOI] [PubMed] [Google Scholar]
- 22.Posada, D. & Crandall, K. A. (1998) Bioinformatics 14, 817–818. [DOI] [PubMed] [Google Scholar]
- 23.Huelsenbeck, J. P & Ronquist, F. (2001) Bioinformatics 17, 754–755. [DOI] [PubMed] [Google Scholar]
- 24.Swofford, D. L. (2002) paup*, Phylogenetic Analysis Using Parsimony (*and Other Methods) (Sinauer, Sunderland, MA), Ver. 4.
- 25.Schneider, S., Roseli, D. & Excoffier, L. (2000) arlequin: A Software for Population Genetic Analysis (Genetics and Biometry Laboratory, Univ. of Geneva, Geneva), Ver. 2.000.
- 26.Li, W. H., Gouy, M., Sharp, P. M., O'hUigin, C. & Yang, Y. W. (1990) Proc. Natl. Acad. Sci. USA 87, 6703–6707. [DOI] [PMC free article] [PubMed] [Google Scholar]
- 27.Matocq, M. D. (2002) Mol. Ecol. 11, 229–242. [DOI] [PubMed] [Google Scholar]
- 28.Irwin, D., Kocher, T. D. & Wilson, A. C. (1991) J. Mol. Evol. 32, 128–144. [DOI] [PubMed] [Google Scholar]
- 29.Pesole, G., Gissi, C., De Chirico, A. & Saccone, C. (1999) J. Mol. Evol. 48, 427–434. [DOI] [PubMed] [Google Scholar]
- 30.Hewitt, G. M. (1996) Biol. J. Linn. Soc. 58, 247–276. [Google Scholar]
- 31.Ibrahim, K. M., Nichols, R. A. & Hewitt, G. M. (1996) Heredity 77, 282–291. [Google Scholar]
- 32.Clement, M., Posada, D. & Crandall, K.A. (2000) Mol. Ecol. 9, 1657–1660. [DOI] [PubMed] [Google Scholar]
- 33.Castelloe, J. & Templeton, A. R. (1994) Mol. Phyloget. Evol. 3, 102–113. [DOI] [PubMed] [Google Scholar]
- 34.Rogers, A. R. & Harpending, H. (1992) Mol. Biol. Evol. 9, 552–569. [DOI] [PubMed] [Google Scholar]
- 35.Slatkin, M. (1996) Am. Nat. 147, 493. [Google Scholar]
- 36.Parsons, T. J., Muniec, D. S., Sullivan, K., Woodyatt, N., Alliston-Greiner, R., Wilson, M. R., Berry, D. L., Holland, K. A., Weedn, V. W., Gill, P., et al. (1997) Nat. Genet. 15, 363–368. [DOI] [PubMed] [Google Scholar]
Associated Data
This section collects any data citations, data availability statements, or supplementary materials included in this article.