

Abstract
We previously identified and characterized a 66–68 kDa membrane-associated, tyrosine phosphorylated protein in murine leukemia L1210 cells as HSC70 which is a methotrexate (MTX)-binding protein. In order to further characterize the functional role of HSC70 in regulating MTX resistance in L1210 cells, we first showed that HSC70 colocalizes and interacts with reduced folate carrier (RFC) in L1210 cells by confocal laser scanning microscopy and Duolink in situ proximity ligation assay. The tyrosine phosphorylation status of HSC70 found in the membrane fraction was different from the parental L1210/0 and cisplatin (CDDP)–MTX cross resistant L1210/DDP cells. In MTX-binding assays, HSC70 from L1210/DDP cells showed less affinity for MTX–agarose beads than that of L1210/0 cells. In addition, genistein (a tyrosine phosphorylation inhibitor) significantly enhanced the resistance of L1210/0 cells to MTX. Moreover, site-directed mutation studies indicated the importance of tyrosine phosphorylation of HSC70 in regulating its binding to MTX. These findings suggest that tyrosine phosphorylation of HSC70 regulates the transportation of MTX into the cell via the HSC70–RFC system and contributes to MTX resistance in L1210 cells.
Keywords: Cross resistance, Heat shock cognate protein 70, Reduced folate carrier, Methotrexate binding protein, Methotrexate transportation, Tyrosine phosphorylation
Introduction
Cross resistance between chemotherapeutic agents is a common phenomenon, and has become a major problem in cancer therapies that utilize combinations of agents, which often have different mechanisms of action. For example, resistance to adriamycin (doxorubicin) showed cross resistance to antiestrogen 4-hudroxytamoxifen, and methotrexate (MTX) showed cross resistance to mitoxantrone in MCF-7 human breast cancer cells [1,2]. In some ovarian cancer cell lines, cisplatin (CDDP) and carboplatin showed cross resistance to each other. Moreover, primary CDDP resistance has shown cross-resistance to various drugs including adriamycin, mitoxantrone and taxol [3,4].
Wroblewski et al. found that the CDDP resistant L1210/DDP cells, known for their CDDP resistance after prolonged exposure of the parental murine L1210/0 cells with CDDP, showed huge (more than 25,000 folds) cross resistance to MTX [5]. MTX, as well as reduced folate, is mainly transported into L1210 cells via a complex reduced folate transport system. Price et al. reported that MTX first associated with a 66–68 membrane-bound protein and was then subsequently transported to a 48 kDa integral membrane protein, and later to the 38 kDa and 21 kDa cytosolic proteins [6,7]. Bhushan et al. first found that the 66–68 kDa protein was phosphorylated in the membrane fraction of L1210/0 cells, but not phosphorylated in L1210/DDP cells [8]. Bhushan et al. further studied the possible mechanisms and excluded several well-studied MTX resistant mechanisms such as dihydrofolate reductase (DHFR) gene amplification, increased DHFR activity, folypolyglutamate synthetase activity modification, and decreased MTX binding to target enzymes [9]. Thus, these findings indicate that MTX may not be transferred from the 66–68 kDa protein to subsequent carriers and MTX uptake is likely disrupted at the plasma membrane in L1210/DDP cells. This 66–68 kDa protein may function as part of the membrane shuttle system involved in intracellular trafficking of MTX in L1210 cells. Furthermore, we recently isolated and purified the 66–68 kDa protein, identified it as heat shock cognate protein 70 (HSC70) and demonstrated its MTX binding properties [10].
HSC70 is located in various cellular locations including the plasma membrane, cytosol, and nucleus [11]. HSC70 directly interacts with the lipid bilayer in the cellular membrane to form ion-conductance channels allowing ions to flow through the cellular membrane [12]. HSC70 also assists the nucleo-cytoplasmic transport systems by regulating the export of the nuclear import receptors [13]. In eukaryotic cells, under normal conditions or in the absence of stress, HSC70 shuttles between the nucleus and cytoplasm. When cells are exposed to stress, such as heat shock, HSC70 concentrates in the nuclei thus inhibiting its shuttling [14]. As a member of the molecular chaperone family of proteins, HSC70 interacts with various chemicals and molecules. For instance, HSC70 interacts with various cochaperones such as Hap46, Hip, Hop, and Hsp40 to allow HSC70 to perform its full function [15–17]. HSC70 also plays a role in certain diseases such as cancer-associated retinopathy, diabetic myocardial injuries, and amyotrophic lateral sclerosis [18].
Folates and folate analogues such as MTX use various transport systems to enter cells. These transport systems are often genetically and functionally different from each other. Some of these known folate transport systems include the reduced folate carrier (RFC) and the membrane localized folate binding proteins (FBPs) that mediate folate uptake as an endocytotic process [19]. RFC is also the primary transporter of folates and antifolate drugs such as MTX, pemetrexed, and raltitrexed that are commonly used as chemotherapeutic agents in mammalian cells and tissues [20,21]. It has been reported that RFC acted as a 58 kDa membrane transport protein with low affinity and high efficiency for reduced folates and MTX in L1210 cells [22,23].
Tyrosine phosphorylation plays an important role in signal transduction which regulates cell proliferation, differentiation, and maintenance of cellular functions. A 16-kDa protein (p16) has been identified as a HSC70 regulatory protein and belongs to the Nm23/nucleoside diphosphate kinase family [24]. HSC70 has also been identified as a tyrosine-phosphorylated protein associated with the nuclear envelope [25]. In addition, HSC70 was identified as one of the phosphotyrosine-containing proteins in T-lymphocytes [26]. We used bioinformatics tools including Scansite, KinasePhos, and NetPhos to identify tyrosine sites within HSC70 that have a high probability of being phosphorylated.
Scansite identifies short protein sequence motifs which are recognized by modular signaling domains and protein kinases. It identified tyrosines 41 and 288 as potential phosphorylation sites in mouse HSC70 and Y288 as possibly being present in an SH2 motif as a site more likely to interact with an autophosphorylate tyrosine-containing motif in receptor tyrosine kinases (Appendix S1: Supplementary Fig. S1A, B) [27,28].
KinasePhos is a web server for computationally identifying catalytic kinase-specific phosphorylation sites. KinasePhos analysis showed that tyrosines 288, 431, and 525 are likely to be phosphorylated in the mouse HSC70 protein. Phosphorylations of Y288 and Y431 are catalyzed by the insulin receptor, while phosphorylation of Y525 is catalyzed by the spleen tyrosine kinase, also known as Syk (Appendix S1: Supplementary Fig. S1C) [29].
Similarly, the NetPhos is a program that produces neural network predictions for serine, threonine and tyrosine phosphorylation sites in eukaryotic proteins. NetPhos analysis showed that tyrosines 41, 288, and 431 have high phosphorylation potential in mouse HSC70 protein (Appendix S1: Supplementary Fig. S1D) [30]. Multiple studies have shown that HSC70 is a tyrosine phosphorylated protein and that tyrosine phosphorylation is likely important in regulating its activity [10,25,26].
Our previous studies have demonstrated that HSC70 is an MTX binding protein in L1210 cells, by HSC70's ability to aggregate to MTX-agarose beads out of whole cell lysates [10]. Thus, we proposed that MTX likely interacts first with HSC70 proteins located in the plasma membrane, as well as other membrane bound MTX transport proteins of L1210/0 cells. MTX can then be transferred into the cell by HSC70 and interact with other cytosolic MTX associated proteins, where it eventually exerts its effects. However, in MTX resistant L1210/DDP cells, we suspect that MTX fails to get transferred from the membrane localized HSC70 to the cytosol of these cells. Therefore, we hypothesize that HSC70 located in the plasma membrane may act as a membrane transporter for MTX, or cooperate with RFC for the transportation of MTX. The interaction between HSC70 and MTX may contribute to the CDDP-MTX cross resistance that is found in L1210/DDP cells.
Materials and methods
Materials and reagents
McCoy's 5A medium, Tween-20, 2 hydroxyethylpiperazine-N″-2 ethanesulfonic acid (HEPES), bovine serum albumin (BSA, A7906), Sodium fluoride, and MTX agarose beads (M0269) were purchased from Sigma-Aldrich (St. Louis, MO, USA). Fluorescein methotrexate tri-ammonium salt (00023) was purchased from Biotium (Hayward, CA, USA). Sodium bicarbonate, albumin protein standard, chloroform, and isopropanol were purchased from Fisher Scientific (Fairlawn, NJ, USA). The mouse monoclonal HSC70 primary antibody (sc-7298), rabbit polyclonal RFC-1 primary antibody (sc-98970), mouse monoclonal primary antibody to beta-actin (sc-47778), rabbit polyclonal primary antibody to Na+/K+/ATPase (sc-28800), goat anti-rabbit IgG-HRP (sc-2301), and goat anti-mouse IgG-HRP (sc-2031), ProteinA/G PLUS-Agarose (sc-2003) were purchased from Santa Cruz Biotechnology (Dallas, Texas, USA). Mouse monoclonal primary antibody to phosphotyrosine (PY-69) was purchased from BD Biosciences (Sparks, MD, USA). HRP conjugated secondary anti-mouse and anti-rabbit antibody, Alexa-fluor conjugated donkey anti-mouse (A10036) and anti-rabbit (A31573) were purchased from Life Technologies (Carlsbad, CA, USA). The secondary goat anti-rabbit IgG for PY69 was purchased from Kirkegaard & Perry Laboratories, Inc (Gaitherburg, MD, USA). The anti-phosphotyrosine agarose beads (mouse monoclonal PY20 IgG) were purchased from Biomol (Plymouth Meeting, PA, USA). Chemiluminescence reagent (peroxidase substrate kit) was purchased from Pierce (Rockford, IL, USA). Protease inhibitor cocktail was purchased from Roche Diagnostics (Mannheim, Germany). The Duolink proximity ligation assay (PLA) kit was purchased from Olink Bioscience (Uppsala, Sweden). Trizol-LS, glycogen, TURBO DNA-free kit, SuperScrip III first-strand synthesis system and ProBond purification system were purchased from Life Technologies (Grand Island, NY, USA). The QuikChange II site-directed mutagenesis kit was purchased from Agilent technologies (Santa Clara, CA, USA).
Cell culture
Both sensitive (L1210/0) and resistant (L1210/DDP) murine leukemia cells were cultured at 37 °C, 5% CO2, in McCoy's 5A medium containing L-glutamine, and 2.2 g/l sodium bicarbonate (Fischer scientific, Fairlawn, NJ, USA). The medium contains 5% donor horse serum (Atlanta Biologicals, Flowery Branch, GA, USA) for L1210/0 cells and 5% fetal bovine serum (Atlanta Biologicals, Flowery Branch, GA, USA) for L1210/DDP cells.
Total cell lysate preparation
1 × 10⁷ cells were collected and centrifuged at 1500 g for 5 minutes at 4 °C. The supernatants were discarded and the cell pellets were washed twice with ice-cold 1× PBS and resuspended in 100 μl 1× cell lysis buffer (2% Triton X-100, 20 mMTris-HCl, 10 mM EDTA, 100 mM NaCl, 60 mM sodium pyrophosphate, 100 mM sodium fluoride, 0.2% sodium azide, pH = 7.6) containing 200 μM sodium orthovanadate, 1 mM PMSF, 2 μg/ml aprotinin, and 20 μg/ml leupeptin, then the cells were sonicated. The suspensions were centrifuged at 6000 g for 5 minutes at 4 °C. The pellets were discarded and the supernatants were collected for determination of protein concentration.
Cellular plasma membrane and cytosol fraction isolation
Cells were centrifuged at 450 g for 10 minutes at 4 °C, and washed three times with 1× PBS, then resuspended in 3 ml Buffer B (1 mM dithiothreitol, 20 mM HEPES, 1 mM PMSF, 0.02 mg/ml leupeptin, 0.1 mM sodium orthovanadate and 50 mM sodium fluoride, pH = 7.4), followed by homogenization with 20 strokes of a Dounce homogenizer. The homogenates were then centrifuged at 3000 g for 5 minutes at 4 °C. The supernatants were then ultracentrifuged at 100,000 g for 1 hour at 4 °C. The plasma membrane pellets were suspended in buffer A (1% Triton X-100, 10 mM Tris–HCl, pH 7.6, 5 mM EDTA, 50 mM NaCl, 30 mM sodium pyrophosphate, 50 mM sodium fluoride, 2 mM PMSF, 0.1 mM sodium orthovanadate, 0.02 mg/ml leupeptin and 0.01% sodium azide, pH 7.4). The cytosolic fraction was present in the supernatant and was concentrated using a Centricon 10 ultrafiltration device (Millipore, Billerica, MA, USA). The concentrated fractions were suspended in Buffer A containing 1% Triton X-100.
Western blotting
Protein samples were loaded on a 12% SDS-polyacrylamide gel, separated with electrophoresis and subsequently transferred to a PVDF membrane. For HSC70, RFC and beta-actin detection, membranes were blocked with 5% milk in 1× TBS containing 0.05% (v/v) Tween-20 for 4 hours at room temperature. For tyrosine phosphorylation detection, PY69 phosphotyrosine Ab was used, and membranes were blocked with 2% BSA in 1× PBS for 6 hours at room temperature. The membranes were washed seven times with 1× TBS and 1× TBST alternatively. The membranes were then incubated with primary Ab (1:1000 dilutions) at 4 °C overnight, followed by incubating with secondary Ab (1:2500 dilution) at room temperature for 1 hour. Pierce super signal chemiluminescent substrate was used and images were captured using the X-ray scientific imaging film.
Methotrexate binding assay
A similar protocol was followed as the experiments described previously [10]. 1 ml of MTX agarose beads was used for each sample. To prepare for the binding assay, the beads were centrifuged at 100 g for 3 minutes at 4 °C and the supernatants were discarded. The beads were washed subsequently with 1 ml ice cold 1× PBS and 1× cell lysis buffer twice. Then the various amounts of protein samples were added and mixed with the beads. They were then placed on the rocker allowing them to mix and interact thoroughly overnight at 4 °C. The beads and the protein mixtures were then centrifuged at 100 g for 3 minutes at 4 °C. The supernatants were discarded and the beads were washed subsequently with ice cold 1× PBS five times to ensure the unbound proteins were washed off. Finally, 200 μl of 1× SDS sample buffer was added and mixed with the beads, and the mixtures were put in a 95 °C water bath for 5 minutes, allowing the break-down of the beads and the detachment of the binding proteins from the beads into the sample buffer. The samples were subjected to Western blotting assay.
Immunoprecipitation
Membrane and cytosol fractions (300 μg total protein) from both cell lines were incubated with 50 μl of anti-phosphotyrosine agarose beads at 4 °C with constant mixing by placing on a shaker. After overnight incubation, the samples were centrifuged at 2500 g for 10 minutes at 4 °C and the supernatants were discarded. The pellets were washed three times with 1× cell lysis buffer followed by centrifugation at 1000 g for 5 minutes at 4 °C. After the final wash and centrifugation, the proteins were eluted from the beads by boiling for 5 minutes in 50 μl of 1× SDS sample buffer. The immunoprecipitates were analyzed by SDS-PAGE and Western blotting assay for HSC70.
Cell fixation and immunocytochemistry
2 ml of cell suspension was cultured on 6-well plates and cells grew until reaching 70–80% confluence. Cells in each well were subjected to different drug treatments. 1 ml of cell suspension from each well was collected and centrifuged using cytospin and the cells were smeared onto poly-L-lysine coated slides. 50 μl of 4% paraformaldehyde fixation solution was poured onto the cells on slides and incubated for 15 minutes at room temperature. After the slides were rinsed and washed with room temperature 1× PBS, cells were permeabilized with 1× PBS + 0.01% triton-X. Following permeabilization, the cells were blocked with a blocking buffer containing 1× PBS, 0.01% triton-X, and 5% BSA for 45 minutes at room temperature, and then incubated with primary antibody to RFC and HSC70 at 1:500 dilution overnight at 4 °C. After adequate washing with 1× PBS and incubation with tissue specific Alexa Fluor conjugated secondary antibodies (anti-rabbit Alexa Fluor 647 and anti-mouse Alexa Fluor 546), the cells were covered with a coverslip by adding 50 μl of anti-fade medium and sealed.
Duolink protein ligation assay
Duolink protein ligation assay (PLA) is used to identify the interaction between HSC70 and RFC. After treatments, freshly dissociated L1210/0 and L1210/DDP cells were plated at a density of 2 × 10⁴ per cm2 on glass cover slips (25 mm diameter) in a 6 well plate, then fixed, permeabilized, blocked and incubated with primary antibodies against HSC70 and RFC. The PLA probe anti-mouse minus, DUO92004, PLA probe anti-rabbit plus, and DUO92002 were used. For the negative control group, experiments were performed with the same process but without HSC70 or RFC primary antibody. Proximity ligation was then conducted in situ according to the manufacturer's instructions. After incubation with the secondary antibody, the samples underwent steps including antibody binding, hybridization, enzymatic ligation, and polymerase amplification. If the PLA probes are in close proximity (<40 nm), bright fluorescent emissions can be detected and quantified by a fluorescence microscope. The fluorescent emissions were observed using confocal laser scanning microscopy at 60× objective and a filter for Texas red dye (596 nm). The fluorescent emissions were quantified using NIH software imageJ plugin JACoP and Olympus Fluoview 1000 (Olympus, Center Valley, PA, USA).
Confocal imaging
All the images were observed using Olympus FV1000 inverted confocal laser scanning microscopy with 4-channel simultaneous acquisition at 60× oil objective. The cell samples for colocalization studies were observed under the Alexa Fluor 647, Alexa Fluor 546 and 4′,6-diamidino-2-phenylindole (DAPI) lasers. The samples for Duolink PLA were observed under Texas red laser and DAPI fluorescent stain. All the images were taken at a resolution of 1024 and a pixel range of 4–10.
RNA isolation, cDNA synthesis, RT-PCR and Hspa8 gene sequencing
1 × 10⁷ L1210/0 and L1210/DDP cells were harvested by centrifugation at 1500 g for 5 minutes at 4 °C. The supernatants were discarded and cell pellets were resuspended in 250 μl 1× PBS followed by adding 750 μl Trizol LS reagent. The mixture was incubated at room temperature for 10 minutes. 200 μl chloroform was added to the mixture with brief vortex. The mixture was then incubated at room temperature for 5 minutes followed by centrifugation at 16,000 g for 15 minutes at 4 °C. The aqueous phase was then transferred to a new 1.5 ml Eppendorf tube, and 10 μg of RNase-free glycogen was added to the tube and mixed. 500 μl of isopropanol was added to the mixture and the mixture was then incubated at room temperature for 10 minutes followed by centrifugation at 16,000 g for 30 minutes at 4 °C. The RNA was precipitated as a pellet on the side and bottom of the tube. The solution was aspirated and the pellet was washed with 1 ml of ice cold 70% ethanol followed by centrifugation at 16,000 g for 10 minutes at 4 °C. The solution was aspirated and the pellet was air-dried. The pellet was resuspended in 30 μl RNase-free water. The RNA concentration was measured by NanoDrop 2000 spectrophotometer (Thermo Scientific, Wilmington, DE, USA). The TURBO DNA-free kit was used and the manufacturer's protocol was followed to remove DNA contamination in the RNA samples. The first strand cDNA was synthesized by using the SuperScript III first-strand synthesis system and the cDNA was used as the template for RT-PCR analysis. Briefly, the primers were designed to generate the desired point mutation (from tyrosine to phenylalanine) and anneal to the same sequence on opposite strands of the desired plasmid. The point mutation was placed in the middle of the primer ranging from 25 to 40 bp with a melting temperature greater than 75 °C. The GC content of the primers is about 40%–60%. RT-PCR analysis for the Hspa8 gene was performed using 10 ng of cDNA as the template. The forward primer is designed as 5′-GCGCGCGGATCCATGTCTAAGGGACCTGCAGTTGGC-3′, and the reverse primer is designed as 5′-GCGCGCAAGCTTTTAATCCACCTCTTCAATGGTGGG-3′. PCR was performed with the following cycling parameters: (1) Initial denaturation at 94 °C for 10 minutes, (2) 30 cycles of denaturation at 94 °C for 1 minute, annealing at 55 °C for 1 minute and extension at 72 °C for 1 minute, (3) final extension at 72 °C for 10 minutes. The PCR product of the Hspa8 gene was about 2 kbp. PCR products were then sent for sequencing at Idaho State University Molecular Research Core Facility. The sequence of the Hspa8 gene was obtained through cDNA sequence.
Site directed mutagenesis
Tyrosine sites 288 and 525 in HSC70 from the L1210/0 cells were mutated into phenylalanine to prevent phosphorylation. The cDNA of the Hspa8 gene from L1210/0 cells was isolated and purified as demonstrated above. A six-histidine tag was added to either the amino- or carboxyl-terminus of the Hspa8 gene, and the gene was then mutated by QuikChange site-directed mutagenesis (Agilent technologies, Santa Clara, CA, USA). The following primers were used for the PCR: Y288F forward: 5′-GAGATTGATTCTCTCTTTGAGGGAATTGACTTC-3′, Y288F reverse: 5′-GAA GTCA ATTCCCTCAAAGAGAGAATCAATCTC-3′; Y525F forward: 5′-CCAAGAAGCTGA GAAGTTTAAGGCTGAGGATGAG-3′, Y525F reverse: 5′-CTCATCCTCA GCCTT AACTTCTCAGCTTCTTGG-3′. The PCR reaction was performed with the following cycling parameters: (1) Initial denaturation at 95 °C for 30 seconds, (2) 18 cycles of denaturation at 95 °C for 30 seconds, annealing at 55 °C for 1 minute, extension at 68 °C for 5 minutes. The PCR amplification products were subjected to digestion with the restriction endonuclease DpnI (2.5 μl 10× buffer, 0.5 μl DpnI, and 100 ng in 22 μl of DNA) at 37 °C for 3 hours to destroy parental and hemiparental Hspa8-pcDNA3.1 plasmids. The mutation-containing Hspa8 gene was then ligated into the pcDNA3.1 vector (Invitrogen, Carlsbad, CA, USA) and the vector was then transformed into competent E. coli cells following the manufacturer's protocol. The E. coli cells containing mutant DNA products were spread onto LB medium agar plates containing ampicillin and incubated at 37 °C for overnight. Positive bacteria colonies were inoculated from the media plates to media broth tubes. Plasmid DNA from the positive E. coli cells was extracted and sent for sequencing at the Idaho State University Molecular Research Core Facility to confirm the correct site directed mutation. The mutant plasmid was then transfected into HEK293T cells [American Type Culture Collection (ATCC), Manassas, VA, USA], and the mutated protein expression was induced and further purified using the ProBond purification system following the manufacturer's protocol.
Statistical analysis
Statistical significance of the data was analyzed by the Student t-test with a minimum significance level set at p < 0.05 (marked as *).
Results
Colocalization of HSC70 and RFC in L1210/0 and L1210/DDP cells
We used immunofluorescence and confocal laser scanning microscopy to study the colocalization of the HSC70 and RFC in both L1210/0 and L1210/DDP cells to elucidate their potential relationship. The HSC70 and RFC were fluorescently tagged with secondary antibodies conjugated with Alexa Fluor 546 and 647. The emission wavelength of the Alexa Fluors is sufficiently separated to avoid bleed through and false detection. The yellow fluorescence indicates the expression of HSC70 and the red fluorescence indicates the expression of RFC. Colocalization of endogenous HSC70 and RFC is shown by the faint orange colored regions in the merged images. Colocalization analysis of HSC70 and RFC is also represented by 2D scatter plots, which indicate the degree of association between the two proteins as shown in Fig. 1C. 2D scatter plots graph the intensity of one length of florescent light waves or channel versus another on a two-dimensional histogram, in this case, yellow channel for HSC70 and red channel for RFC. The higher degree of channel overlapping indicates a higher degree of colocalization, shown as less scattered in the 2D scatter plot. The yellow channel (Alexa Fluor 546) for HSC70 is graphed along the X-axis and the red channel for RFC (Alexa Fluor 647) is plotted on the Y-axis. Every pixel of the composite image is characterized by a pair of intensities and analysis of the distribution pattern generated by the intensity pairs enables identification of fluorophore colocalization. The values of colocalization coefficients were obtained by using JACoP plugin of imageJ 1.47 and listed in Table 1. In parental L1210/0 cells, HSC70 is ubiquitously expressed while RFC expression is dominant in the plasma membrane, seen as a thick red region around the periphery of the cells. Without the presence of MTX, the 2D scatter plot showed that the pixels of yellow and red channels were highly scattered suggesting lower correlation between the two proteins. The value of the Pearson's correlation coefficient for colocalization without MTX treatment was found to be 0.231 ± 0.024, further suggesting there is no co-localization of HSC70 and RFC in L1210/0 cells. After treating the cells with 2 μM MTX for 15 minutes or 24 hours, the merged images showed colocalization of HSC70 and RFC in L1210/0 cells. The 2D scatter plot showed the pixels of yellow and red channels were less highly scattered compared to the control (no MTX treatment). The colocalization of the two proteins was also confirmed by the values of the Pearson's correlation coefficient (0.673 ± 0.069 with 15 minutes treatment and 0.777 ± 0.162 with 24 hours treatment, Fig. 1A, C and Table 1). In resistant L1210/DDP cells, RFC is less dominantly expressed in the plasma membrane compared to the parental L1210/0 cells. HSC70 also colocalized with RFC in L1210/DDP cells even without MTX treatment and the value of the Pearson correlation coefficient for the colocalization was 0.702 ± 0.081 (Fig. 1B and Table 1). After treating the L1210/DDP cells with 2 μM MTX for 15 minutes or 24 hours, the HSC70 remained in colocalization with RFC. The 2D scatter plots showed pixels of yellow and red channels are less scattered showing higher correlation between HSC70 and RFC with or without MTX treatment. The values of Pearson's correlation coefficients were 0.766 ± 0.030 in the 15 minutes MTX treatment group and 0.732 ± 0.078 in the 24 hours MTX treatment group (Fig. 1B, C and Table 1).
Fig. 1.

Colocalization of HSC70 and RFC in L1210/0 and L1210/DDP cells. (A) HSC70 expression, RFC expression, and overlay (merged) image of HSC70 and RFC channels (specific wave lengths of fluorescent light) in L1210/0 cells with or without MTX. (B) HSC70 expression, RFC expression, and overlay (merged) image of HSC70 and RFC channels in L1210/DDP cells with or without MTX. The yellow fluorescence represents the expression of HSC70 immuno-tagged with alexa fluor 546. The red fluorescence represents the expression of RFC immune-tagged with alexa fluor 647. The images were captured with confocal laser scanning microscopy at 60× objective, 1024 resolution and 2.1 optical zoom and turned to 8-bit color and analyzed for colocalization using JACoP plugin from image J. The images shown are representative of three independent experiments. (C) 2D scatter plot colocalization of L1210/0 cells and L1210/DDP cells with or without MTX. The yellow channel (Alexa Fluor 546) for HSC70 is graphed along the X-axis and the red channel for RFC (Alexa Fluor 647) is plotted on the Y-axis. The plots shown are a representation of three independent experiments. (For interpretation of the references to color in this figure legend, the reader is referred to the web version of this article.)
Table 1.
Colocalization coefficients with or without 2 μM MTX in L1210/0 and L1210/DDP cells.
| Control | 2 μM MTX, 15 min | 2 μM MTX, 24 h | ||
|---|---|---|---|---|
| L1210/0 | Pearson's correlation coefficient | 0.231 ± 0.024 | 0.673 ± 0.069 | 0.777 ± 0.162 |
| Overlap coefficient | 0.681 ± 0.100 | 0.754 ± 0.133 | 0.792 ± 0.077 | |
| Mander's coefficient M1 | 0.596 ± 0.066 | 0.754 ± 0.036 | 0.616 ± 0.088 | |
| Mander's coefficient M2 | 0.344 ± 0.078 | 0.564 ± 0.044 | 0.724 ± 0.091 | |
| L1210/DDP | Pearson's correlation coefficient (rp) | 0.702 ± 0.081 | 0.766 ± 0.030 | 0.732 ± 0.078 |
| Overlap coefficient | 0.739 ± 0.055 | 0.795 ± 0.127 | 0.756 ± 0.132 | |
| Mander's coefficient M1 | 0.538 ± 0.045 | 0.614 ± 0.123 | 0.735 ± 0.079 | |
| Mander's coefficient M2 | 0.529 ± 0.023 | 0.676 ± 0.048 | 0.758 ± 0.068 |
The values of colocalization coefficients were obtained by using JACoP plugin of imageJ 1.47 from National Institutes of Health (NIH). Values of the colocalization coefficients including Pearson's correlation coefficient, overlap coefficient, and Mander's coefficients M1 and M2 with or without 2 μM MTX in L1210/0 and L1210/DDP cells. The values shown are the average of three independent experiments (Mean ± SD).
Interaction of HSC70 and RCF in the presence of MTX
Colocalization refers to the observation of the spatial overlap between two (or more) proteins labeled with different fluorescent probes, which are in very close spatial position in the cell [31]. Colocalization does not necessarily mean there is physical interaction between targeted proteins although proteins in close proximity to one another are more likely to undergo interactions [32]. After showing the colocalization of HSC70 and RFC in both L1210/0 and L1210/DDP cells, potential interaction between HSC70 and RFC in both cell lines was assessed using Duolink in situ proximity ligation assay (PLA) kit and confocal laser scanning microscopy. The Duolink PLA assay specifically identifies protein interactions between oligonucleotides and enzymes [32]. In this study, the appearance of fluorescent red emissions indicates positive interaction between HSC70 and RFC. Discrete bright red fluorescent emissions were detected in both L1210/0 and L1210/DDP cells when treated with 2 μM MTX, as shown in Fig. 2. This suggests that HSC70 and RFC undergo protein–protein interactions in both cell lines in the presence of MTX. However, these fluorescent emissions were not observed in either cell line in the absence of MTX. Red fluorescent emissions were also not observed in the negative controls which were carried out by excluding one of the primary antibodies, either HSC70 or RFC, in the antibody staining step, further validating the findings (data not shown). Thus, the Duolink PLA assay suggests that HSC70 and RFC interact in the presence of MTX. The results further suggest that the presence of MTX may facilitate the physical interaction of the two proteins. This implies that the HSC70–RFC protein complex might be involved in shuttling MTX through the plasma membrane into the cell. Interestingly, the fluorescent emissions in the L1210/DDP cells were mostly localized in the plasma membrane and no signal was detected inside the cytosol, whereas fluorescent emissions in L1210/0 cells were distributed more abundantly in both cytosol and the plasma membrane (Fig. 2). This may explain the lack of MTX transportation in resistant L1210/DDP cells.
Fig. 2.

Fluorescent emissions in L1210/0 and L1210/DDP cells by Duolink proximity ligation assay with or without MTX. The L1210/0 or L1210/DDP cells were cultured on 6 well plates with or without the presence of MTX. The interaction between HSC70 and RFC proteins appears as red fluorescent emissions. Images were captured by confocal laser microscopy at 60× objective and 1024 resolution. The plots shown are a representation of three independent experiments. (For interpretation of the references to color in this figure legend, the reader is referred to the web version of this article.)
Expression of HSC70 in L1210/0 and L1210/DDP cells
We first isolated the plasma membrane and cytosol fractions in both cell lines and then measured the HSC70 expression by Western blotting assay. HSC70 was almost equally expressed in both plasma membrane and cytosol fractions of both cell lines. However, the level of HSC70 in the cytosol fraction was much higher than that in the membrane fraction, because HSC70 is mainly a cytosolic protein [11]. Na-K-ATPase and beta-actin were used to confirm the purity of membrane and cytosol fractions, Na-K-ATPase was detected in the membrane fraction only, not in the cytosol fraction, while beta-actin was detected in the cytosol fraction and not in the membrane fraction of both cell lines (Fig. 3A). We also compared the level of HSC70 in the total cell lysates between the two cell lines and no significant difference was detected (Appendix S1: Supplementary Fig. S2B). In addition, RT-PCR assays were used to measure the Hspa8 gene transcription and the gene was nearly equally transcribed in both cell lines (Appendix S1: Supplementary Fig. S2A). Furthermore, we sequenced and compared the Hspa8 gene coding of the HSC70 protein from both cell lines and only three nucleotide differences were found between L1210/DDP cells and L1210/0 cells. These nucleotide changes in L1210/DDP cells are: nt214 changed from “c” to “a” (coding for amino acid 72 arginine); nt605 changed from “t” to “c”(coding for amino acid 205 phenylalanine); and nt729 changed from “t” to “c”(coding for amino acid 243 alanine). The amino acid sequences of the HSC70 proteins were identical in both cell lines. We also measured the expression of RFC by Western blotting assay. RFC was mainly expressed in the membrane fraction of the cell lysates, and very little expression was detected in the cytosol fraction. This finding suggests that RFC is mainly located in the plasma membrane. The RFC levels in the membrane fractions are slightly higher in L1210/0 cells compared to L1210/DDP cells (data not shown). We also measured and compared the P-glycoprotein (P-gp) levels between the two cell lines. Resistant L1210/DDP cells showed higher expression of P-gp compared to sensitive L1210/0 cells (Appendix S1: Supplementary Fig. S3).
Fig. 3.

Expression and tyrosine phosphorylation status of HSC70 in L1210/0 and L1210/DDP cells. (A) HSC70 expression in different cellular fractions including the plasma membrane and cytosol fractions in both L1210/0 (S) and L1210/DDP (R) cells by Western blotting assay. Beta-actin and Na-K-ATPase were used as a control to confirm the purity of the different cellular fractions. The blots shown are representative of three independent experiments. (B) Comparison of the tyrosine phosphorylation status in the membrane fraction between L1210/0 and L1210/DDP cells by Western blotting assays used PY69 antibody. A tyrosine-phosphorylated band around 70 kDa was observed in the membrane fraction of L1210/0 cells. This band was not found in the L1210/DDP cells. The blots shown are representative of three independent experiments. (C) HSC70 expression in the membrane fraction in both sensitive L210/0 and resistant L1210/DDP cells by Western blotting and immunoprecipitation assays. The membrane fractions from both L1210/0 and L1210/DDP cell lines were immunoprecipitated by PY20 antibody agarose beads, followed by a Western blotting assay for the detection of HSC70 in the immunoprecipitated mixture. HSC70 was detected in the membrane fraction after it was immunoprecipitated with PY20 antibody agarose beads from L1210/0 cells. However it was hardly detected in the membrane fraction from L1210/DDP cells. The blots shown are a representation of three independent experiments.
Tyrosine phosphorylation status of HSC70 in the membrane fraction of L1210/0 and L1210/DDP cells
Since there is no difference in protein products of the Hspa8 gene in the sensitive L1210/0 and resistant L1210/DDP cells, we further explored possible post-translational modifications of HSC70 in both cell lines. First, we studied the tyrosine phosphorylation status of HSC70 in the membrane fraction and its binding properties to MTX. Twenty μg of membrane fractions from L1210/0 and L1210/DDP cells were separated by SDS-PAGE, and the tyrosine phosphorylation status was detected by PY69 antibody. A 70 kDa tyrosine phosphorylated band was observed in the membrane fraction of L1210/0 cells but not present in the membrane fractions of L1210/DDP cells (Fig. 3B). The molecular size of the band was consistent with the size of HSC70. This observation suggests a different tyrosine phosphorylation status of HSC70 between L1210/0 and L1210/DDP cells. In addition to the absence of the major 70 kDa band in L1210/DDP cells, differences were also observed in lower molecular weights between the two cell lines, suggesting that other proteins particularly proteins of lower molecular weight may also have a different tyrosine phosphorylation status in resistant L1210/DDP cells compared to the parental L1210/0 cells. We further examined the tyrosine phosphorylation status in the membrane localized HSC70 by immunoprecipitation and Western blotting assays. The membrane fractions were immunoprecipitated with anti-phosphotyrosine agarose beads, and Western blotting assay was used to detect HSC70 in immunoprecipitated mixtures. The results showed that HSC70 is present in the membrane fraction in both L1210/0 and L1210/DDP cells. However, HSC70 was detected in the immunoprecipitated mixture from L1210/0 cells, but it could hardly be detected in the L1210/DDP cells (Fig. 3C). These findings suggest that the HSC70 presented in the membrane fraction of L1210/0 cells is likely to be tyrosine phosphorylated, and that HSC70 found in L1210/DDP cells has less tyrosine phosphorylation.
Inhibition of tyrosine phosphorylation enhanced resistance of MTX in L1210/0 cells
In order to further study the effects of tyrosine phosphorylation on L1210 cells, we treated the cells with MTX and genistein alone and in combination to measure the cell survival rates. We evaluated the response of L1210/0 and L1210/DDP cells to MTX after inhibiting tyrosine phosphorylation by pretreating them with 5 μM genistein for 6 hours, followed by 0.01 μM MTX for 48 hours. MTX significantly inhibited cell survival in L1210/0 cells (p < 0.05), but did not inhibit the survival of L1210/DDP cells, further suggesting that L1210/0 cells are sensitive to MTX while L1210/DDP cells are resistant to MTX. Genistein pretreatments significantly enhanced the resistance to MTX in L1210/0 cells (p < 0.05), suggesting that inhibition of tyrosine phosphorylation contributes to MTX resistance in parental L1210/0 cells. However, genistein pretreatments did not significantly affect the response to MTX in L1210/DDP cells (Fig. 4A). Next, we compared the effects of genistein on HSC70 expression levels in both cell lines. Neither 50 μM nor 300 μM of genistein affected HSC70 levels in either cell lines (Fig. 4B), suggesting that genistein inhibits tyrosine phosphorylation without affecting the expression of HSC70.
Fig. 4.

The effects of genistein on the sensitivity of MTX and HSC70 expression in L1210/0 and L1210/DDP cells. (A) Cell survival of L1210/0 and L1210/DDP cells after being treated with 0.01 μM MTX for 48 h ± 5 μM genistein for 6 h. MTX significantly inhibited the cell survival in L1210/0 cells when compared to L1210/DDP cells, and genistein enhanced the resistance to MTX in L1210/0 cells. The bar graph represents three independent experiments. Student t-test was used in statistical analysis and * indicates p < 0.05. (B) HSC70 expression in L1210/0 and L1210/DDP cells after treatment with 50 μM or 300 μM of genistein for 6 h. The cell lysates were collected and HSC70 was detected by Western blotting assay. Beta-actin was used as the loading control. The blots shown are a representation of three independent experiments.
Binding properties of HSC70 with MTX agarose beads in L1210/0 and L1210/DDP cells
Next, we determined the binding properties of HSC70 located in the membrane and cytosol fractions to MTX agarose beads. In order to study the binding ability, we first titrated the amount of protein sample to the amount of MTX agarose beads. We found that the HSC70 present in a membrane or cytosol fraction that contained 500 μg of verified total protein was able to saturate with 1 ml of MTX agarose beads (data not shown). In MTX binding assays, we used 300 μg of total protein from the membrane or cytosol fraction of either cell line, and applied it to 1 ml of MTX agarose beads. HSC70 was equally detected in the membrane fractions between the two cell lines. However, HSC70 levels were found to be much lower in the membrane fractions of L1210/DDP cells in comparison to L1210/0 cells after binding with MTX agarose beads, suggesting HSC70 in the membrane fraction binds with MTX. It also suggests that HSC70 may be involved in MTX interaction and transportation in L1210/0 cells. Consequently, the membrane associated HSC70 in L1210/DDP cells has less binding affinity for MTX, indicating that HSC70 in resistant cells may not function properly as it does in parental cells (Fig. 5A). Similar findings were observed when binding assays were performed between MTX agarose beads and cytosol fraction (Fig. 5B). HSC70 located in the cytosol of L1210/0 cells had higher binding affinity to MTX than that of L1210/DDP cells. This suggests that HSC70 can interact with MTX not only in the membrane but also in the cytosol. This finding is consistent with our previous report that HSC70 is an MTX binding protein in both sensitive and resistant cells [10]. In resistant L1210/DDP cells, transportation of MTX from the membrane into cytosol by HSC70 may be compromised by abnormal phosphorylation of HSC70. This result may partially explain the roles of HSC70 in regulating MTX resistance in L1210 cells.
Fig. 5.

MTX binding in the membrane and cytosol fractions of L1210/0 and L1210/DDP cells. (A) MTX binding in the membrane fraction of L1210/0 and L1210/DDP cells. The HSC70 in the membrane fraction from both cell lines showed binding properties to MTX agarose beads. HSC70 in the membrane fraction from the L1210/DDP cells showed less binding affinity for MTX agarose beads in comparison to L1210/0 cells. Beta-actin was used as a negative control and did not bind with MTX agarose beads. The blots shown are a representation of three independent experiments. (B) MTX binding in the cytosol fraction of L1210/0 and L1210/DDP cells. The HSC70 in the cytosol fraction of the L1210/0 cells showed greater binding properties to MTX agarose beads but the HSC70 in the cytosol fraction of the L1210/DDP cells showed less binding ability to MTX agarose beads compared to L1210/0 cells. Beta-actin was used as a negative control and did not bind with MTX agarose beads. The blots shown are a representation of three independent experiments.
MTX binding properties of tyrosine point mutated HSC70 proteins
Bioinformatics tools suggested several tyrosine phosphoryla-tion sites within HSC70 that may be important for the protein to function (Appendix S1: Supplementary Fig. S1). In order to further investigate the roles of tyrosine phosphorylation of HSC70 in the regulation of MTX binding, we used site-directed mutagenesis technique to mutate tyrosine amino acid sites into phenylalanine amino acids. We mutated tyrosine sites 288 and 525 of HSC70 into phenylalanine so the two tyrosine sites could not be phosphorylated in L1210/0 cells. A poly-histidine tag was first added to either amino- or carboxyl-terminal of the mutant HSC70 proteins and the mutant proteins were further isolated and purified. Western blotting assays confirmed the purified mutant HSC70 proteins Y288F and Y525F with the poly-histidine tag on either the amino- or carboxyl-terminal of the protein (Fig. 6A). Next, MTX binding assays were performed with the purified mutant HSC70 protein. Results showed that Y288F and Y525F mutant HSC70 proteins are still able to bind MTX agarose beads. However, it was found that the binding property of MTX to mutant Y288F HSC70 was significantly decreased when compared with MTX's ability to bind the mutant Y525F HSC70 (Fig. 6B). These results suggested that Y288 has important functionality in controlling the binding of HSC70 and MTX.
Fig. 6.
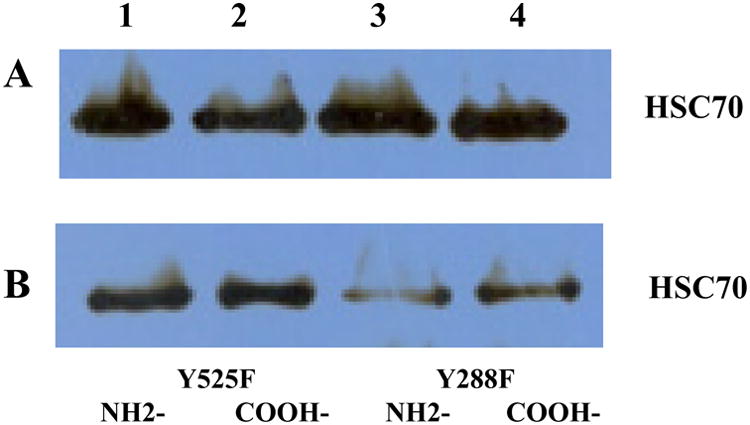
MTX binding assay using the purified tyrosine site-directed mutant HSC70 with the MTX agarose beads. Site-directed mutagenesis was used to mutate the amino acid tyrosine 288 or 525 into phenylalanine in HSC70 from L1210/0 cells. (A) Purified mutant HSC70 protein with the poly-histidine tag at either amino- (NH2-) or carboxyl-(COOH-) terminal by Western blotting assay. (B) Purified mutant HSC70 placed in an MTX binding assay followed by Western blotting assay. HSC70 mutations at Y525F were detected after binding with MTX–agarose beads, but the level of mutated Y288F HSC70 was significantly reduced after an MTX binding assay when compared to Y525F HSC70.
Discussion
Wroblewski et al. reported that L1210/DDP cells exhibited more than 25,000-folds cross resistance to MTX by directly measuring the cell numbers with a Coulter counter [5]. We also confirmed the cross resistance of CDDP with MTX in L1210/DDP cells by the MTT assay and found the IC50 of MTX to the parental L1210/0 cells is approximately 0.06 μM, however, even 10 μM of MTX could only achieve 10% cell growth inhibition against the L1210/DDP cells (data not shown). Bhushan et al. found that a membrane bound, tyrosine phosphorylated 66-68 kDa protein was present in the membrane fraction of the murine parent L1210 leukemia cells, but absent in the CDDP– MTX cross-resistant L1210/DDP cells [8]. We later identified the 66– 68 kDa protein as HSC70, which belongs to the heat shock protein 70 (HSP70) family and coded by the gene Hspa8. We have performed the MTX binding assays using MTX agarose beads bound with total lysates from L1210 cells and demonstrated that HSC70 is an MTX binding protein in L1210 cells [10].
In this study, we further explored the possible molecular regulatory mechanisms of HSC70 in CDDP–MTX cross resistance of L1210 cells. First, we investigated the potential relationship between HSC70 and RFC. RFC is the primary transporter of folates and antifolate chemotherapeutic drugs such as MTX, pemetrexed, and raltitrexed in mammalian cells and tissues [21]. In order to study the relationship between HSC70 and RFC and their potential roles in mediating MTX resistance in L1210 cells, we systematically investigated the putative colocalization and interaction of the two proteins by immunofluorescence and Duolink proximity ligation assay with confocal fluorescence microscopy. We labeled the two proteins with distinct immunofluorescence labeled probes, and studied the colocalization of the proteins in both cell lines, especially in the plasma membrane. Coefficient values were used to estimate the colocalization between the two proteins under confocal microscopy. Pearson's correlation coefficient describes the correlation of the intensity distribution between protein channels. The values ranged from 0.5 to 1.0 indicating colocalization. Overlapping coefficients indicate an actual overlap of the signals which represent the true degree of colocalization and when the values ranged from 0.6 to 1.0 colocalization is indicated. Mander's coefficients M1 and M2 measure the portion of the intensity in each channel that coincides with some intensity in the other channel. Mander's coefficient values are more than 0.5 also indicating colocalization [33]. In our study, further assessment of colocalization was done using the 2D scatter plot to quantify the overlap of the yellow (HSC70) and red (RFC) fluorescences from the confocal images. For L1210/0 cells in the absence of MTX, the pixels of yellow and red channels in the scatter plot are more highly scattered compared to MTX treatment groups (15 minutes and 24 hours), indicating lower correlation of the two proteins in the absence of MTX. This also indicates that HSC70 and RFC in the parental cells likely come within close proximity to each other in the presence of MTX increasing the possibility of molecular interaction between them. On the other hand, the pixels of yellow and red channels are less scattered showing higher correlation with or without MTX treatment in resistant L1210/DDP cells (Fig. 1C), which suggests this HSC70–RFC interaction may be compromised in L1210/DDP cells. As the data in Fig. 3 and Table 1 show, HSC70 and RFC colocalized in the cellular compartments of both L1210/0 and L1210/DDP cells treated with MTX, indicating by the values of Pearson's and Mander's coefficients which were higher than 0.5 as mentioned previously. These values showed that the extent of colocalization between HSC70 and RFC was lower in untreated cells in comparison to the cells treated with MTX in both cell lines. Interestingly, the sensitive L1210/0 cells grown without MTX treatments showed low Pearson's coefficients (0.231 ± 0.024) but higher overlap coefficients (0.681 ± 0.069). These findings indicate that the correlation between the distribution intensity of the two protein channels is low, but that the overlap of signals is high. Overlap coefficients generally represent the true degree of colocalization. This may suggest that the two proteins naturally colocalize together, and that MTX can further trigger the colocalization of the two proteins. Thus, by using the immunofluorescence labeled probes, we have shown that HSC70 and RFC colocalized in both L1210/0 and L1210/DDP cells. However, physical colocalization between the two proteins does not necessarily mean they interact – although proteins in close proximity are more likely to interact with each other [32]. In order to confirm the interaction between HSC70 and RFC, we used Duolink proximity ligation assays in this study. Discrete red fluorescent emissions were observed in both cell lines after MTX treatment. However, no fluorescent emissions were detected in the absence of MTX. The observation is consistent with the colocalization studies showing that cells grown in the absence of MTX had a lower degree of colocalization compared to the cells treated with MTX. This study suggests that MTX may facilitate protein complex formation and protein–protein interactions between HSC70 and RFC in L1210 cells. Furthermore, the fluorescent emissions were observed in different cellular locations in both L1210/0 and L1210/DDP cells. The fluorescent emissions were distributed in both the plasma membrane and the cytosol of the L1210/0 cells, whereas all fluorescent emissions were localized in the plasma membrane in L1210/DDP cells, suggesting the formation and interaction of HSC70– RFC complexes are restricted to the plasma membrane in resistant L1210/DDP cells. Therefore, these findings also suggest that formation of HSC70–RFC complexes is restricted in the plasma membrane and MTX cannot be transported into the cytosol in the resistant cells. These results are also consistent with the results of earlier studies using radioaffinity and photoaffinity analogues of MTX by Price et al., which indicated MTX is transferred from the 66–68 kDa protein to the subsequent carriers in L1210/0 cells [6,7]. We further identified this 66–68 kDa protein as HSC70 [10]. The basic structure of RFC includes 12 mostly hydrophobic transmembrane domains with a large central cytosolic loop connecting transmembrane domains 6 and 7, and cytosolic facing amino- and carboxyl-terminus [20,21,34]. HSC70 is a 70 kDa HSC protein. The murine HSC70 protein comprises 646 amino acids and its structure includes three basic parts a 44 kDa amino-terminal adenosine triphosphatase (ATPase) domain, an 18 kDa binding domain, and a 10 kDa carboxyl terminal domain which is also designated as the “lid” domain [18]. The size and structure of HSC70 does not share any similarities with other well identified MTX binding proteins or transporters. Thus, the HSC70 protein located in the membrane may act as a novel MTX transporter, interacting or cooperating with other known MTX transports such as RFC in L1210 cells. The Duolink proximity ligation assays used in the current study showed that the HSC70–RFC complex is possibly involved in shuttling MTX from the plasma membrane into the cytosol of L1210/0 cells. Therefore, the HSC70–RFC complex is likely to assist in the efficient transport of chemotherapeutic agents into these cells. The formation of these HSC70–RFC complexes may have been compromised in the resistant L1210/DDP cells, which partially explains the MTX resistance in the cells. Based on the finding from these studies, MTX uptake may be disrupted at the cellular plasma membrane. HSC70 may act as a carrier or transporter and as part of the membrane shuttle system involved in intracellular trafficking of MTX in L1210 cells. This property may be abnormal in the resistant L1210/DDP cells.
Consistent with the immunofluorescence confocal microscopy results, Western blotting assay also showed the decreased expression of membrane localized RFC in the resistant L1210/DDP cells (data not shown). Defective transport of MTX due to decreased expression of RFC may be responsible for MTX resistance in acute lymphocytic leukemia patients [35]. However, Bhushan et al. previously found that only a two-fold reduction in MTX uptake in L1210/DDP cells was present when compared to L1210/0 cells. The two-fold MTX uptake reduction could not fully explain the large CDDP– MTX cross resistance in L1210/DDP cells previously found [8]. The resistance observed in L1210/DDP cells led us to further explore other mechanisms mediating MTX resistance in L1210 cells. In our previous studies, we used total cell lysates from both cell lines in MTX– agarose beads binding assay to confirm HSC70 as an MTX binding protein [10]. In this study, we compared the MTX binding ability of HSC70 between the two cell lines using a larger amount of MTX agarose beads and a smaller but equivocal amount of protein samples. We found that HSC70 from the resistant L1210/DDP cells, either in membrane or cytosol fraction, had less binding ability compared with HSC70 from the parental L1210/0 cells. These data suggest that the binding properties of HSC70 are compromised in the resistant cells (Fig. 5). We have reached this conclusion because HSC70 is equally transcribed and translated in sensitive and resistant cells, in membrane and cytosol fractions (Fig. 3 and Appendix S1: Supplementary Fig. S2), and there is no Hspa8 gene mutation in L1210/ DDP cells, as described earlier. We further investigated the differences in the post-translational modifications of HSC70 between the two cell lines. Bhushan et al. previously identified the 66–68 kDa protein as a tyrosine phosphorylated protein [8]. We further confirmed that HSC70, the 66–68 kDa protein, in L1210/0 cells is a tyrosine phosphorylated protein. We also showed by Western blotting and immunoprecipitation assays that the tyrosine phosphorylation status is altered in the L1210/DDP cells (Fig. 3). The studies of comparison of tyrosine phosphorylation by Western blotting immunoprecipitation indicate that tyrosine phosphorylation is relevant to MTX resistance, and HSC70 is one of the tyrosine phosphorylated proteins that may be involved in MTX resistance. In addition, a general tyrosine kinase inhibitor genistein significantly enhanced the resistance of L1210/0 cells to MTX (Fig. 4). The fact that HSC70 from L1210/DDP cells has less MTX binding ability and less tyrosine phosphorylation of HSC70 compared to the parent L1210/0 cells suggests the possible relationship between tyrosine phosphorylation of HSC70 and MTX binding property. Bioinformatics analysis suggests several tyrosine sites such as tyrosines 41, 288, 431 and 525 have greater potential to be phosphorylated in HSC70 (Appendix S1: Supplementary Fig. S1). Specifically, Scansite identified tyrosine 288 in the mouse HSC70 protein may be present in an SH2 motif and the final sequence of 0.4162 with a percentage of 0.134 suggests it is a highly predictive inquiry (Appendix S1: Supplementary Fig. S1A, B). Tyrosine 288 is located in the ATPase domain of HSC70, which is involved in MTX binding [10]. The results obtained from informatics tools are helpful to identify putative tyrosine phosphorylation sites and the catalytic tyrosine kinases, however, they are only computer simulated predictive and neither final nor conclusive results. Therefore, in order to characterize the function of tyrosine 288 in HSC70, we carried out a site directed mutagenesis study, by mutating the tyrosine amino acids at 288 and 525 into phenylalanine amino acids and performed MTX binding assays with these mutant HSC70 proteins. The results suggest that tyrosine 288 is likely important in controlling the binding affinity of HSC70 to MTX. This was exhibited by the mutant Y288F HSC70 protein which showed less MTX binding ability compared to the original HSC70 and mutant Y525F HSC70 proteins (Fig. 6). KinasePhos analysis showed phosphorylation of Y288 and Y431 is likely catalyzed by the insulin receptor, and that phosphorylation of Y525 is likely catalyzed by the spleen tyrosine kinase (Syk) (Appendix S1: Supplementary Fig. S1C). A study by Chen et al. also found that insulin directly increased the level of HSC70 in cultured cardiomyocytes and down-regulation of HSC70 in diabetic myocardium was regulated by the deficiency of insulin [36]. Since insulin exerts its effects via binding and activation of the insulin receptor, which is a tyrosine kinase receptor, there may be some potential relationship between insulin, insulin receptors, and HSC70 phosphorylation. In addition, we also identified RFC as a tyrosine phosphorylated protein in L1210 cells by immunoprecipitation assays (data not shown). Other studies have suggested certain tyrosine sites in RFC and tyrosine kinases are important in regulating the functions of RFC, however, more studies need to be completed in order to characterize the roles of tyrosine phosphorylation of RFC in L1210 cells. A special area of interest would be how RFC interacts with HSC70 and regulates CDDP–MTX cross resistance [37,38].
From the results of the tyrosine phosphorylation status of HSC70 in the membrane fraction of sensitive L1210/0 and resistant L1210/DDP cells by Western blot (Fig. 3B), we can see the differences in protein bands. In addition to the major 70 kDa band absent in the resistant cells, we can also see the differences in other protein bands especially in the lower molecular weight range, suggesting smaller proteins may have different tyrosine phosphorylation statuses in sensitive and resistant cells. Price et al. previously showed MTX can be transported to a 48 kDa integral membrane protein, and later to smaller cytosolic proteins during its cellular transportation [6,7]. From the results of our tyrosine phosphorylation studies, in addition to HSC70, other proteins with different phosphorylation statuses may also present in MTX resistant cells and function in regulating MTX transportation.
P-gp is a well-characterized ATP-binding cassette transporter of the MDR/TAP subfamily which has been extensively studied [39,40]. It works as a transporter which can pump the chemotherapeutic agents out of the cells, thus leading to drug resistance [41]. Studies showed that HSC70 can interact with the nucleotide binding domain of P-gp and may participate in the protein's folding [42]. In order to explore other possible mechanisms which may cause CDDP– MTX cross resistance in the L1210 cells, we also measured the P-gp levels of L1210/0 and L1210/DDP cells by Western blotting assay. The results showed that P-gp had slightly higher expression in L1210/DDP cells in comparison to L1210/0 cells (Appendix S1: Supplementary Fig. S3). Thus, besides the decreased expression of RFC in the plasma membrane and abnormal function of HSC70 in L1210/DDP cells, additional molecules and mechanism may be involved in contributing to DDP–MTX cross resistance in L1210/DDP cells. Specifically, we observed that Y288F mutation reduces the interaction between HSC70 and MTX suggesting tyrosine phosphorylation of Y288 in HSC70 as an important element in binding to MTX. In addition, Y288F mutation reduces tyrosine phosphorylation of HSC70. The reduced tyrosine phosphorylation may interfere with the interaction between HSC70 and RFC, leading to the occurrence of MTX resistance in L1210 cells and other types of cancer cells. In order to fully understand the MTX resistant mechanism, more in depth studies are needed in several aspects including other effects of the tyrosine mutation in HSC70, other types of phos-phorylation (serine and threonine) of HSC70, phosphorylation regulation of HSC70 and RFC, the interaction of HSC70 with other molecules, and kinases related to the catalyzation of the phosphorylation process.
In summary, the studies on HSC70's regulation of MTX transportation can be described in the proposed model shown in Fig. 7. HSC70 is a membrane associated protein which interacts with RFC facilitating the transport of MTX into the cell. HSC70 in the cytosol may also be important in shuttling MTX to its intracellular targets after MTX has been transported into a cell. Tyrosine phosphorylation of HSC70 is likely important in controlling the processes of MTX binding and transportation. The abnormal transport of MTX via the HSC70–RFC transport system, or the changes of the tyrosine phosphorylation status of HSC70, may lead to the dysfunction of MTX transportation. This further contributes to MTX resistance in L1210/0 cells. In conclusion, our studies showed that HSC70 is likely an MTX interacting protein which interacts or cooperates with RFC in L1210 cells. Our study also reveals that tyrosine phosphorylation of HSC70 may play an important role in the CDDP–MTX cross resistance in the L1210/DDP cells. Therefore, HSC70–RFC complexes and tyrosine phosphorylation of HSC70 may become potential biomarkers to identify cross resistance in leukemia patients, as well as the potential therapeutic targets for drug discovery and development in leukemia therapy.
Fig. 7.

The proposed mode of transporting MTX in HSC70–RFC system.
Supplementary Material
Acknowledgments
We thank Dr. Matthew Ndonwi and Dr. Cara L. Lunn for their critical review of this manuscript. The work was supported by National Institutes of Health Grant P20 RR16454 and P20 GM103408 from the IDeA Networks of Biomedical Research Excellence (INBRE) program of the National Center for Research Resources, Mountain States Tumor and Medical Research Institute American Cancer Society Grant #DHP170, and 2009 Graduate Student Seed Grant from Molecular Research Core Facility at Idaho State University.
Abbreviations
- CDDP
cisplatin
- DHFR
dihydrofolate reductase
- HSC70
heat shock cognate protein 70
- HSP70
heat shock protein 70
- MDR
multidrug resistance
- MTX
methotrexate
- RFC
reduced folate carrier
- P-gp
P-glycoprotein
Footnotes
Conflict of interest: The authors declare no conflict of interest.
Appendix: Supplementary material: Supplementary data to this article can be found online at doi:10.1016/j.canlet.2014.11.036.
References
- 1.Vickers PJ, Dickson RB, Shoemaker R, Cowan KH. A multidrug-resistant MCF-7 human breast cancer cell line which exhibits cross-resistance to antiestrogens and hormone-independent tumor growth in vivo. Mol Endocrinol. 1988;2:886–892. doi: 10.1210/mend-2-10-886. [DOI] [PubMed] [Google Scholar]
- 2.Volk EL, Rohde K, Rhee M, McGuire JJ, Doyle LA, Ross DD, et al. Methotrexate cross-resistance in a mitoxantrone-selected multidrug-resistant MCF7 breast cancer cell line is attributable to enhanced energy-dependent drug efflux. Cancer Res. 2000;160:3514–3521. [PubMed] [Google Scholar]
- 3.Gore ME, Fryatt I, Wiltshaw E, Dawson T, Robinson BA, Calvert AH. Cisplatin/carboplatin cross-resistance in ovarian cancer. Br J Cancer. 1989;60:767–769. doi: 10.1038/bjc.1989.356. [DOI] [PMC free article] [PubMed] [Google Scholar]
- 4.Hamaguchi K, Godwin AK, Yakushiji M, O'Dwyer PJ, Ozols RF, Hamilton TC. Cross-resistance to diverse drugs is associated with primary cisplatin resistance in ovarian cancer cell lines. Cancer Res. 1993;53:5225–5232. [PubMed] [Google Scholar]
- 5.Wroblewski HD, Bhushan A, Xuan Y, Brinton BT, Tritton TR, Hacker MP. Investigations on the mechanisms of methotrexate resistance in a cisplatin-resistant L1210 murine leukemia cell subline. Cancer Chemother Pharmacol. 1996;37:337–342. doi: 10.1007/s002800050394. [DOI] [PubMed] [Google Scholar]
- 6.Price EM, Freisheim JH. Photoaffinity analogues of methotrexate as folate antagonist binding probes. 2. Transport studies, photoaffinity labeling, and identification of the membrane carrier protein for methotrexate from murine L1210 cells. Biochemistry. 1987;26:4757–4763. doi: 10.1021/bi00389a024. [DOI] [PubMed] [Google Scholar]
- 7.Price EM, Ratnam M, Rodeman KM, Freisheim JH. Characterization of the methotrexate transport pathway in murine L1210 leukemia cells: involvement of a membrane receptor and a cytosolic protein. Biochemistry. 1988;27:7853–7858. doi: 10.1021/bi00420a040. [DOI] [PubMed] [Google Scholar]
- 8.Bhushan A, Wroblewski D, Xuan Y, Tritton TR, Hacker MP. Correlation of altered tyrosine phosphorylation with methotrexate resistance in a cisplatin-resistant subline of L1210 cells. Biochem Pharmacol. 1996;51:477–482. doi: 10.1016/0006-2952(96)84208-0. [DOI] [PubMed] [Google Scholar]
- 9.Bhushan A, Hacker MP, Tritton TR. Collateral methotrexate resistance in cisplatin-selected murine leukemia cells. Braz J Med Biol Res. 1999;32:827–833. doi: 10.1590/s0100-879x1999000700005. [DOI] [PubMed] [Google Scholar]
- 10.Liu T, Dean A, Ashwini S, Sheridan PP, Bhushan A, Lai JCK, et al. Identification and characterization of a 66-68-kDa protein as a methotrexate-binding protein in murine leukemia L1210 cells. Cell Stress Chaperones. 2013;18:223–234. doi: 10.1007/s12192-012-0376-9. [DOI] [PMC free article] [PubMed] [Google Scholar]
- 11.Place SP, Hofmann GE. Comparison of Hsc70 orthologs from polar and temperate notothenioid fishes: differences in prevention of aggregation and refolding of denatured proteins. Am J Physiol Regul Integr Comp Physiol. 2005;288:R1195–R1202. doi: 10.1152/ajpregu.00660.2004. [DOI] [PubMed] [Google Scholar]
- 12.Arispe N, De Maio A. ATP and ADP modulate a cation channel formed by Hsc70 in acidic phospholipid membranes. J Biol Chem. 2000;275:30839–30843. doi: 10.1074/jbc.M005226200. [DOI] [PubMed] [Google Scholar]
- 13.Kose S, Furuta M, Koike M, Yoneda Y, Imamoto N. The 70-kD heat shock cognate protein (hsc70) facilitates the nuclear export of the import receptors. J Cell Biol. 2005;171:19–25. doi: 10.1083/jcb.200506074. [DOI] [PMC free article] [PubMed] [Google Scholar]
- 14.Kodiha M, Chu A, Lazrak O, Stochaj U. Stress inhibits nucleocytoplasmic shuttling of heat shock protein hsc70. Am J Physiol Cell Physiol. 2005;289:C1034–C1041. doi: 10.1152/ajpcell.00590.2004. [DOI] [PubMed] [Google Scholar]
- 15.Gebauer M, Melki R, Gehring U. The chaperone cofactor Hop/p60 interacts with the cytosolic chaperonin-containing TCP-1 and affects its nucleotide exchange and protein folding activities. J Biol Chem. 1998;273:29475–29480. doi: 10.1074/jbc.273.45.29475. [DOI] [PubMed] [Google Scholar]
- 16.Höfeld J, Minami Y, Hartl FU. Hip, a novel cochaperone involved in the eukaryotic Hsc70/Hsp40 reaction cycle. Cell. 1995;83:589–598. doi: 10.1016/0092-8674(95)90099-3. [DOI] [PubMed] [Google Scholar]
- 17.Minam Y, Höhfeld J, Ohtsuka K, Hart FU. Regulation of the heat-shock protein 70 reaction cycle by the mammalian DnaJ homolog, Hsp40. J Biol Chem. 1996;927:19617–19624. doi: 10.1074/jbc.271.32.19617. [DOI] [PubMed] [Google Scholar]
- 18.Liu T, Daniels CK, Cao S. Comprehensive review on the HSC70 functions, interactions with related molecules and involvement in clinical diseases and therapeutic potential. Pharmacol Ther. 2012;136:354–374. doi: 10.1016/j.pharmthera.2012.08.014. [DOI] [PubMed] [Google Scholar]
- 19.Liu M, Ge Y, Cabelof DC, Aboukamee A, Heydari AR, Mohammad R, et al. Structure and regulation of the murine reduced folate carrier gene: identification of four noncoding exons and promoters and regulation by dietary folates. J Biol Chem. 2005;280:5588–5597. doi: 10.1074/jbc.M412662200. [DOI] [PubMed] [Google Scholar]
- 20.Matherly LH, Hou Z, Deng Y. Human reduced folate carrier: translation of basic biology to cancer etiology and therapy. Cancer Metastasis Rev. 2007;26:111–128. doi: 10.1007/s10555-007-9046-2. [DOI] [PubMed] [Google Scholar]
- 21.Kaufman Y, Drori S, Cole PD, Kamen BA, Sirota J, Ifergan I, et al. Reduced folate carrier mutations are not the mechanism underlying methotrexate resistance in childhood acute lymphoblastic leukemia. Cancer. 2004;100:773–782. doi: 10.1002/cncr.20018. [DOI] [PubMed] [Google Scholar]
- 22.Trippett TM, Garcia S, Manova K, Mody R, Cohen-Gould L, Flintoff W, et al. Localization of a human reduced folate carrier protein in the mitochondrial as well as the cell membrane of leukemia cells. Cancer Res. 2001;61:1941–1947. [PubMed] [Google Scholar]
- 23.Zhao R, Gao F, Liu L, Goldman ID. The reduced folate carrier in L1210 murine leukemia cells is a 58-kDa protein. Biochim Biophys Acta. 2000;1466:7–10. doi: 10.1016/s0005-2736(00)00190-5. [DOI] [PubMed] [Google Scholar]
- 24.Leung SM, Hightower LE. A 16-kDa protein functions as a new regulatory protein for Hsc70 molecular chaperone and is identified as a member of the Nm23/nucleoside diphosphate kinase family. J Biol Chem. 1997;272:2607–2614. doi: 10.1074/jbc.272.5.2607. [DOI] [PubMed] [Google Scholar]
- 25.Otto H, Dreger M, Bengtsson L, Hucho F. Identification of tyrosine-phosphorylated proteins with the nuclear envelope. Eur J Biochem. 2001;268:420–428. doi: 10.1046/j.1432-1033.2001.01901.x. [DOI] [PubMed] [Google Scholar]
- 26.Egerton M, Moritz RL, Druker B, Kelso A, Simpson RJ. Identification of the 70kD heat shock cognate protein (Hsc70) and alpha-actinin-1 as novel phosphotyrosine-containing proteins in T lymphocytes. Biochem Biophys Res Commun. 1996;224:666–674. doi: 10.1006/bbrc.1996.1082. [DOI] [PubMed] [Google Scholar]
- 27.Obenauer JC, Cantley LC, Yaffe MB. Scansite 2.0: proteome-wide prediction of cell signaling interactions using short sequence motifs. Nucleic Acids Res. 2003;31:3635–3641. doi: 10.1093/nar/gkg584. [DOI] [PMC free article] [PubMed] [Google Scholar]
- 28.Yaffe MB, Leparc GG, Lai J, Obata T, Volinia S, Cantley LC. A motif-based profile scanning approach for genome-wide prediction of signaling pathways. Nat Biotechnol. 2001;19:348–353. doi: 10.1038/86737. [DOI] [PubMed] [Google Scholar]
- 29.Huang HD, Lee TY, Tzeng SW, Horng JT. KinasePhos: a web tool for identifying protein kinase-specific phosphorylation sites. Nucleic Acids Res. 2005;33:W226–W229. doi: 10.1093/nar/gki471. [DOI] [PMC free article] [PubMed] [Google Scholar]
- 30.Blom N, Gammeltoft S, Brunak S. Sequence and structure-based prediction of eukaryotic protein phosphorylation sites. J Mol Biol. 1999;294:1351–1362. doi: 10.1006/jmbi.1999.3310. [DOI] [PubMed] [Google Scholar]
- 31.Oheim M, Li D. Imaging cellular and molecular biological functions: principles and practice. In: Shorte SL, Frischknecht F, editors. Quantitative Colocalisation Imaging: Concepts, Measurements, and Pitfalls. Springer; Berlin, Heidelberg: 2007. pp. 117–155. [Google Scholar]
- 32.Söderberg O, Gullberg M, Jarvius M, Ridderstråle K, Leuchowius KJ, Jarvius J, et al. Direct observation of individual endogenous protein complexes in situ by proximity ligation. Nat Methods. 2006;3:995–1000. doi: 10.1038/nmeth947. [DOI] [PubMed] [Google Scholar]
- 33.Zinchuk V, Grossenbacher-Zinchuk O. Quantitative colocalization analysis of confocal fluorescence microscopy images. Curr Protoc Cell Biol. 2011;Chapter 4 doi: 10.1002/0471143030.cb0419s52. [DOI] [PubMed] [Google Scholar]
- 34.Sadlish H, Williams FMR, Flintoff WF. Cytoplasmic domains of the reduced folate carrier are essential for trafficking, but not function. Biochem J. 2002;364:777–786. doi: 10.1042/BJ20011361. [DOI] [PMC free article] [PubMed] [Google Scholar]
- 35.Gorlick R, Goker E, Trippett T, Steinherz P, Elisseyeff Y, Mazumdar M, et al. Defective transport is a common mechanism of acquired methotrexate resistance in acute lymphocytic leukemia and is associated with decreased reduced folate carrier expression. Blood. 1997;89:1013–1018. [PubMed] [Google Scholar]
- 36.Chen HS, Jia J, Su HF, Lin HD, Chen JW, Lin SJ, et al. Downregulation of the constitutively expressed Hsc70 in diabetic myocardium is mediated by insulin deficiency. J Endocrinol. 2006;190:433–440. doi: 10.1677/joe.1.06692. [DOI] [PubMed] [Google Scholar]
- 37.Hou Z, Stapels SE, Haska CL, Matherly LH. Localization of a substrate binding domain of the human reduced folate carrier to transmembrane domain 11 by radioaffinity labeling and cysteine-substituted accessibility methods. J Biol Chem. 2005;280:36206–36213. doi: 10.1074/jbc.M507295200. [DOI] [PubMed] [Google Scholar]
- 38.Nabokina SM, Ma TY, Said HM. Mechanism and regulation of folate uptake by human pancreatic epithelial MIA PaCa-2 cells. Am J Physiol Cell Physiol. 1999;287:C142–C148. doi: 10.1152/ajpcell.00011.2004. [DOI] [PubMed] [Google Scholar]
- 39.Frank NY, Pendse SS, Lapchak PH, Margaryan A, Shlain D, Doeing C, et al. Regulation of progenitor cell fusion by ABCB5 P-glycoprotein, a novel human ATP-binding cassette transporter. J Biol Chem. 2003;278:47156–47165. doi: 10.1074/jbc.M308700200. [DOI] [PubMed] [Google Scholar]
- 40.Choi CH. ABC transporters as multidrug resistance mechanisms and the development of chemosensitizers for their reversal. Cancer Cell Int. 2005;5:30. doi: 10.1186/1475-2867-5-30. [DOI] [PMC free article] [PubMed] [Google Scholar]
- 41.Lehne G. P-glycoprotein as a drug target in the treatment of multidrug resistant cancer. Curr Drug Targets. 2000;1:85–99. doi: 10.2174/1389450003349443. [DOI] [PubMed] [Google Scholar]
- 42.Loo TW, Clarke DM. P-glycoprotein. Associations between domains and between domains and molecular chaperones. J Biol Chem. 1995;270:21839–21844. doi: 10.1074/jbc.270.37.21839. [DOI] [PubMed] [Google Scholar]
Associated Data
This section collects any data citations, data availability statements, or supplementary materials included in this article.