

Abstract
The genome of the white-throated sparrow (Zonotrichia albicollis) contains an inversion polymorphism on chromosome 2 that is linked to predictable variation in a suite of phenotypic traits including plumage color, aggression, and parental behavior. Differences in gene expression between the two color morphs, which represent the two common inversion genotypes (ZAL2/ZAL2 and ZAL2/ZAL2m), are therefore of potential interest toward understanding the molecular underpinnings of these phenotypes. To identify genes that are differentially expressed between the two morphs and correlated with behavior, we quantified both behavior and brain gene expression in a population of free-living white-throated sparrows. We quantified behavioral responses to simulated territorial intrusions (STIs) early during the breeding season. In the same birds, we then performed a transcriptome-wide analysis of gene expression in two regions, the medial amygdala and hypothalamus. Both regions are part of a ‘social behavior network’, which is rich in steroid hormone receptors and previously linked with territorial behavior. Using network analyses, we identified modules of genes that were correlated with both morph and STI-induced singing behavior. The majority of these genes were located within the inversion, demonstrating the profound effect the inversion has on the expression of genes captured by the rearrangement. Gene pathway analyses revealed that in the medial amygdala, the most prominent pathways were those related to steroid hormone receptor activity. Within these pathways, the only gene encoding such a receptor was ESR1 (estrogen receptor alpha). Our results thus suggest that ESR1 and related genes are important for behavioral differences between the morphs.
Keywords: behavioral polymorphism, RNA-seq, social behavior, weighted gene co-expression network analysis (WGCNA), estrogen receptor alpha
Introduction
The white-throated sparrow (Zonotrichia albicollis), a common North American songbird, provides a unique model to study the relationship between genes and behavior because it exhibits a chromosomal polymorphism linked to a behavioral polymorphism. In this species, the second chromosome occurs in two arrangements, ZAL2 and ZAL2m (Thorneycroft, 1975). These arrangements differ at a minimum by a pair of pericentric inversions that span ~98 Mb, representing about 10% of the genome (Thomas et al., 2008). Inversions can lead to changes in genetic sequences that can have profound effects on phenotype. Although inversion polymorphisms have been described in multiple species, from Drosophila to humans (Kidd et al., 2008; Ma & Amos 2012; White, 1977), the consequences of such rearrangements are not completely understood. The white-throated sparrow provides a vertebrate model of an inversion polymorphism that clearly affects the brain and behavior.
Within a population, approximately half of the individuals of both sexes are heterozygous for the chromosomal arrangement (ZAL2/ZAL2m) (Thorneycroft, 1975). These individuals have contrasting white and black stripes on the crown and are members of the “white-striped” (WS) morph (Lowther, 1961). The other half of the population is homozygous for the ZAL2 arrangement (ZAL2/ZAL2), a genotype that results in a “tan-striped” (TS) phenotype characterized by tan and brown stripes on the crown (Lowther 1961). Birds homozygous for ZAL2m are extremely rare, occurring at a frequency of roughly 1 in 500 (Horton et al., 2013). Their scarcity is due at least in part to a disassortative mating system; within a population, nearly all breeding pairs consist of one TS and one WS bird (Lowther 1961). WS male-WS female pairings, which are necessary to create a ZAL2m/ZAL2m homozygote, make up less than 2.5% of breeding pairs (Falls & Kopachena, 2010). This mating system maintains the ZAL2m arrangement in the population and keeps the frequency of ZAL2m/ZAL2m homozygotes very low. Because of its near-constant state of heterozygosity, recombination within the ZAL2m inversions is profoundly suppressed (Davis et al., 2011; Huynh et al., 2011). Limited gene flow between the ZAL2 and ZAL2m haplotypes has caused the accumulation of single nucleotide and insertion/deletion polymorphisms and thus genetic differentiation of the rearranged region. Davis et al. (2011) estimated that there are on the order of 1870 nonsynonymous differences between the ZAL2 and ZAL2m alleles inside the inversions, affecting approximately 1,100 genes. This genetic differentiation between the two chromosomes must be responsible for the phenotypic differences observed between the two plumage morphs.
The chromosomal rearrangement is of particular interest because it affects social behaviors (Maney, 2008; Tuttle, 2003). Individuals with the ZAL2m chromosome engage in more aggression and less parental care than individuals without it (Falls & Kopachena, 2010). For example, WS birds of both sexes sing more and are thus more vocally aggressive than their TS counterparts (Horton et al., 2014b; Kopachena & Falls, 1993a; Lowther, 1962). TS birds, on the other hand, provision nestlings more frequently than WS birds; this effect is especially pronounced in males (Horton & Holberton, 2010; Horton et al., 2014b; Knapton & Falls, 1983; Kopachena & Falls, 1993b;). WS males seek out more extra-pair copulations than TS males, who instead guard their mates more closely (Formica & Tuttle, 2009; Tuttle, 2003). The two phenotypes represent alternative reproductive strategies (Trivers, 1972), in which individuals maximize investment in competition and mate finding or investment in mate-guarding and parenting (Tuttle, 2003). Because the strategy depends on the presence or absence of the ZAL2m chromosomal arrangement, this polymorphism represents a powerful genetic target with which to understand the molecular mechanisms underlying the associated behaviors.
In this study, we employed a genome-wide approach to identify genes associated with behavior and the chromosomal rearrangement. First, we measured natural variation in aggressive responses to simulated territorial intrusions (STIs) in a free-living population of male white-throated sparrows early in the breeding season. We then generated and analyzed transcriptomes from two brain regions thought to be important for social behavior, namely the medial amygdala (MeA, formerly called nucleus taeniae in birds; for a review of its homology see O’Connell & Hoffman, 2011) and the hypothalamus (HYP). We chose these regions because they are part of a well-known social behavior network that responds during social encounters (Goodson et al., 2005; Maney et al., 2008). In the MeA and HYP in particular, the expression of genes that confer sensitivity to sex steroids, such as estrogen receptor alpha (ERα), was already known to be correlated with territorial responses (Rosvall et al., 2012) and to differ between the morphs (Horton et al., 2014a). Our goal in the current study was to expand our understanding of the genetic basis of this behavioral polymorphism beyond a handful of genes. Because the neurochemical and neuroanatomical pathways that regulate social behaviors such as aggression rely on the expression of many genes (reviewed in Anholt & Mackay, 2012; Nelson & Chiavegatto, 2001), we employed a network-based approach to identify groups of co-regulated genes (modules) with expression that is correlated with plumage morph, song rate, or physical aggression. Toward this goal, we used weighted gene co-expression network analysis (WGCNA) (Zhang & Horvath, 2005), which has previously been used to relate gene expression to physiological and behavioral traits (Drnevich et al., 2012; Filteau et al., 2013; Fuller et al., 2007; Ghazalpour et al., 2006; Hilliard et al., 2012; Langfelder & Horvath, 2008). We then examined the gene modules to identify candidate genes and molecular pathways linked to aggressive behavior. By taking this whole transcriptome approach, we aimed to better understand the molecular mechanisms underlying territorial aggression and, more generally, the effects of inversion polymorphisms on gene expression.
Materials and Methods
Ethical note
All studies were done with the approval of Emory University Institutional Animal Care and Use Committee, and with appropriate state (Maine Inland Fisheries and Wildlife and federal (U.S. Geological Survey and U.S. Fish and Wildlife Service) permits, and with permission from the Forest Society of Maine.
Behavioral Assay and Data Collection
Our study population consisted of free-living white-throated sparrows in the Hemlock Stream Forest, Argyle, Maine. So that we could correlate behavior with gene expression, we performed behavioral tests prior to tissue collection. We quantified territorial aggression during the peak of territorial behavior (7 May–3 June), after pair formation and territory establishment but prior to or early in the stage of incubation (Falls & Kopachena, 2010). Prior to behavioral observations, birds were captured in mist nets using conspecific song playback and banded with color bands and aluminum USGS identification bands. At the time of capture, morph was determined based on plumage color (Watt, 1986), and sex was determined by the presence or absence of a cloacal protuberance or brood patch. Morph was later confirmed by PCR genotyping of the DSE locus (Thomas et al., 2008; Horton et al., 2013), and sex confirmed by gonads during tissue collection (see below).
Simulated territorial intrusions (STIs) were performed as described by Horton et al. (2014b). Briefly, at least three days after they were banded, each resident male was exposed to a caged, live male decoy placed onto his territory while conspecific song was played via an adjacent speaker. We used four different male decoys, two of each morph, and four song exemplars chosen from those used in the previous study. In this species, behavioral responses to STI can depend on the morph of the intruder (Horton et al., 2012; Kopachena & Falls, 1993). To control for this potential variation, we performed two STIs on each male, on consecutive days but at the same time of day (0630–1230 Eastern Daylight Time, EDT), presenting either a TS or WS decoy. The morph of the intruder was counterbalanced such that half the pairs were presented with a TS decoy first, and the other half were presented with a WS decoy first. For all analyses, data on behavioral responses were averaged across the two STIs for each individual. Behavioral data were collected from 9 TS males and 10 WS males.
Each STI was monitored by two observers and behaviors were recorded as previously described (Horton et al., 2014b). After the male arrived in (or at) the arena (i.e. was detected within 30 m of the decoy), playback continued for ten minutes. We recorded behaviors indicative of territorial aggression in Zonotrichia species. The physical behaviors we measured were latency to approach (the time from start of playback until the resident male arrived in (or at) the arena), number of directed flights over the decoy, time spent within 5 m and within 2 m of the decoy, and distance of closest approach to the decoy (Kopachena & Falls, 1993a; Wingfield & Hahn 1994). We recorded three types of vocalizations that commonly occur during agonistic encounters and that signal aggression (chip calls, trills, and songs) (Collins & Houtman, 1999; Falls & Kopachena, 2010).
Statistical analysis
Because the behavioral data were not normally distributed (based on Shapiro-Wilk tests), we tested for morph differences in behavior using the Wilcoxon Rank Sum test. To reduce the number of comparisons, we used principal component analysis (PCA) to construct a composite physical aggression score (PC1) from three physical behaviors (sensu Horton et al., 2012). The behaviors used in the PCA were time within 2 m, closest approach, and flights. We chose to exclude time in 5 m because variation in this measure within the sample population was low. Physical latency scores were not recorded for trials in which the resident male was within the area at the start of playback. Because PCA does not tolerate missing data, we did not include latency in the PCA. The data on closest approach were square root transformed to achieve normality prior to PCA calculations. Statistical tests and PCA were done using JMP Statistic software (SAS, Cary NC).
Tissue collection and RNA extraction
Because we were interested in identifying the genes and networks related to the propensity and capacity to respond to challenge rather than those induced by the act of responding and the challenge itself, we collected birds on the day following the second STI. Nineteen males (10 WS and 9 TS) were collected the day after the second STI using mist nets and song playback. Playbacks were started between 0700–1400 EDT, which was 5.35 ± 2.03 hr. after sunrise, and were balanced so that birds of both morphs were collected at earlier and later time points. Average latency to capture was 2.79 ± 0.14 min after the onset of the song playback, with a maximum of 4.0 min. Immediately after capture, birds were sacrificed by isoflurane overdose and brains were rapidly dissected, frozen on dry ice, and stored at −80°C. At the end of the field portion of the study, tissues were shipped to Atlanta on dry ice and stored at −80°C until sectioning. Brains were cryosectioned in the coronal plane at 300μm thickness and the regions of interest were microdissected from frozen sections using a 1.0 mm diameter punch tool (Fine Science Tools, Foster City, CA). The ventromedial telencephalon, which contained the medial amygdala (MeA), was sampled in each hemisphere in two consecutive sections for a total of 4 punches, which were pooled for RNA extraction (Fig. S1a). For most of these punches, MeA constituted the majority of the sampled tissue. For the hypothalamus (HYP), all punches were centered on the midline such that they contained tissue from both hemispheres. One punch was made immediately ventral to the anterior commissure and included the caudal portion of the medial preoptic area (POM), the paraventricular nucleus (PVN), and the anterior hypothalamus (AH) (Fig. S1b). A second punch was made ventral to the first and included the ventromedial hypothalamus (VMH). Both HYP punches were made in two consecutive 300μm sections for a total of 4 punches, which were pooled for RNA extraction. RNA was extracted using the Qiagen Allprep DNA/RNA micro kit with modification, as follows. Punches were homogenized in RLT plus + β-mercaptoethanol using a pellet mixer. An equal volume of phenol:chloroform:isoamyl alcohol (25:24:1) pH 7.5 was added to each sample. Samples were further homogenized by passing them through a Qiashredder column (Qiagen). Phases were separated by spinning for 15 min at 4°C, and the aqueous phase was collected and further processed according to the manufacturer’s protocol.
RNA-sequencing library prep
Library preparation and sequencing were done at the Emory Yerkes Nonhuman Primate Genomics Core. The quality of total RNA was assessed on an Agilent bioanalyzer instrument. RNAseq libraries were constructed using the Illumina TruSeq RNA Sample Preparation Kit v2 according to the manufacturer’s protocol. Briefly, polyadenylated transcripts were purified on oligo-dT magnetic beads, chemically fragmented, reverse transcribed using random hexamers and incorporated into barcoded cDNA libraries. Libraries were validated by microelectrophoresis, quantified, pooled and clustered on an Illumina TruSeq v3 flowcell. The clustered flowcell was sequenced on an Illumina HiSeq 1000 in 100-base paired end-read reactions. We obtained 11–22 million reads per sample.
Creation of an enhanced reference genome
The reference genome, downloaded from NCBI (Zonotrichia albicollis 1.0.1, GCA_000385455.1, Tuttle et al., in review), was generated from a bird homozygous for the ZAL2 haplotype. In order to eliminate potential mapping bias against reads that originated from the ZAL2m chromosome, we created an enhanced reference genome that contained sequences representing both ZAL2 and ZAL2m haplotypes within the inversion. To create this enhanced version of the white-throated sparrow genome, we first performed a ~30x whole-genome shotgun sequencing of a ‘superwhite’ bird homozygous for the ZAL2m chromosome (Horton et al., 2013, SRA accession pending). Novoalign (novocraft.com, version 3.00.05) was used to map the reads to the reference genome using ‘-r RANDOM –I PE 510,150 -0 SAM’ option. To identify single nucleotide substitutions (SNPs) between the ZAL2 and ZAL2m chromosomes, Samtools (Li et al., 2009) was used to call SNPs between the reference genome and the superwhite genome. High-quality (genotype quality score = 99) homozygous non-reference SNPs were then used to generate alternative contigs representing ZAL2m sequences within the inversion (Supplemental File 1). To create these ZAL2m contigs, we first identified NCBI genome contigs that mapped to ZAL2 via orthology with zebra finch chromosome 3 (Davis et al., 2011; Romanov et al., 2011) based on sequence similarity and gene annotations. We then created ZAL2m versions of the contigs that mapped within the inversion using the GATK tool FastaAlternativeReferenceMaker (McKenna, et al., 2010). We also generated assemblies of rRNA and the mitochondrial genome derived from these whole-genome shotgun sequences (Supplemental Files 2–3). Our final enhanced reference genome was composed of the NCBI reference genome (Zonotrichia albicollis 1.0.1) plus ZAL2m versions of contigs located within the inversion, rRNAs, and a mitochondrial genome.
RNA-seq mapping and gene annotation
RNA-seq reads were mapped to the enhanced version of the white-throated sparrow reference genome described above. We used the STAR aligner (Dobin et al., 2013) to map the reads to the modified reference allowing each read to map to at most 2 loci (out Filter Multimap Nmax = 2). Reads that did map within the inversion to both the reference and alternative contigs were then filtered to retain just the primary mapping location. All other dual mappings were excluded. Retained mappings to the alternate contigs were relabeled to conform to the unmodified reference contig names. Reads were assigned to genes using htseq-count (Anders et al., 2015) based on NCBI RefSeq annotations.
Network analysis
To identify groups of co-expressed genes (modules) correlated with both song rate and morph, we performed weighted gene co-expression network analysis (WGCNA) (Zhang & Horvath, 2005) for the MeA and HYP samples separately. Network analyses were performed using R version 3.1.1 (http://www.r-project.org) and functions in the WGCNA library version 1.41.1 (Langfelder & Horvath, 2008). Genes with unreliable expression (defined as 0 reads in more than half the samples) were removed from the dataset. This filtering did not selectively remove genes expressed only in one morph. Out of 3191 genes removed, 3185 of the genes had 0 reads in at least 3 TS and 3 WS samples and all of the genes removed had 0 reads in at least 1 TS and 1 WS sample. After this screen, 13,426 and 13,605 genes remained in the MeA and HYP datasets, respectively. Prior to network analysis, read counts were transformed using the ‘variance Stabilizing Transformation’ function in the DESeq2 package for R (Love et al., 2014). We performed WGCNA in R using functions in the WGCNA library (Langfelder and Horvath, 2008). To create the weighted gene co-expression network, a weighted adjacency matrix was created for all pairwise gene comparisons across samples based on the absolute value of the Pearson correlation raised to the power β. The power β was determined empirically by examining the scale-free fit across a range of powers. The adjacency matrix was transformed into a Topological Overlap (TO) Matrix. A dendogram was constructed using average linkage hierarchical clustering based on the distance measure calculated as 1-TO. Next, modules were identified by cutting the dendrogram using the dynamic Tree Cut algorithim (Langfelder et al., 2008). Finally, modules with similar expression patterns were merged. The algorithm labels each module with an arbitrarily assigned color; the grey module is reserved for genes not assigned to a proper module. The WGCNA function blockwise Modules was used to create the network and identify modules in one step. The function offers many choices of parameters for each step in the process. Using the scale-free topology criteria as described in Zhang and Hovarth (2005), the power β ωασ σετ το 4 and 7 for the MeA and HYP networks, respectively. Additional values used to create both the MeA and HYP networks were: TOM Type = unsigned, deep Split = 2, min Module Size = 30, reassign Threshold = 0, merge Cut Height = 0.25, and pam Respects Dendro = FALSE. All other parameters were left at default values.
Statistical analysis
The WGCNA program was used to calculate the module membership (MM) for each gene, which is the correlation between a gene’s expression profile and the module eigengene (ME, the first principal component of module gene expression). To identify modules composed of genes that were highly correlated with the trait of interest, we calculated Pearson correlation coefficients between MEs and traits of interest (morph, song rate, and PC1 for physical aggression). We chose song rate (number of songs during the 10-min STI) as a measure of vocal aggression because song is the primary vocalization used to deter territorial intruders (Falls, 1988) and the rate at which it is used in territorial defense differs dramatically between morphs in our study population (Horton et al., 2014b, and Fig. 1). We also calculated gene significance (GS) as the Pearson correlation coefficient between the expression of each gene and each trait or EGR1 expression. For correlation analyses, data on song rate were square root transformed to achieve normality. Pearson correlations were computed using the WGCNA ‘cor’ function. VisAnt (Hu et al., 2004) was used to visualize the networks represented by the top modules. Intramodular connectivity (kIN), used to identify well-connected genes, was calculated for each gene as the sum of its network connections with other module members. To compare MeA and HYP networks, the function module Preservation was used. This function computes preservation statistics for a test network (HYP) compared to a reference network (MeA). This function also computes gene membership overlap counts and Fisher’s exact test p-values between modules in each network.
Figure 1.
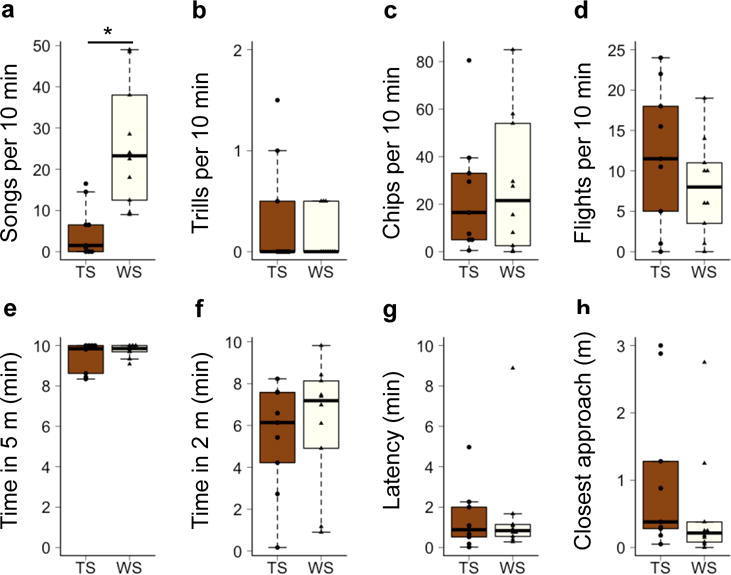
Behavioral responses to simulated territorial intrusions. Vocal measures of aggression were average (a) number of songs, (b) number of trills, and (c) number of chips recorded per 10-min STI. Measures of physical aggression were average (d) number of flights per 10-min STI, (e) time spent within 5 m, (f) time spent within 2 m, (g) latency, and (h) distance of closest approach. Scores for individual birds are represented by circles (TS) or triangles (WS). Whiskers represent 1.5 times the inner quartile range. *p<0.005
Identification of genes on chromosome 2
We chose to use the annotation of the chicken (Gallus gallus) genome to assign genes to Z. albicollis chromosome 2 (ZAL2/2m) because the chicken genome was better annotated than the zebra finch genome in the Ensembl database. Chicken gene names and chromosome annotations were downloaded from Biomart (www.ensembl.org/biomart, Ensembl Genes 75). We assigned 891 genes to ZAL2/2m based on homology to genes on chicken chr3, which is orthologous to ZAL2/2m (Thomas et al., 2008). Because this analysis is based on synteny with chicken chromosome 3, any loss of synteny between the species would result in misidentifying ZAL2/2m genes. To capture ZAL2/2m genes not represented in the chicken genome, we identified a list of 32 white-throated sparrow contigs that map to ZAL2/2m (see above). A total of 1183 genes mapped to one of these contigs. It is possible that some smaller contigs representing ZAL2/2m sequences were missing from our list, which would have resulted in missing any ZAL2/2m genes located on those contigs. There was good correspondence between these two methods; 877 genes mapped to ZAL2/2m using both methods. After summing the genes that mapped using at least one method, a total of 1197 genes were assigned to ZAL2/2m.
Gene function and pathway analysis
Gene Ontology: Gene names were converted to the corresponding zebra finch (Taeniopygia guttata) Ensembl IDs for gene ontology enrichment analysis using the CORNA package in R (Wu & Watson, 2009). Gene conversions were performed using ID conversion tables downloaded from Ensembl (Flicek et al., 2014). Fisher’s exact test was performed using the list of genes in the network as the background. We considered terms with p<0.05 to be significantly over-enriched in the module. To prioritize enriched terms most likely to be relevant to module function, terms annotated with fewer than three genes or represented by only one gene in the module were removed from the list. To identify genes annotated with a specific term, gene names were uploaded to the Database for Annotation, Visualization and Integrated Discovery (DAVID 6.7, Huang et al., 2009). We used the functional annotation table to identify genes annotated with the term (e.g. “transcription factor activity”). Because zebra finch genes were poorly annotated in the DAVID database, human gene annotations were used.
Pathway analysis: Lists of gene name annotations for each module were used for Ingenuity Pathway Analysis (IPA) using the Core Analysis procedure and the human genome as background. IPA calculates canonical pathway enrichment using a right tailed Fisher’s exact test. A -log(p-value)>1.3 was considered significant.
Results
Behavior
Of the behaviors recorded, only song rate differed between the morphs, which is consistent with previous results from this population (Horton et al., 2014b). In our sample population, TS males sang less than WS males in response to STI (Fig. 1, Wilcoxon W=6, p<0.005). There was no difference between the morphs in any of the other responses to the STIs (trills, chips, flights over decoy, time spent within 5 m, time spent within 2 m, latency to respond, and closest approach; see Fig. 1). Statistical power was 0.95 for songs, 0.06 for chips, 0.05 for latency, and 0.14–0.19 for the other behaviors. Although our power to detect morph differences in behaviors other than singing was low in this study, we replicated our results from a larger study (e.g. Horton et al., 2014b). The first principal component (PC1) for physical aggression explained 73% of the variation, and did not significantly differ between the morphs (Wilcoxon W=58, p=0.29).
Gene networks in the medial amygdala
WGCNA identified 17 modules in the MeA samples. To relate module expression to trait expression, we calculated the correlation between the ME of each module and the three traits of interest (morph, song rate, and PC1 physical aggression) (Fig. 2a). Correlations for only one module, greenyellow, had p-values <0.01. After Bonferroni correction (significance threshold α=9.8e-4), the greenyellow module remained significantly correlated with both morph (r=0.99, p=9e-18) and song rate (r=0.74, p=3e-4). In contrast, no modules were correlated with the PC1 for physical aggression (Fig. 2a and Table S1), or any of the individual behaviors used in the PCA (data not shown). Next, to relate expression variability in individual genes to trait variability, we calculated gene significance measures (GS) for each gene (Langfelder & Horvath, 2008). As expected, the greenyellow module, which was correlated with both morph and song rate, contained genes that were also highly correlated with both traits (Fig. 2c and Table S2). The majority of the genes in the greenyellow module (115 of 157) were located within the inversion on ZAL2/2m (Fig. 2c, 3a, and Table S2).
Figure 2.

Correlations between gene expression and traits. Correlations were calculated between module eigengenes (MEs) and morph, song rate, or PC1 for physical aggression. In the medial amygdala (a) and the hypothalamus (b), each row corresponds to a module and columns correspond to each trait. The color of each cell indicates the value of the correlation coefficient. Positive correlations are red, and negative correlations are blue, as indicated by the color scale bar. In the medial amygdala (c) and the hypothalamus (d), genes are ordered according to membership within the modules. The color bar in the top row indicates the module to which each gene is assigned; genes assigned to the grey module are not shown. In the second row, genes located on ZAL2/2m are indicated by black bars. Rows 3–5 represent the correlation between the expression of each individual gene and the trait indicated (gene significance, or GS). Row 6 represents the correlation between the expression of each gene and EGR1 expression. Each gene is represented by a line, and the color of the line indicates the correlation coefficient, as indicated by the color scale bar. Correlation and p-values are provided in Tables S1 and S3. *Modules correlated with both morph and song.
Figure 3.
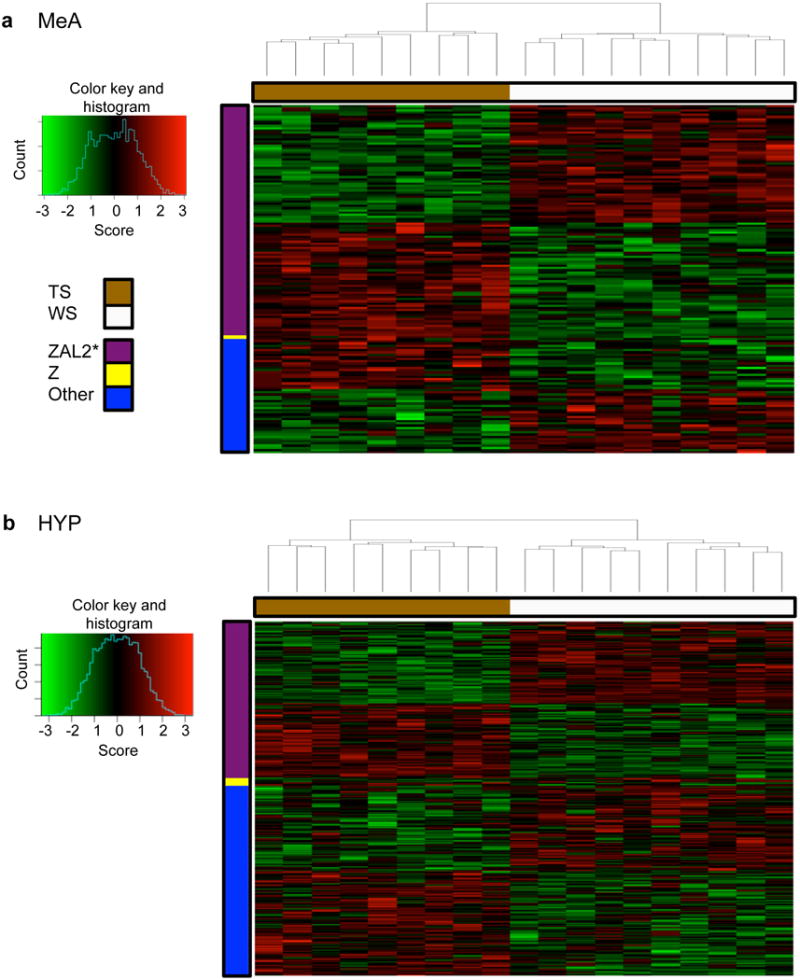
Heat map of expression for individual genes in the MeA greenyellow (a) and HYP black (b) modules. Columns represent samples, sorted by hierarchical clustering. Morph is indicated by the color bar at the top (tan = TS and white = WS birds). Rows represent genes, sorted by chromosome location, then by hierarchical clustering. The color bar on the left indicates the chromosome location of the genes. Genes were assigned to chromosome 2 (ZAL2, purple), chromosome Z (Z, yellow), or other (all genes not assigned to ZAL2 or Z, blue). Expression (score) is represented by the standardized residual (value-mean/std. deviation). Red, increases; green, decreases; black, no change relative to the mean. *All ZAL2 genes located within these two modules were also located within the inversion.
Gene networks in the hypothalamus
WGCNA identified 83 modules in the HYP dataset. Only one module, black, had module-trait correlations with p-values <0.01. After Bonferroni correction (significance threshold α=2e-4), the ME of the black module remained significantly correlated with both morph (r=−0.99, p=6e-16) and song rate (r=−0.75, p=2e-4). As with the MeA modules, no ME was significantly correlated with PC1 physical aggression (Fig. 2b and Table S3) or any of the individual physical behaviors used in the PCA (data not shown). The black module was composed of 511 genes that were highly correlated with both song and morph, and 226 of these genes were located within the inversion on ZAL2/2m (Fig. 2d, 3b, and Table S4).
The modules correlated with song and morph share chromosome 2 genes
A large percentage of both the MeA greenyellow and the HYP black module was composed of differentially expressed genes located on chromosome 2 (Fig. 3). To assess the similarity between these two modules, we used the WGCNA function modulePreservation to compute preservation statistics and a cross-tabulation table between the MeA and HYP modules. Preservation statistics were summed into one variable, the Zsummary; a Zsummary score >10 was considered strong evidence for module preservation (Langfelder et al., 2011). The Zsummary for the MeA greenyellow module in the HYP network was >40. There was also significant overlap in gene membership between the MeA greenyellow and HYP black modules (Fig. S2). We found 85 genes located within both modules, which was significantly more than would be expected by chance (Fisher’s exact test, p<5.0e-80), and 70 of these shared genes were located on ZAL2/2m.
Biological pathways in the modules correlated with morph and song rate
We utilized two strategies to identify genes that may play key roles in the behavioral polymorphism in this species and thus territorial behavior generally. First, we looked for overrepresentation of genes belonging to known biological pathways. We used both pathway (IPA tool) and GO enrichment analyses to identify pathways represented by the genes in the modules that were significantly correlated with song. There was a strong correlation between module membership and GS song rate (r=0.65, p<3e-20 MeA greenyellow; r=0.65, p<1e-62 HYP black), which suggests a relationship between connectivity within the module and behavioral relevance. In order to identify the most behaviorally relevant pathways, we filtered the results for pathways that contained gene(s) with high module membership (top 50, Tables S2 and S4).
In the MeA greenyellow module, IPA identified 22 pathways that were significantly overrepresented, 17 of these pathways contained highly connected genes (Table 1). Most of these pathways shared the signaling molecules MAP3K7, TGFB2, NFKBIE, or SOS1. In the HYP black module, IPA identified 42 pathways that were significantly overrepresented, 24 of these pathways contained highly connected genes (Table 2).
Table 1.
Pathways significantly overrepresented in the MeA greenyellow module*
| Ingenuity Canonical Pathways | −log(p-value) | Ratio | Genes |
|---|---|---|---|
| Glucocorticoid Receptor Signaling | 3.07 | 0.027 | MAP3K7, TGFB2, NFKBIE, GTF2H5, SOS1, ESR1, TAF5L |
| PPARα/RXRα Activation | 2.40 | 0.028 | MAP3K7, ACOX1, TGFB2, NFKBIE, SOS1 |
| Estrogen Receptor Signaling | 2.19 | 0.031 | GTF2H5, SOS1, ESR1, TAF5L |
| Regulation of IL-2 Expression in Activated and Anergic T Lymphocytes | 1.96 | 0.038 | TGFB2, NFKBIE, SOS1 |
| Hepatic Cholestasis | 1.83 | 0.025 | MAP3K7, TGFB2, NFKBIE, ESR1 |
| Thyroid Hormone Biosynthesis | 1.76 | 0.333 | IYD |
| PPAR Signaling | 1.76 | 0.032 | MAP3K7, NFKBIE, SOS1 |
| IL-17A Signaling in Fibroblasts | 1.75 | 0.057 | MAP3K7, NFKBIE |
| tRNA Charging | 1.66 | 0.051 | AARS2, IARS2 |
| Role of PKR in Interferon Induction and Antiviral Response | 1.64 | 0.050 | MAP3K7, NFKBIE |
| Geranylgeranyldiphosphate Biosynthesis | 1.64 | 0.250 | GGPS1 |
| Trans, trans-farnesyl Diphosphate Biosynthesis | 1.54 | 0.200 | GGPS1 |
| IL-6 Signaling | 1.52 | 0.026 | MAP3K7, NFKBIE, SOS1 |
| PKCθ Signaling in T Lymphocytes | 1.50 | 0.025 | MAP3K7, NFKBIE, SOS1 |
| Assembly of RNA Polymerase II Complex | 1.46 | 0.040 | GTF2H5, TAF5L |
| PI3K/AKT Signaling | 1.45 | 0.024 | ITGA2, NFKBIE, SOS1 |
| CD27 Signaling in Lymphocytes | 1.43 | 0.039 | MAP3K7, NFKBIE |
IPA identified 24 pathways significantly enriched in the MeA greenyellow module. Only those pathways that also contain well-connected genes are shown.
Ratio: Number of pathway genes in the greenyellow module divided by the total number of genes in the pathway.
Table 2.
Pathways significantly overrepresented in the HYP black module*
| Ingenuity Canonical Pathways | −log(p-value) | Ratio | Genes |
|---|---|---|---|
| RAR Activation | 2.77 | 0.057 | PRKCD, PNRC1, AKT3, MAP3K5, NT5C1B, SMAD6, TGFB2, PRKCI, GTF2H5, ERCC3 |
| RANK Signaling in Osteoclasts | 2.23 | 0.068 | MAP3K7, AKT3, MAP3K5, NFKBIE, MAP3K4, NFATC1 |
| Gαq Signaling | 2.21 | 0.054 | PRKCD, AKT3, PLCB4, HTR2C, PRKCI, NFKBIE, NFATC1, FNBP1 |
| Type II Diabetes Mellitus Signaling | 2.21 | 0.060 | MAP3K7, PRKCD, AKT3, MAP3K5, SOCS5, PRKCI, NFKBIE |
| Superpathway of D-myo-inositol (1,4,5)-trisphosphate Metabolism | 2.02 | 0.125 | IMPA2, ITPKA, BPNT1 |
| LPS-stimulated MAPK Signaling | 1.94 | 0.069 | MAP3K7, PRKCD, MAP3K5, PRKCI, NFKBIE |
| HGF Signaling | 1.87 | 0.057 | MAP3K7, PRKCD, AKT3, MAP3K5, PRKCI, MAP3K4 |
| VDR/RXR Activation | 1.83 | 0.064 | SERPINB1, PRKCD, TGFB2, PRKCI, HES1 |
| CD27 Signaling in Lymphocytes | 1.81 | 0.077 | MAP3K7, MAP3K5, NFKBIE, MAP3K4 |
| Methylthiopropionate Biosynthesis | 1.73 | 1 | ADI1 |
| Production of Nitric Oxide and Reactive Oxygen Species in Macrophages | 1.72 | 0.044 | MAP3K7, PRKCD, AKT3, MAP3K5, PRKCI, NFKBIE, MAP3K4, FNBP1 |
| G-Protein Coupled Receptor Signaling | 1.67 | 0.039 | AKT3, MC3R, PLCB4, CNR1, HTR1E,HTR2C, FSHR, ADRA2C, MC5R, NFKBIE |
| PKCθ Signaling in T Lymphocytes | 1.65 | 0.051 | GRAP2, MAP3K7, MAP3K5, NFKBIE, MAP3K4, NFATC1 |
| Hepatic Cholestasis | 1.50 | 0.043 | MAP3K7, PRKCD, TGFB2, PRKCI, HNF4A, NFKBIE, MAP3K4 |
| PI3K Signaling in B Lymphocytes | 1.50 | 0.047 | AKT3, PLCB4, PRKCI, NFKBIE, NFATC1, DAPP1 |
| GNRH Signaling | 1.48 | 0.047 | MAP3K7, PRKCD, MAP3K5, PLCB4, PRKCI, MAP3K4 |
| Mismatch Repair in Eukaryotes | 1.46 | 0.125 | RPA1, MSH2 |
| Erythropoietin Signaling | 1.45 | 0.060 | PRKCD, AKT3, PRKCI, NFKBIE |
| Superpathway of Geranylgeranyldiphosphate Biosynthesis I (via Mevalonate) | 1.41 | 0.118 | ACAT2, GGPS1 |
| NF-κB Signaling | 1.37 | 0.041 | MAP3K7, AKT3, NTRK2, NFKBIE, TBK1, IGF2R, FGFRL1 |
| D-myo-inositol (1,4,5)-trisphosphate Degradation | 1.37 | 0.111 | IMPA2, BPNT1 |
| B Cell Receptor Signaling | 1.34 | 0.040 | MAP3K7, AKT3, MAP3K5, NFKBIE, MAP3K4, NFATC1, DAPP1 |
| NF-κB Activation by Viruses | 1.33 | 0.055 | PRKCD, AKT3, PRKCI, NFKBIE |
| STAT3 Pathway | 1.33 | 0.055 | SOCS5, NTRK2, IGF2R, FGFRL1 |
| Role of NFAT in Cardiac Hypertrophy | 1.31 | 0.039 | MAP3K7, PRKCD, AKT3, PLCB4, SLC8A1, TGFB2, PRKCI |
| NGF Signaling | 1.31 | 0.047 | MAP3K7, PRKCD, AKT3, MAP3K5, MAP3K4 |
IPA identified 42 pathways significantly enriched in the HYP black module. Only those pathways that also contain well-connected genes are shown. Ratio: Number of pathway genes in the black module divided by the total number of genes in the pathway.
The GO analysis identified 18 enriched terms that were represented by two or more genes in the MeA greenyellow module. Enriched GO terms involved microtubule activity (GO:0034453, GO:0003777, GO:0007018), fatty acid metabolic process (GO:0000038, GO:0006635), mitochondrion (GO:0005739), ADP binding (GO:0043531,), kinase activity (GO:0000186, GO:0006469), and locomotory behavior (GO:0007626) (Table S5). We identified 74 enriched terms that were represented by two or more genes in the HYP black module. To focus on the terms most relevant for the HYP black module, we looked for terms that contained hub genes. These terms included activation of MAPK activity (GO:0004709 and GO:0000186), prenyltransferase activity (GO:0004659), isoprenoid biosynthetic process (GO:0008299), and extracellular matrix organization (GO:0030198) (Table S5).
Identification of biologically relevant hub genes
In the second approach to identify biologically relevant genes, we used GO annotations to identify transcriptional regulators within the module. Because well-connected transcription factors may coordinate the expression of multiple genes, we searched for well-connected (aka “hub”) genes within the module (Fig. 4, and Table S2 and S4) that were annotated with the GO term “transcription factor activity”. In the MeA greenyellow module, we identified three genes with this GO annotation: ESR1, TAF5L, and GTF2H5. All three of these genes were also represented in the IPA pathways identified for that module. The most well connected gene within the module, EPM2A, while not a transcription factor, was strongly connected to both TAF5L and ESR1 (see Fig. 4a). Other well-connected genes that have a role in transcription were C1D, OLIG3, and STON1. In the HYP black module, hub genes annotated with “transcription factor activity” were TAF5L, ACSS1, AGT, and MYF5. Among these genes, only TAF5L was strongly connected to the other hub genes (Fig. 4b). Our ability to speculate about the functional roles and importance of hub genes was limited, in both modules, by the information available about each gene. Well-connected genes not discussed here, particularly ones that are not annotated (e.g. LOC designations) may also play interesting roles.
Figure 4.
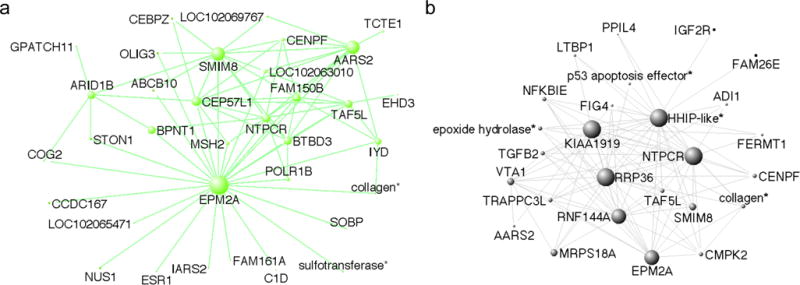
Connectivity in the (a) MeA greenyellow and (b) HYP black networks. Only the 75 (MeA) or 100 (HYP) strongest connections among the top 50 most well-connected genes (determined using kIN) are shown. Node size represents the degree of connectivity. *Where available, gene description for LOC genes are used. See supplemental tables S2 and S4 for LOC gene designations.
Discussion
In this study, our aim was to identify genes that correlate with behavior, and thus are candidates for mediating the effects of a chromosomal inversion on social behavior in this species. In order to accomplish this aim, we quantified territorial behavior in free-living males and subsequently analyzed gene expression in brain regions that are part of a social behavior network (Goodson, 2005) and previously linked with territorial responses in this species (Horton et al., 2014a). Using gene co-expression network analysis, we found one module significantly correlated with both morph and song rate in each of these regions. In contrast, no modules were correlated with physical aggression, a behavior that did vary among individuals but did not differ between the morphs (see also Horton et al., 2014b).
The positive correlation between module membership and gene significance for song in both the MeA greenyellow and HYP black modules indicates that genes central to the network (i.e. hub genes) are also highly correlated with song rate. Because of their centrality within the module, hub genes have the potential to be key drivers of the gene co-expression network. Some of the most well-connected hub genes in these two modules are involved in basic cellular processes likely common to most cell types. For example the gene EMP2A, which is a hub in both the greenyellow MeA and black HYP modules (Fig. 4) encodes the protein laforin, which maintains the phosphorylation state of glycogen (see Raththagala et al., 2015) and is thus key to cellular energy supply and metabolism. Another hub gene in both modules, NTPCR, hydrolyzes nucleosides (e.g. GTP, ATP) and is thus may also be important for energy homeostasis. AARS2, which is highly connected in the greenyellow module and appears in the black module as well, catalyzes the attachment of amino acid residues to tRNA (reviewed by Gillet & Felden, 2001) and is thus critical for protein translation. Each of these genes is evolutionarily ancient, with homologs found in most taxa including plants and prokaryotes, reflecting their ubiquitous roles in basic cellular functioning. Their specific roles in behavior are unclear in the context of this study, other than that they support basic functions in brain regions that are known to be active during territorial defense and other social behaviors.
In order to better understand the relationships among the genes in the two modules correlated with behavior, we conducted IPA, which reveals enrichment of gene pathways with known functions. Each of top three pathways in the MeA greenyellow module involved nuclear receptor signaling (Table 1). The glucocorticoid receptor signaling pathway represents a particularly interesting finding because Horton & Holberton (2010) found that during the parental provisioning stage of the breeding season, TS males had lower levels of plasma corticosterone (CORT) than WS males. To test whether this hormonal difference may mediate known morph differences in parental provisioning rates, they experimentally raised plasma CORT in TS birds and blocked CORT in the WS birds. These manipulations essentially eliminated morph differences in parental provisioning rates (Horton & Holberton, 2009). Although we did not collect tissue during the parental phase, our results confirm that genes in the CORT signaling pathway are differentially expressed in the morphs and may play a role in morph-dependent behaviors.
Perhaps our most compelling finding is that the MeA module that was correlated with both morph and singing was enriched for genes in the estrogen receptor (ER) signaling pathway (Table 1). Expression of the gene that encodes estrogen receptor alpha (ERα) has been shown in previous studies to be correlated with territorial aggression and parenting behavior in this and other species. For example, in dark-eyed juncos (Junco hyemalis), aggressive responses to STI were positively correlated with expression of ERα in the ventral telencephalon (containing the MeA) and negatively correlated in HYP (which in that study included POM and VMH) (Rosvall et al., 2012). In a previous study, we reported that in white-throated sparrows, ERα mRNA is differentially expressed in MeA and several other brain regions (Horton et al., 2014a). In that study, expression of ERα in both the MeA and PVN predicted song rate in response to STI, a correlation that persisted even when morph and plasma levels of testosterone and estradiol were held constant. Mediation analysis revealed in fact that singing in response to STI was better predicted by ERα expression in MeA than by morph (Horton et al., 2014a). In the current study, ERα in the MeA module was associated with both morph and singing, which replicates our previous findings and supports our hypothesis that this gene may play a key role in the behavioral polymorphism in this species and the evolution of alternative reproductive strategies generally (Maney et al., 2015; Cushing et al., 2008).
In addition to ESR1, other genes with known relationships with estrogen signaling were located in the modules correlated with singing. For example the expression of TAF5L, a transcription factor in the ER signaling pathway, was well-connected in both the MeA greenyellow and HYP black modules (Fig. 4). Thompson et al. (2012) showed that TAF5L expression was highly correlated with the expression of immediate early genes such as Egr-1 and Fos in the song control nuclei of white-crowned sparrows (Z. leucophrys), a congener of the white-throated sparrow. Because Thompson et al. quantified expression in the motor nuclei that are most active during singing, their results suggest that TAF5L expression may be related to activity generally; it may also be altered by increasing local concentrations of estradiol (Fong et al., 2007), which is released in nearby regions in response to hearing conspecific song (Remage-Healey et al., 2008).
When bound with ligand, ERs act via two main mechanisms: genomic and nongenomic. In the canonical genomic pathway, the receptor binds estradiol inside the cytoplasm, translocates to the nucleus and acts as a transcription factor. If ERα mediates morph differences in behavior via genomic mechanisms, we might expect it to regulate the transcription of a large number of other genes and to be well-connected in the modules correlated with behavior. It does not, however, seem to act as a hub in either network (Fig. 4). It is possible that ERα may regulate morph-dependent behaviors via nongenomic mechanisms such as membrane-bound receptors. For example, ERα can act in a nongenomic fashion by interacting with the metabotropic glutamate receptor (mGluR1; Meitzen & Mermelstein, 2011). ERα can also induce phosphorylation of the membrane-associated protein Shc, which then interacts with two other proteins, Grb2 and SOS, to initiate intracellular events (Song et al., 2002). Genes for proteins critical to each of these nongenomic mechanisms, mGluR1 and SOS, are both found in the MeA greenyellow module meaning that like ESR1, their expression depends on morph and is linked with behavior.
When estradiol acts via nongenomic mechanisms, resulting changes in intracellular activity, such as MAPK activation and firing, are rapid and likely short-lived. Intracellular events downstream of ERα activation therefore may not be detectable by measuring gene expression many hours after the last STI, nor would they necessarily be correlated with behavior. We intentionally delayed sampling until 24 hours after the last STI because we were not interested in the effects of behavioral responses on gene expression, but rather the opposite – we wanted to discover genes related to the motivation to respond to challenge rather than engaging in the response itself. Other researchers have published lists of genes that are induced by STI in wild songbirds; for example of all the genes induced by STI in the hypothalamus of song sparrows (Melospiza melodia; Mukai et al., 2009), only two genes, TBCE and PEX13, were in a module associated with behavior in this study (HYP black module). According to Mukai et al., many other genes are selectively expressed as a result of engaging in territorial defense; we would expect to find robust morph differences in the expression of those genes immediately following STI.
Synaptic plasticity has been associated with behavioral differences between sexes in zebrafish (Wong et al., 2014) and vocal learning in zebra finches (Hilliard et al. 2012). Enriched pathways and GO terms in both the MeA greenyellow and HYP black modules can be broadly associated with synapse function or activity. In the MeA, enriched GO terms were related to energy production and vesicle transport (e.g. mitochondrion and microtubules). In the HYP black module, three of the six genes annotated with the GO term “extracellular matrix organization” are hub genes (Table S5). Both modules were enriched for genes related to retinoic acid signaling. In The HYP black module, these terms were “isoprenoid biosynthetic process”, “RAR activation”, and ”VDR/RXR activation”. The MeA greenyellow module was enriched for genes belonging to the PPARα/RXRα activation pathway. Both the extracellular matrix and retinoid signaling play important roles in synaptic function and plasticity (Frischknecht & Gundelfinger, 2012, Shearer et al., 2012). These results suggest that morph differences in vocal aggression may relate to processes involved in synaptic plasticity.
Because we did not continuously monitor the birds’ behavior during the hours immediately preceding tissue collection, we must consider the possibility that the morph differences in gene expression we found were related to territorial behavior that we did not observe. Previous studies in songbirds have demonstrated that large numbers of genes are regulated by either experience (e.g., listening to song) or behavior (e.g., singing) (Drnevich et al., 2012; Mukai et al., 2009; Whitney et al., 2014). Formica et al. (2004) have shown that WS and TS birds prefer different types of habitat; WS males choose territories with more neighbors and therefore higher frequencies of agonistic encounters than TS males (see also Formica & Tuttle, 2009). We believe that morph differences in habitat selection were unlikely to have played a key role in our findings here. First, although we cannot rule out effects of social niche partitioning, in this population the morphs are fairly evenly distributed and tend to occupy the same types of habitat (Horton et al., 2014b). Second, to determine whether any of the modules were correlated with potential neuronal responses to stimuli, we examined the expression of an immediate early gene, EGR1. EGR1 expression, however, was not correlated with either of the modules associated with morph and song (Fig. 2). Note, however, that singing is not known to be correlated with EGR1 induction in MeA (Earp & Maney, 2012), so this measure may not indicate whether birds were engaging in territorial defense. Finally, we and others have demonstrated significant morph differences in behavior in controlled conditions in the laboratory; WS males sang at higher rates and were more aggressive than TS birds (Maney et al., 2009; Maney & Goodson, 2011; Swett, 2007) even when social conditions were identical. These differences persisted despite similar levels of plasma sex steroids in the two morphs, supporting the hypothesis that morph differences in neural sensitivity to sex steroids, which could take the form of morph differences in receptor numbers or distribution, may underlie morph differences in territorial behavior.
WGCNA identified many more modules in the HYP than the MeA network, even though both networks were constructed using the same parameters. One possible explanation for the larger number of modules in the HYP network is that it reflects the more heterogeneous nature of the HYP samples. Gene expression patterns are known to depend on brain region (Balakrishnan et al., 2014; Drnevich et al., 2012; Whitney et al., 2014). Our HYP punches contained several hypothalamic nuclei (see Materials and Methods and Fig. S1) in which genes may be differentially regulated. In networks that are built using samples collected from multiple, distinct brain regions or nuclei, modules that distinguish these individual nuclei or specific brain regions can be identified (Drnevich et al., 2012; Konopka et al., 2012; Oldham et al., 2006). We were unable to perform this type of analysis with our dataset because our network was built using one sample type (HYP). Although we are unaware of genes that define only one subregion of the hypothalamus, we have previously shown that morph differences in ESR1 expression are dependent on brain region. We previously showed, for example, that ESR1 expression is higher in TS than WS birds in VMH and caudal POM, but higher in WS than TS birds in PVN (Horton et al., 2014a); both VMH and PVN were contained in our HYP sample. Heterogeneity may thus explain why, although we replicated our previous finding of differential expression of ESR1 in MeA (Horton et al., 2014a), we could not detect differential expression of ESR1 in our HYP sample. In dark-eyed juncos, expression of ESR1 in HYP was negatively correlated with territorial aggression (Rosvall et al., 2012). Here, we were unable to detect a correlation between song rate and ESR1 in HYP and ESR1 was not located within the HYP black module. In future studies, it may be important to conduct RNA-seq on smaller samples limited to a single region in order to detect morph differences in gene expression within regions with distinct functions and cell types.
Our results demonstrate the profound effects of the ZAL2/2m rearrangement on gene expression. Our two modules of interest, MeA greenyellow and HYP black, were composed primarily of genes captured by the inversion (see Figs. 2 and 3). Standard network analysis groups genes into modules based on co-expression. The usual interpretation of these modules, which we have presented above, is that co-expressed genes are functionally related. As a result, a significant fraction of genes within a module often represent similar gene ontology categories or canonical pathways (Langfelder et al., 2011; Oldham et al., 2006). However, multiple mechanisms can influence gene-gene correlations, including higher order chromosome configuration and epigenetic regulation (Gaiteri et al., 2014). We must also consider a second interpretation; in our analysis, genes may be grouped into co-expression modules due to co-localization within the differentiating region. We did not observe enrichment of ZAL2/2m genes in any other modules, suggesting that the inversion was a facilitating factor in the emergence of the MeA greenyellow and HYP black modules. In support of this alternative explanation, we found that all of the chromosome 2 genes within the MeA greenyellow and HYP black modules were located within the inversion; in other words, none of the chromosome 2 genes within these modules were located in the recombining regions of chromosome 2, outside of the inversion. We also found significant overlap in gene membership between the modules, and most (70/84) of these shared genes were located within the inversion. Therefore, the traditional interpretation that genes within a co-expression network are connected because they act in the same pathway or biological processes represents only one of several possible mechanisms driving gene-gene correlations. It is also important to note that because of the large morph difference in singing in this study (Fig. 1a), it is difficult to dissociate that trait from plumage morph; the only modules correlated with singing were also correlated with morph. Placement of ESR1 within the MeA greenyellow module confirmed that our network analysis correctly identified a gene known to predict song rate independently of morph (Horton et al., 2014a). Whether song rate is reliably predicted by other genes in the module, however, is difficult to test in this dataset because of our relatively small sample size. Follow-up studies will be necessary to evaluate the potential roles of other promising genes in territorial aggression.
The white-throated sparrow is a useful model system in which to study the consequences of an inversion on gene expression. By suppressing recombination between alleles, chromosomal rearrangements can foster the evolution of co-adapted alleles, or ‘supergenes’ (Dobzhansky, 1970). Inversions that encompass multiple genes involving a suite of phenotypic traits might therefore maintain both behavioral and color polymorphism within a species (reviewed in McKinnon & Pierotti, 2010). Alternatively, a single gene with pleiotropic effects might be responsible for both behavioral and color polymorphism. Likely candidates are transcription factors and hormones. Transcription factors have the capacity to coordinate the expression of multiple genes that share a cis-regulatory region. Hormones can activate transcription factors and act through nongenomic signaling pathways. We cannot determine from our current study whether co-adapted alleles or a small number of pleiotropic genes can explain the behavioral polymorphism. It will be interesting to determine in future studies the extent to which manipulating expression of a single gene can influence behavior in this species.
Supplementary Material
Figure S1: Diagram of the locations of punches for a) MeA and b) HYP samples. Circles indicate punched regions. a) The MeA punch contained the ventromedial telencephalon, which is largely composed of the MeA. b) The dorsal HYP punches contained the anterior hypothalamus (AH), the caudal portion of the medial preoptic area (POM), and the paraventricular nucleus (PVN). The ventral punches included the ventromedial hypothalamus (VMH). AC- anterior commissure.
Figure S2: Overlap of genes between MeA and HYP modules. Modules in the MeA and HYP are presented in columns, and rows, respectively. The number of genes shared by each MeA and HYP module is given in the table. The table is color-coded according to the –log of the Fisher’s exact test p-values, as indicated by the color bar on the right. *There was significant overlap in gene membership between the HYP black and MeA greenyellow modules.
Table S1: Correlations between traits and module eigengenes (ME) in the MeA. Numbers in each cell represent the correlation coefficient and p-values are in parentheses. The correlation coefficient values are depicted in the heatmap in Fig. 2a.
Table S2: MeA Network data. This table contains module membership, gene significance (GS) calculations, chromosome location, and corresponding zebra finch, chicken, and human gene annotations for all genes analyzed in the WGCNA. Each row contains information on a gene annotated in the sparrow genome and present in the RNA-seq data. Columns (a) Gene name, (b) Gene description: LOC gene descriptions used in Fig. 4 (c) Ensembl-Gal: chicken Ensembl gene name, (d) Ensembl-Tg: zebra finch Ensembl Gene name, (e) Chr-Gal: chromosome location in chicken, (f) ZAL2: whether or not the gene is located on chromosome 2, (see the Materials and Methods section for details), (g) Inversion: for ZAL2 genes, whether or not the gene is located inside (i) or outside (o) the inversion (h) Module color: color of the module the gene was assigned to. Columns (i-p) contain the values for the correlation (GS) between gene expression and the indicated trait or gene (songs, morph, PC1, and EGR1 expression), and the corresponding p-values (p.GS). (q) kIN: Intramodule connectivity, calculated only for genes in the greenyellow module.
Table S3: Correlations between traits and module eigengenes (ME) in the HYP. Numbers in each cell represent the correlation coefficient, p-values are in parentheses. The correlation coefficient values are depicted in the heatmap in Fig. 2b.
Table S4: HYP network data. Columns (a-p) are the same as in Table S2, (q) contains kIN for genes in the black module.
Table S5: Gene Ontology terms significantly enriched in the modules correlated with song rate and morph. Each row represents an enriched term (p<0.05). Columns represent (a) Module: module in which the term was enriched, (b) GO ID: gene ontology ID, (c) Total: total number of genes annotated with that term, (d) Expectation: expected number of genes in the module (e) Observation: actual number of genes in the module (f) Fisher: enrichement p-value, (g) FDR: false discovery rate, (h) Module genes: genes annotated by the term and present in the module (i) Description: GO term description, (j) Process: GO term process. Terms with fewer than three members or with fewer than two members in the module of interest were removed from the list. *Hub genes.
Supplemental File 1: SNPs calls between the reference genome and the superwhite genome used to generate the alternate ZAL2m contigs.
Supplemental File 2: rRNA sequences added to the enhanced reference genome.
Supplemental File 3: Mitochondrial sequences added to the enhanced reference genome.
Acknowledgments
Sequencing of the superwhite genome and SNP calling between the reference assembly and the superwhite assembly were performed by the Roy J. Carver Biotechnology Center of the University of Illinois. RNA-seq for the HYP and MeA samples was conducted at the Yerkes Nonhuman Primate Genomics Core Laboratory. This work was supported by NSF grant SMA-1306132 to W.M.Z. and D.L.M. and NIH grants R01MH082833 to D.L.M. and 1R21NIMH102677 to D.L.M and S.V.Y. The National Human Genome Research Institute Intramural Research program at the NIH supported J.W.T.
Footnotes
The authors have no conflicts of interest to report.
References
- Anders S, Pyl PT, Huber W. HTSeq–a Python framework to work with high-throughput sequencing data. Bioinformatics. 2015;31:166–169. doi: 10.1093/bioinformatics/btu638. [DOI] [PMC free article] [PubMed] [Google Scholar]
- Anholt RR, Mackay TF. Genetics of aggression. Annu Rev Genet. 2012;46:145–164. doi: 10.1146/annurev-genet-110711-155514. [DOI] [PubMed] [Google Scholar]
- Balakrishnan CN, Mukai M, Gonser RA, Wingfield JC, London SE, Tuttle EM, Clayton DF. Brain transcriptome sequencing and assembly of three songbird model systems for the study of social behavior. PeerJ. 2014;2:e396. doi: 10.7717/peerj.396. [DOI] [PMC free article] [PubMed] [Google Scholar]
- Collins CE, Houtman AM. Tan and white color morphs of White-throated Sparrows differ in their non-song vocal responses to territorial intrusion. Condor. 1999;101:842–845. [Google Scholar]
- Cushing BS, Perry A, Musatov S, Ogawa S, Papademetriou E. Estrogen receptors in the medial amygdala inhibit the expression of male prosocial behavior. The Journal of neuroscience: the official journal of the Society for Neuroscience. 2008;28:10399–10403. doi: 10.1523/JNEUROSCI.1928-08.2008. [DOI] [PMC free article] [PubMed] [Google Scholar]
- Davis JK, Mittel LB, Lowman JJ, Thomas PJ, Maney DL, Martin CL, Thomas JW. Haplotype-based genomic sequencing of a chromosomal polymorphism in the white-throated sparrow (Zonotrichia albicollis) The Journal of heredity. 2011;102:380–390. doi: 10.1093/jhered/esr043. [DOI] [PMC free article] [PubMed] [Google Scholar]
- Dobin A, Davis CA, Schlesinger F, Drenkow J, Zaleski C, Jha S, Batut P, Chaisson M, Gingeras TR. STAR: ultrafast universal RNA-seq aligner. Bioinformatics. 2013;29:15–21. doi: 10.1093/bioinformatics/bts635. [DOI] [PMC free article] [PubMed] [Google Scholar]
- Dobzhansky T. Genetics of the evolutionary process. Columbia University Press; New York: 1970. [Google Scholar]
- Drnevich J, Replogle KL, Lovell P, Hahn TP, Johnson F, Mast TG, Nordeen E, Nordeen K, Strand C, London SE, Mukai M, Wingfield JC, Arnold AP, Ball GF, Brenowitz EA, Wade J, Mello CV, Clayton DF. Impact of experience-dependent and -independent factors on gene expression in songbird brain. Proceedings of the National Academy of Sciences. 2012;109:17245–17252. doi: 10.1073/pnas.1200655109. [DOI] [PMC free article] [PubMed] [Google Scholar]
- Earp SE, Maney DL. Birdsong: is it music to their ears? Frontiers in evolutionary neuroscience. 2012;4:14. doi: 10.3389/fnevo.2012.00014. [DOI] [PMC free article] [PubMed] [Google Scholar]
- Falls JB. Does Song Deter Territorial Intrusion in White-Throated Sparrows (Zonotrichia-Albicollis) Canadian Journal of Zoology-Revue Canadienne De Zoologie. 1988;66:206–211. [Google Scholar]
- Falls JB, Kopachena JG. White-throated Sparrow (Zonotrichia albicollis) In: Poole A, editor. The Birds of North America Online. Ithaca: Cornell Lab of Ornithology; 2010. [Google Scholar]
- Filteau M, Pavey SA, St-Cyr J, Bernatchez L. Gene coexpression networks reveal key drivers of phenotypic divergence in lake whitefish. Mol Biol Evol. 2013;30:1384–1396. doi: 10.1093/molbev/mst053. [DOI] [PubMed] [Google Scholar]
- Flicek P, Amode MR, Barrell D, Beal K, Billis K, Brent S, Carvalho-Silva D, Clapham P, Coates G, Fitzgerald S, Gil L, Giron CG, Gordon L, Hourlier T, Hunt S, Johnson N, Juettemann T, Kahari AK, Keenan S, Kulesha E, Martin FJ, Maurel T, McLaren WM, Murphy DN, Nag R, Overduin B, Pignatelli M, Pritchard B, Pritchard E, Riat HS, Ruffier M, Sheppard D, Taylor K, Thormann A, Trevanion SJ, Vullo A, Wilder SP, Wilson M, Zadissa A, Aken BL, Birney E, Cunningham F, Harrow J, Herrero J, Hubbard TJ, Kinsella R, Muffato M, Parker A, Spudich G, Yates A, Zerbino DR, Searle SM. Ensembl 2014. Nucleic Acids Res. 2014;42:D749–755. doi: 10.1093/nar/gkt1196. [DOI] [PMC free article] [PubMed] [Google Scholar]
- Fong CJ, Burgoon LD, Williams KJ, Forgacs AL, Zacharewski TR. Comparative temporal and dose-dependent morphological and transcriptional uterine effects elicited by tamoxifen and ethynylestradiol in immature, ovariectomized mice. BMC genomics. 2007;8:151. doi: 10.1186/1471-2164-8-151. [DOI] [PMC free article] [PubMed] [Google Scholar]
- Formica VA, Gonser RA, Ramsay S, Tuttle EM. Spatial dynamics of alternative reproductive strategies: The role of neighbors. Ecology. 2004;85:1125–1136. [Google Scholar]
- Frischknecht R, Gundelfinger ED. The brain’s extracellular matrix and its role in synaptic plasticity. Adv Exp Med Biol. 2012;970:153–171. doi: 10.1007/978-3-7091-0932-8_7. [DOI] [PubMed] [Google Scholar]
- Formica VA, Tuttle EM. Examining the social landscapes of alternative reproductive strategies. Journal of evolutionary biology. 2009;22:2395–2408. doi: 10.1111/j.1420-9101.2009.01855.x. [DOI] [PubMed] [Google Scholar]
- Fuller TF, Ghazalpour A, Aten JE, Drake TA, Lusis AJ, Horvath S. Weighted gene coexpression network analysis strategies applied to mouse weight. Mamm Genome. 2007;18:463–472. doi: 10.1007/s00335-007-9043-3. [DOI] [PMC free article] [PubMed] [Google Scholar]
- Gaiteri C, Ding Y, French B, Tseng GC, Sibille E. Beyond modules and hubs: the potential of gene coexpression networks for investigating molecular mechanisms of complex brain disorders. Genes, brain, and behavior. 2014;13:13–24. doi: 10.1111/gbb.12106. [DOI] [PMC free article] [PubMed] [Google Scholar]
- Ghazalpour A, Doss S, Zhang B, Wang S, Plaisier C, Castellanos R, Brozell A, Schadt EE, Drake TA, Lusis AJ, Horvath S. Integrating genetic and network analysis to characterize genes related to mouse weight. PLoS genetics. 2006;2:e130. doi: 10.1371/journal.pgen.0020130. [DOI] [PMC free article] [PubMed] [Google Scholar]
- Gillet R, Felden B. Emerging views on tmRNA-mediated protein tagging and ribosome rescue. Mol Microbiol. 2001;42:879–885. doi: 10.1046/j.1365-2958.2001.02701.x. [DOI] [PubMed] [Google Scholar]
- Goodson JL, Evans AK, Soma KK. Neural responses to aggressive challenge correlate with behavior in non-breeding sparrows. Neuroreport. 2005;16:1719–1723. doi: 10.1097/01.wnr.0000183898.47160.15. [DOI] [PMC free article] [PubMed] [Google Scholar]
- Grozhik AV, Horoszko CP, Horton BM, Hu Y, Voisin DA, Maney DL. Hormonal regulation of vasotocin receptor mRNA in a seasonally breeding songbird. Horm Behav. 2014;65:254–263. doi: 10.1016/j.yhbeh.2013.11.009. [DOI] [PMC free article] [PubMed] [Google Scholar]
- Hilliard AT, Miller JE, Fraley ER, Horvath S, White SA. Molecular microcircuitry underlies functional specification in a basal ganglia circuit dedicated to vocal learning. Neuron. 2012;73:537–552. doi: 10.1016/j.neuron.2012.01.005. [DOI] [PMC free article] [PubMed] [Google Scholar]
- Horton BM, Hauber ME, Maney DL. Morph Matters: Aggression Bias in a Polymorphic Sparrow. PloS one. 2012;7 doi: 10.1371/journal.pone.0048705. [DOI] [PMC free article] [PubMed] [Google Scholar]
- Horton BM, Holberton RL. Corticosterone manipulations alter morph-specific nestling provisioning behavior in male white-throated sparrows, Zonotrichia albicollis. Horm Behav. 2009;56:510–518. doi: 10.1016/j.yhbeh.2009.09.001. [DOI] [PubMed] [Google Scholar]
- Horton BM, Holberton RL. Morph-specific variation in baseline corticosterone and the adrenocortical response in breeding white-throated sparrows (Zonotrichia albicollis) The Auk. 2010;127:9. [Google Scholar]
- Horton BM, Hu Y, Martin CL, Bunke BP, Matthews BS, Moore IT, Thomas JW, Maney DL. Behavioral characterization of a white-throated sparrow homozygous for the ZAL2(m) chromosomal rearrangement. Behav Genet. 2013;43:60–70. doi: 10.1007/s10519-012-9574-6. [DOI] [PMC free article] [PubMed] [Google Scholar]
- Horton BM, Hudson WH, Ortlund EA, Shirk S, Thomas JW, Young ER, Zinzow-Kramer WM, Maney DL. Estrogen receptor alpha polymorphism in a species with alternative behavioral phenotypes. Proceedings of the National Academy of Sciences of the United States of America. 2014a;111:1443–1448. doi: 10.1073/pnas.1317165111. [DOI] [PMC free article] [PubMed] [Google Scholar]
- Horton BM, Moore IT, Maney DL. New insights into the hormonal and behavioural correlates of polymorphism in white-throated sparrows. Anim Behav. 2014b;93:207–219. doi: 10.1016/j.anbehav.2014.04.015. [DOI] [PMC free article] [PubMed] [Google Scholar]
- Hu Z, Mellor J, Wu J, DeLisi C. VisANT: an online visualization and analysis tool for biological interaction data. BMC bioinformatics. 2004;5:17. doi: 10.1186/1471-2105-5-17. [DOI] [PMC free article] [PubMed] [Google Scholar]
- Huang da W, Sherman BT, Lempicki RA. Systematic and integrative analysis of large gene lists using DAVID bioinformatics resources. Nature protocols. 2009a;4:44–57. doi: 10.1038/nprot.2008.211. [DOI] [PubMed] [Google Scholar]
- Huynh LY, Maney DL, Thomas JW. Chromosome-wide linkage disequilibrium caused by an inversion polymorphism in the white-throated sparrow (Zonotrichia albicollis) Heredity (Edinb) 2011;106:537–546. doi: 10.1038/hdy.2010.85. [DOI] [PMC free article] [PubMed] [Google Scholar]
- Kidd JM, Cooper GM, Donahue WF, Hayden HS, Sampas N, Graves T, Hansen N, Teague B, Alkan C, Antonacci F, Haugen E, Zerr T, Yamada NA, Tsang P, Newman TL, Tuzun E, Cheng Z, Ebling HM, Tusneem N, David R, Gillett W, Phelps KA, Weaver M, Saranga D, Brand A, Tao W, Gustafson E, McKernan K, Chen L, Malig M, Smith JD, Korn JM, McCarroll SA, Altshuler DA, Peiffer DA, Dorschner M, Stamatoyannopoulos J, Schwartz D, Nickerson DA, Mullikin JC, Wilson RK, Bruhn L, Olson MV, Kaul R, Smith DR, Eichler EE. Mapping and sequencing of structural variation from eight human genomes. Nature. 2008;453:56–64. doi: 10.1038/nature06862. [DOI] [PMC free article] [PubMed] [Google Scholar]
- Knapton RW, Falls JB. Differences in parental contribution among pair types in the polymorphic White_throated Sparrow. Can J Zool. 1983;61:1288–1292. [Google Scholar]
- Konopka G, Friedrich T, Davis-Turak J, Winden K, Oldham MC, Gao F, Chen L, Wang GZ, Luo R, Preuss TM, Geschwind DH. Human-specific transcriptional networks in the brain. Neuron. 2012;75:601–617. doi: 10.1016/j.neuron.2012.05.034. [DOI] [PMC free article] [PubMed] [Google Scholar]
- Kopachena JG, Falls JB. Aggressive Performance as a Behavioral Correlate of Plumage Polymorphism in the White-Throated Sparrow (Zonotrichia-Albicollis) Behaviour. 1993a;124:249–266. [Google Scholar]
- Kopachena JG, Falls JB. Reevaluation of Morph-Specific Variations in Parental Behavior of the White-Throated Sparrow. Wilson Bull. 1993b;105:48–59. [Google Scholar]
- Langfelder P, Castellani LW, Zhou Z, Paul E, Davis R, Schadt EE, Lusis AJ, Horvath S, Mehrabian M. A systems genetic analysis of high density lipoprotein metabolism and network preservation across mouse models. Biochim Biophys Acta. 2012;1821:435–447. doi: 10.1016/j.bbalip.2011.07.014. [DOI] [PMC free article] [PubMed] [Google Scholar]
- Langfelder P, Horvath S. WGCNA: an R package for weighted correlation network analysis. Bmc Bioinformatics. 2008;9 doi: 10.1186/1471-2105-9-559. [DOI] [PMC free article] [PubMed] [Google Scholar]
- Langfelder P, Luo R, Oldham MC, Horvath S. Is my network module preserved and reproducible? PLoS computational biology. 2011;7:e1001057. doi: 10.1371/journal.pcbi.1001057. [DOI] [PMC free article] [PubMed] [Google Scholar]
- Langfelder P, Zhang B, Horvath S. Defining clusters from a hierarchical cluster tree: the Dynamic Tree Cut package for R. Bioinformatics. 2008;24:719–720. doi: 10.1093/bioinformatics/btm563. [DOI] [PubMed] [Google Scholar]
- Li H, Handsaker B, Wysoker A, Fennell T, Ruan J, Homer N, Marth G, Abecasis G, Durbin R. The Sequence Alignment/Map format and SAMtools. Bioinformatics. 2009;25:2078–2079. doi: 10.1093/bioinformatics/btp352. [DOI] [PMC free article] [PubMed] [Google Scholar]
- Love MI, Huber W, Anders S. Moderated estimation of fold change and dispersion for RNA-seq data with DESeq2. Genome biology. 2014;15:550. doi: 10.1186/s13059-014-0550-8. [DOI] [PMC free article] [PubMed] [Google Scholar]
- Lowther J. Zonotrichia albicolis PhD Thesis. University of Toronto; Toronto, Ontario, Canada: 1962. Colour and behavioral polymorphism in the white-throated Sparrow. [Google Scholar]
- Lowther JK. Polymorphism in the white-throated sparrow, Zonotrichia albicollis (Gmelin) Can J Zool. 1961;39:281–292. [Google Scholar]
- Ma J, Amos CI. Investigation of inversion polymorphisms in the human genome using principal components analysis. PloS one. 2012;7:e40224. doi: 10.1371/journal.pone.0040224. [DOI] [PMC free article] [PubMed] [Google Scholar]
- Maney DL. Endocrine and genomic architecture of life history trade-offs in an avian model of social behavior. Gen Comp Endocrinol. 2008;157:275–282. doi: 10.1016/j.ygcen.2008.03.023. [DOI] [PubMed] [Google Scholar]
- Maney DL, Goode CT, Lange HS, Sanford SE, Solomon BL. Estradiol modulates neural responses to song in a seasonal songbird. Journal of Comparative Neurology. 2008;511:173–186. doi: 10.1002/cne.21830. [DOI] [PubMed] [Google Scholar]
- Maney DL, Goodson JL. Neurogenomic mechanisms of aggression in songbirds. Adv Genet. 2011;75:83–119. doi: 10.1016/B978-0-12-380858-5.00002-2. [DOI] [PMC free article] [PubMed] [Google Scholar]
- Maney DL, Horton BM, Zinzow-Kramer WM. Estrogen Receptor Alpha as a Mediator of Life-History Trade-offs. Integr Comp Biol. 2015 doi: 10.1093/icb/icv005. [DOI] [PMC free article] [PubMed] [Google Scholar]
- Maney DL, Lange HS, Raees MQ, Reid AE, Sanford SE. Behavioral phenotypes persist after gonadal steroid manipulation in white-throated sparrows. Horm Behav. 2009;55:113–120. doi: 10.1016/j.yhbeh.2008.09.002. [DOI] [PubMed] [Google Scholar]
- McKenna A, Hanna M, Banks E, Sivachenko A, Cibulskis K, Kernytsky A, Garimella K, Altshuler D, Gabriel S, Daly M, DePristo MA. The Genome Analysis Toolkit: a MapReduce framework for analyzing next-generation DNA sequencing data. Genome Res. 2010;20:1297–1303. doi: 10.1101/gr.107524.110. [DOI] [PMC free article] [PubMed] [Google Scholar]
- McKinnon JS, Pierotti ME. Colour polymorphism and correlated characters: genetic mechanisms and evolution. Mol Ecol. 2010;19:5101–5125. doi: 10.1111/j.1365-294X.2010.04846.x. [DOI] [PubMed] [Google Scholar]
- Meitzen J, Mermelstein PG. Estrogen receptors stimulate brain region specific metabotropic glutamate receptors to rapidly initiate signal transduction pathways. J Chem Neuroanat. 2011;42:236–241. doi: 10.1016/j.jchemneu.2011.02.002. [DOI] [PMC free article] [PubMed] [Google Scholar]
- Mirzatoni A, Spence RD, Naranjo KC, Saldanha CJ, Schlinger BA. Injury-induced regulation of steroidogenic gene expression in the cerebellum. J Neurotrauma. 2010;27:1875–1882. doi: 10.1089/neu.2010.1330. [DOI] [PMC free article] [PubMed] [Google Scholar]
- Mukai M, Replogle K, Drnevich J, Wang G, Wacker D, Band M, Clayton DF, Wingfield JC. Seasonal differences of gene expression profiles in song sparrow (Melospiza melodia) hypothalamus in relation to territorial aggression. PloS one. 2009;4:e8182. doi: 10.1371/journal.pone.0008182. [DOI] [PMC free article] [PubMed] [Google Scholar]
- Nelson RJ, Chiavegatto S. Molecular basis of aggression. Trends Neurosci. 2001;24:713–719. doi: 10.1016/s0166-2236(00)01996-2. [DOI] [PubMed] [Google Scholar]
- O’Connell LA, Hofmann HA. The vertebrate mesolimbic reward system and social behavior network: a comparative synthesis. J Comp Neurol. 2011;519:3599–3639. doi: 10.1002/cne.22735. [DOI] [PubMed] [Google Scholar]
- Oldham MC, Horvath S, Geschwind DH. Conservation and evolution of gene coexpression networks in human and chimpanzee brains. Proceedings of the National Academy of Sciences of the United States of America. 2006;103:17973–17978. doi: 10.1073/pnas.0605938103. [DOI] [PMC free article] [PubMed] [Google Scholar]
- Ortolano S, Vieitez I, Agis-Balboa RC, Spuch C. Loss of GABAergic cortical neurons underlies the neuropathology of Lafora disease. Molecular brain. 2014;7:7. doi: 10.1186/1756-6606-7-7. [DOI] [PMC free article] [PubMed] [Google Scholar]
- Raththagala M, Brewer MK, Parker MW, Sherwood AR, Wong BK, Hsu S, Bridges TM, Paasch BC, Hellman LM, Husodo S, Meekins DA, Taylor AO, Turner BD, Auger KD, Dukhande VV, Chakravarthy S, Sanz P, Woods VL, Jr, Li S, Vander Kooi CW, Gentry MS. Structural mechanism of laforin function in glycogen dephosphorylation and lafora disease. Mol Cell. 2015;57:261–272. doi: 10.1016/j.molcel.2014.11.020. [DOI] [PMC free article] [PubMed] [Google Scholar]
- Remage-Healey L, Maidment NT, Schlinger BA. Forebrain steroid levels fluctuate rapidly during social interactions. Nat Neurosci. 2008;11:1327–1334. doi: 10.1038/nn.2200. [DOI] [PMC free article] [PubMed] [Google Scholar]
- Rosvall KA, Bergeon Burns CM, Barske J, Goodson JL, Schlinger BA, Sengelaub DR, Ketterson ED. Neural sensitivity to sex steroids predicts individual differences in aggression: implications for behavioural evolution. Proceedings Biological sciences/The Royal Society. 2012;279:3547–3555. doi: 10.1098/rspb.2012.0442. [DOI] [PMC free article] [PubMed] [Google Scholar]
- Shearer KD, Stoney PN, Morgan PJ, McCaffery PJ. A vitamin for the brain. Trends Neurosci. 2012;35:733–741. doi: 10.1016/j.tins.2012.08.005. [DOI] [PubMed] [Google Scholar]
- Song RX, McPherson RA, Adam L, Bao Y, Shupnik M, Kumar R, Santen RJ. Linkage of rapid estrogen action to MAPK activation by ERalpha-Shc. 2002 doi: 10.1210/mend.16.1.0748. [DOI] [PubMed] [Google Scholar]
- Swett MB. Theses, Dissertations, Professional Papers. 2007. Hormonal mediation of a unique behavioral polymorphism in the white-throated sparrow (Zonotrichia albicollis) p. Paper 1246. [Google Scholar]
- Thomas JW, Caceres M, Lowman JJ, Morehouse CB, Short ME, Baldwin EL, Maney DL, Martin CL. The chromosomal polymorphism linked to variation in social behavior in the white-throated sparrow (Zonotrichia albicollis) is a complex rearrangement and suppressor of recombination. Genetics. 2008;179:1455–1468. doi: 10.1534/genetics.108.088229. [DOI] [PMC free article] [PubMed] [Google Scholar]
- Thompson CK, Meitzen J, Replogle K, Drnevich J, Lent KL, Wissman AM, Farin FM, Bammler TK, Beyer RP, Clayton DF, Perkel DJ, Brenowitz EA. Seasonal changes in patterns of gene expression in avian song control brain regions. PloS one. 2012;7:e35119. doi: 10.1371/journal.pone.0035119. [DOI] [PMC free article] [PubMed] [Google Scholar]
- Thorneycroft HB. A Cytogenetic Study of the White-Throated Sparrow, Zonotrichia albicollis (Gmelin) Evolution; international journal of organic evolution. 1975;29:611–621. doi: 10.1111/j.1558-5646.1975.tb00855.x. [DOI] [PubMed] [Google Scholar]
- Trivers RL. Parental investment and sexual selection. In: Campbell B, editor. Sexual Selection and the Descent of Man. Aldine; Chicago, Il: 1972. pp. 136–179. [Google Scholar]
- Tuttle EM. Alternative reproductive strategies in the white-throated sparrow: behavioral and genetic evidence. Behavioral Ecology. 2003;14:425–432. [Google Scholar]
- Tuttle EM, Bergland AO, Korody ML, Brewer MS, Newhouse DJ, Minx P, Stager M, Betuel A, Cheviron ZA, Warren WC, Rusty A, Gonser RA, Balakrishnan CN. The complete genome of the polymorphic white-throated sparrow In review. [Google Scholar]
- Watt DJ. Plumage Brightness Index for White-Throated Sparrows. J Field Ornithol. 1986;57:105–113. [Google Scholar]
- White MJD. Animal cytology and evolution. CUP Archive; 1977. [Google Scholar]
- Whitney O, Pfenning AR, Howard JT, Blatti CA, Liu F, Ward JM, Wang R, Audet JN, Kellis M, Mukherjee S, Sinha S, Hartemink AJ, West AE, Jarvis ED. Core and region-enriched networks of behaviorally regulated genes and the singing genome. Science. 2014;346:1256780. doi: 10.1126/science.1256780. [DOI] [PMC free article] [PubMed] [Google Scholar]
- Wingfield JC, Hahn TP. Testosterone and Territorial Behavior in Sedentary and Migratory Sparrows. Anim Behav. 1994;47:77–89. [Google Scholar]
- Wong RY, McLeod MM, Godwin J. Limited sex-biased neural gene expression patterns across strains in Zebrafish (Danio rerio) BMC genomics. 2014;15:905. doi: 10.1186/1471-2164-15-905. [DOI] [PMC free article] [PubMed] [Google Scholar]
- Wu X, Watson M. CORNA: testing gene lists for regulation by microRNAs. Bioinformatics. 2009;25:832–833. doi: 10.1093/bioinformatics/btp059. [DOI] [PMC free article] [PubMed] [Google Scholar]
- Zhang B, Horvath S. A general framework for weighted gene co-expression network analysis. Statistical applications in genetics and molecular biology. 2005;4 doi: 10.2202/1544-6115.1128. Article 17. [DOI] [PubMed] [Google Scholar]
Associated Data
This section collects any data citations, data availability statements, or supplementary materials included in this article.
Supplementary Materials
Figure S1: Diagram of the locations of punches for a) MeA and b) HYP samples. Circles indicate punched regions. a) The MeA punch contained the ventromedial telencephalon, which is largely composed of the MeA. b) The dorsal HYP punches contained the anterior hypothalamus (AH), the caudal portion of the medial preoptic area (POM), and the paraventricular nucleus (PVN). The ventral punches included the ventromedial hypothalamus (VMH). AC- anterior commissure.
Figure S2: Overlap of genes between MeA and HYP modules. Modules in the MeA and HYP are presented in columns, and rows, respectively. The number of genes shared by each MeA and HYP module is given in the table. The table is color-coded according to the –log of the Fisher’s exact test p-values, as indicated by the color bar on the right. *There was significant overlap in gene membership between the HYP black and MeA greenyellow modules.
Table S1: Correlations between traits and module eigengenes (ME) in the MeA. Numbers in each cell represent the correlation coefficient and p-values are in parentheses. The correlation coefficient values are depicted in the heatmap in Fig. 2a.
Table S2: MeA Network data. This table contains module membership, gene significance (GS) calculations, chromosome location, and corresponding zebra finch, chicken, and human gene annotations for all genes analyzed in the WGCNA. Each row contains information on a gene annotated in the sparrow genome and present in the RNA-seq data. Columns (a) Gene name, (b) Gene description: LOC gene descriptions used in Fig. 4 (c) Ensembl-Gal: chicken Ensembl gene name, (d) Ensembl-Tg: zebra finch Ensembl Gene name, (e) Chr-Gal: chromosome location in chicken, (f) ZAL2: whether or not the gene is located on chromosome 2, (see the Materials and Methods section for details), (g) Inversion: for ZAL2 genes, whether or not the gene is located inside (i) or outside (o) the inversion (h) Module color: color of the module the gene was assigned to. Columns (i-p) contain the values for the correlation (GS) between gene expression and the indicated trait or gene (songs, morph, PC1, and EGR1 expression), and the corresponding p-values (p.GS). (q) kIN: Intramodule connectivity, calculated only for genes in the greenyellow module.
Table S3: Correlations between traits and module eigengenes (ME) in the HYP. Numbers in each cell represent the correlation coefficient, p-values are in parentheses. The correlation coefficient values are depicted in the heatmap in Fig. 2b.
Table S4: HYP network data. Columns (a-p) are the same as in Table S2, (q) contains kIN for genes in the black module.
Table S5: Gene Ontology terms significantly enriched in the modules correlated with song rate and morph. Each row represents an enriched term (p<0.05). Columns represent (a) Module: module in which the term was enriched, (b) GO ID: gene ontology ID, (c) Total: total number of genes annotated with that term, (d) Expectation: expected number of genes in the module (e) Observation: actual number of genes in the module (f) Fisher: enrichement p-value, (g) FDR: false discovery rate, (h) Module genes: genes annotated by the term and present in the module (i) Description: GO term description, (j) Process: GO term process. Terms with fewer than three members or with fewer than two members in the module of interest were removed from the list. *Hub genes.
Supplemental File 1: SNPs calls between the reference genome and the superwhite genome used to generate the alternate ZAL2m contigs.
Supplemental File 2: rRNA sequences added to the enhanced reference genome.
Supplemental File 3: Mitochondrial sequences added to the enhanced reference genome.