Abstract
The retinal pigment epithelial cell (RPE cell) layer protects the photoreceptors of the retina against oxidative stress. The decline of this capacity is believed to be a major factor in the impairment of vision in age-related macular degeneration. Exposure of human adult RPE cells to UV light at predominantly 320–400 nm (UVA light) in the presence of all-trans-retinaldehyde results in photooxidative cytotoxicity. Significant protection of RPE cells was obtained by prior treatment with phase 2 gene inducers, such as the isothiocyanate sulforaphane or a bis-2-hydroxybenzylideneacetone Michael reaction acceptor. The degree of protection was correlated with the potencies of these inducers in elevating cytoprotective glutathione levels and activities of NAD(P)H:quinone oxidoreductase. In embryonic fibroblasts derived from mice in which the genes for the transcription factor Nrf2, the repressor Keap1, or both Nrf2 and Keap1 were disrupted, the magnitude of resistance to photooxidative damage paralleled the basal levels of glutathione and NAD(P)H:quinone oxidoreductase in each cell type. Demonstration of protection of RPE cells against photooxidative damage by induction of phase 2 proteins may shed light on the role of oxidative injury in ocular disease. Moreover, the finding that dietary inducers provide indirect antioxidant protection suggests novel strategies for preventing chronic degenerative diseases, such as age-related macular degeneration.
Because oxidative damage is widely believed to contribute to the etiology and progression of many age-related chronic degenerative diseases, the development of methods for antioxidant protection is a priority and may be broadly relevant to disease prevention (1). Here, we describe a strategy for protecting retinal pigment epithelial cells (RPE cells) against photooxidative damage by coordinate elevation (induction) of the activities of a family of phase 2 genes that protect cells against injury by oxidants and electrophiles (2–5). This study complements and extends our recent demonstration that sulforaphane, a potent phase 2 gene inducer, protects human adult RPE cells against the cytotoxicity of the following oxidants: tert-butyl hydroperoxide, menadione, 4-hydroxynonenal, and peroxynitrite (6). The magnitude of this protection is correlated quantitatively with the elevation of phase 2 genes and glutathione (GSH) levels (6). Jones, Sternberg, and colleagues (7, 8) have also demonstrated protection of RPE cells against oxidative damage by elevation of GSH levels and induction of the phase 2 response.
Oxidative damage has been implicated in the etiology of age-related macular degeneration (AMD), which is the leading cause of blindness among the elderly. AMD entails progressive degeneration of both macular photoreceptors and associated RPE cells. This photoreceptor loss is widely believed to be, in part, secondary to degenerative changes in the RPE layer. Two significant risk indicators for AMD are the formation of drusen and the accumulation of lipofuscin within RPE cells. Drusen and lipofuscin are complex mixtures of oxidation products of lipids and proteins, arising from normal oxidative metabolism and from the photochemical reactions of vision. Decline of the phagocytic protective functions of RPE cells has been implicated in the etiology of AMD (see refs. 9–11 for reviews). Therefore, strategies for protecting RPE cells against photooxidative damage may be particularly important in retarding AMD.
Photooxidative damage of the retina and RPE has been attributed principally to the following two photosensitizers: rhodopsin and lipofuscin. Rhodopsin is a complex of the chromophore 11-cis-retinaldehyde and the apoprotein opsin. The photoconversion of 11-cis-retinaldehyde to all-trans-retinaldehyde (referred to hereafter as retinaldehyde) a process designated as photobleaching of rhodopsin, is integral to vision. Retinaldehyde has been implicated in light-dependent degeneration of the retina. Thus, retinas of rpe65–/– mice, which synthesize opsin but contain neither 11-cis-retinaldehyde nor all-trans-retinaldehyde, are resistant to light toxicity because RPE65, an essential retinol-binding protein, is absent (12, 13). The transport of retinaldehyde in cells is mediated by the ABCR (ATP-binding cassette transporter) localized in the internal membranes of photoreceptors. Lipofuscin accumulates in retinas and RPE cells of abcr+/– mice, and levels of retinaldehyde are elevated in these animals after photobleaching (14, 15). Retinaldehyde is synthesized and accumulates in photoreceptors and RPE cells, and light-induced damage of the eye probably involves destruction of both types of cells (16, 17). Together, these studies provide evidence that chromophores of the retina, such as retinaldehyde or other retinoids, play an important role in light-induced damage of photoreceptors and RPE cells. A few studies have investigated the photooxidative damage of proteins, lipids, and DNA mediated by retinaldehyde (15, 18, 19). To our knowledge, however, there is no information on the photosensitized cytotoxicity of retinaldehyde to RPE cells, in contrast to lipofuscin and A2E, which have been studied extensively (10, 20, 21).
Much effort has been expended on counteracting oxidative damage contributing to AMD by dietary direct-acting antioxidant micronutrients (22). In a recent large-scale clinical trial (23), beta-carotene, tocopherol, and ascorbic acid in combination with zinc significantly retarded the progression of advanced AMD in a high-risk population. In contrast, the feasibility of elevating the activities of the intrinsic cellular antioxidant phase 2 defense systems, which are now recognized as providing major cellular protection against both oxidative and electrophilic stress (3, 5), has been largely ignored.
Transcription of phase 2 genes can be enhanced easily by a wide variety of compounds, many of which are already consumed in the human diet (3, 5), such as sulforaphane, which occurs in broccoli, broccoli sprouts, and other common cruciferous vegetables. Although sulforaphane is not a direct antioxidant, it activates transcription of phase 2 genes, whose products provide chemically versatile, often catalytic, and prolonged “indirect” antioxidant protection (6, 24). Phase 2 proteins that protect against oxidative and electrophile damage include GSH S-transferases, NAD(P)H:quinone oxidoreductase (NQO1), UDP-glucuronosyltransferases, glutamylcysteine ligase (the rate-limiting enzyme in GSH synthesis), epoxide hydrolase, heme oxygenase 1 (HO-1), thioredoxin reductase 1, thioredoxin, and ferritin (3, 5).
Transcription of phase 2 genes depends on activation of upstream regulatory antioxidant response elements (ARE) (4, 25). Interaction of the transcription factor Nrf2 with ARE (in heterodimeric combination with members of the small Maf family) activates the expression of phase 2 genes (26). A cytoplasmic repressor Keap1, anchored to the actin cytoskeleton, binds tightly to Nrf2, restricting its translocation to the nucleus and preventing activation of ARE (27). Inducers disrupt the Keap1–Nrf2 complex and permit migration of Nrf2 to the nucleus, where it binds to ARE sequences and enhances transcription of phase 2 genes. Hence, nrf2 gene knockout mice are useful models for assessing the role of phase 2 genes in protection against electrophile and oxidant stress. Induction of transcription of phase 2 genes is largely abolished in homozygous nrf2–/– mutant mice (26) that have low levels of mRNA and proteins encoded by phase 2 genes and are more susceptible to carcinogens and oxidants than their WT counterparts (28–30).
Here, we report on how phase 2 gene induction protects RPE cells against retinaldehyde-mediated photooxidative damage by examining the relation between the efficacy of protection and the structures and potencies of inducers. Additional evidence for the dependence of protection on regulation of induction of phase 2 genes is provided by quantifying photooxidative damage in fibroblasts from transgenic mice in which keap1 and/or nrf2 gene function has been dysregulated.
Experimental Procedures
Chemicals. Retinoids; hexyl isothiocyanate (ITC); buthionine sulfoximine (BSO); and 3-(4,5-dimethylthiazol-2-yl)-2,5-triphenyl tetrazolium bromide (MTT) were purchased from Sigma. Synthetic sulforaphane [1-isothiocyanato-(4-R,S)-(methylsulfinyl)butane] was obtained from LKT Laboratories (St. Paul, MN). The 2-hydroxy-bis(benzylidene)acetone and 4-hydroxy-bis(benzylidene)acetone were synthesized in our laboratory (31).
Cells. Human adult RPE cells (ARPE-19; catalog no. CRL-2302) were obtained from the American Type Culture Collection. Cells were grown in an atmosphere of 5% CO2/95% air at 37°C in a medium containing equal volumes of DMEM and Hanks' F12 medium supplemented with 10% FBS that had been heated for 90 min at 55°C with 1% (wt/vol) activated charcoal and filtered.
Stable fibroblast lines from 13.5-day-old embryos of nrf2–/–, keap1–/–, and keap1–/–::nrf2–/– double-knockout mice were established by Wakabayashi et al. (32, 33). All fibroblast cell lines were maintained at 37°C in an atmosphere of 5% CO2/95% air, in Iscove's modified Dulbecco's medium plus 10% FBS.
Cell Treatment and Light Exposure. ARPE-19 cells were plated (50,000 cells per well) in 24-well plates (Falcon) and grown for 24 h. Medium was discarded and replaced with medium containing serial dilutions of phase 2 enzyme inducers. After incubation for designated periods, the cells were treated with retinoids in serum-free medium for 2 h in the dark. The medium was then replaced by PBS, and the cells were exposed to UV light of 320–400 nm (UVA light) or fluorescent lights in a box equipped with four UVA lamps (F20T12/BL/HO 2ft; National Biological, Twinsburg, OH) or four commercial 25-W fluorescent lamps, respectively, with a 20-cm distance between cells and light source. The UVA lamps emit predominantly in the 320–400 nm region with a peak at 350 nm, but they also emit small amounts of UVB (<310 nm) and visible radiation. To exclude short-wave UV light all plates were covered with their lids (with cutoff at ≈310 nm). The intensity of UVA was 310 mJ/cm2/min. After light exposure, the cells were grown for 18 h in the dark in serum-free medium, and cell viability was determined. Mouse embryonic fibroblasts were plated at 150,000 cells per well in 24-well plates and treated identically to RPE cells with retinaldehyde and light.
Cell Viability. Culture media were discarded after the designated treatments, and the cells were washed three times with PBS. Each well then received 500 μl of MTT (0.5 mg/ml) in serum-free medium. The plates were incubated for 2 h at 37°C; the MTT solution was discarded; 500 μl of DMSO was added to each well; and the plates were shaken at 200 rpm on an orbital shaker for 5 min. The absorbances of the DMSO solutions were determined at 555 nm and related to those of control cells that were treated identically without retinaldehyde. Cytotoxicity is expressed as “fractional survival” based on the ratio of absorbances at 555 nm of treated cells to controls. In the absence of light, retinaldehyde has negligible effects on the viability of ARPE-19 cells and mouse embryonic fibroblasts.
Preparation of Cell Lysates. RPE cells or mouse fibroblasts were mixed with 0.08% digitonin (60 μl per well for 96-well plates, and 200 μl per well for 24-well plates), incubated at 37°C for 15 min, agitated gently at 150 rpm for 15 min on a platform shaker, and centrifuged at 1,500 × g for 15 min. The supernatant fluid was used for GSH and NQO1 analyses.
GSH Analysis. Total GSH (oxidized and reduced) was determined by the rate of reduction of 5,5′-dithio-bis-(2-nitrobenzoic acid) (DTNB) in a coupled GSH reductase recycling assay (34, 35).
NQO1 Assay. The specific activities of NQO1 were determined by measuring the formation of the blue-brown formazan (by absorption at 610 nm) in reaction mixtures containing cell lysate supernatant fractions, menadione, an NADPH-generating system, and the tetrazolium dye MTT (36, 37).
Analysis of Lipid Peroxidation: Thiobarbituric Acid (TBA) Reactive Substances (TBARS) Assay. ARPE-19 cells were plated at 50,000 cells per well in 24-well plates. After incubation for designated periods, the cells were treated with retinoids in serum-free media for 2 h in the dark. The media were then replaced by PBS, and the cells were exposed to UVA light for 20 min. The cells were washed twice with 0.5 ml of PBS and detached by addition of 0.2 ml of a 0.05% trypsin solution for 5 min. Cell suspensions (200 μl) were mixed with 400 μl of 0.44 M H3PO4/300 μl of 0.6% TBA/25 μl of 0.2% 3,5-di-tert-butyl-4-hydroxyanisole, incubated at 90°C for 45 min, and centrifuged at 10,000 × g for 5 min. An aliquot (50 μl) was loaded onto a Spherisorb 5 ODS (C18, 150 × 4.6 mm; Waters) HPLC column for malondialdehyde quantification. The mobile phase was 50 mM KH2PO4/MeOH (65:35, by vol) at a flow rate of 1 ml/min. The malondialdehyde peak area at 532 nm was integrated and compared with standards.
Intracellular Accumulations of ITC. These determinations were made by cyclocondensation with 1,2-benzenedithiol, which detects both free ITC and their dithiocarbamate (DTC) derivatives. Procedures for cell exposure to ITC, cell harvest, preparation of lysates, and quantification of ITC and DTC in lysates have been described (38–40).
Measurement of Intracellular Accumulation of bis(Benzylidene)acetone Derivatives. All procedures of cell treatment and harvest were the same as for the measurement of intracellular ITC, except that the cell pellets were resuspended in 200 μl of methanol, sonically disrupted for four 15-s periods, and centrifuged at 10,000 × g for 10 min. The supernatant fraction was analyzed by HPLC to determine the content of bis(benzylidene)acetone derivatives. The lysate extracts were injected onto a Sil LC8 column (150 × 4.6 mm; Supelco) and eluted isocratically with methanol/water (80:20, by vol) at a flow rate of 1 ml/min. UV spectra (250–450 nm) of the fractions were obtained to determine their content of 2-hydroxy-bis(benzylidene)acetone and 4-hydroxy-bis(benzylidene)acetone, which have absorption maxima at 368 and 320 nm (am = 36,000 M–1·cm–1), respectively.
Results
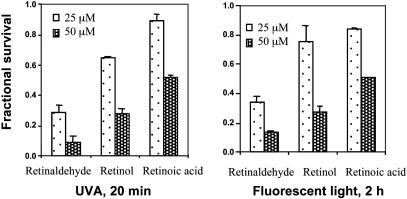
Phototoxicity of Retinoids. Retinoids, which can be considered as vitamin A metabolites, are essential for multiple physiological processes, ranging from vision to embryonic development. Retinol and its aldehyde, retinaldehyde, are major participants in the visual cycle. Retinal gives rise to singlet oxygen under appropriate illumination, resulting in both self-destruction and damage to lipids and other cellular components (1). To elucidate the potency and specificity of retinoid-mediated phototoxicity, ARPE-19 cells were treated with 25 or 50 μM all-trans-retinaldehyde, all-trans-retinol, or all-trans-retinoic acid in the dark for 2 h and then exposed in PBS to UVA light or fluorescent light for 20 min or 2 h, respectively. After further incubation in the dark in serum-free medium for 18 h, cell survival was determined. All three retinoids caused dose-dependent cell death, and all-trans-retinaldehyde was the most potent phototoxic agent among these retinoids (Fig. 1). Thus, at 50 μM concentrations of retinoids and 20 min exposure to UVA, all-trans-retinaldehyde, retinol, and retinoic acid killed 91.1%, 71.2%, and 38.6% of the cells, respectively. For all three retinoids, exposure to UVA light for 20 min (Fig. 1 Left) and fluorescent light for 2 h (Fig. 1 Right) resulted in comparable cytotoxicity. This finding is consistent with the much greater propensity of retinaldehyde than the corresponding alcohol or acid to generate singlet or other reactive oxygen species. However, the three retinoids also have somewhat different absorption spectra, which could also contribute to the disparities in photooxidative damage. To minimize the potentially confounding effects of increases in temperature during illumination, all subsequent experiments were carried out with retinaldehyde and a 20-min exposure to UVA. This system for assessing the phototoxicity of retinaldehyde was highly reproducible.
Fig. 1.
Photosensitized cytotoxicity of retinoids. ARPE-19 cells were treated with 25 or 50 μM retinaldehyde, the corresponding retinol, or retinoic acid for 2 h in the dark; exposed in PBS to UVA (Left) or fluorescent light (Right) for 20 min or 2 h, respectively; and grown in serum-free medium for 18 h. Fractional survival was compared with cells that were treated identically without retinoids. Error bars indicate SD (n = 6; P < 0.001).
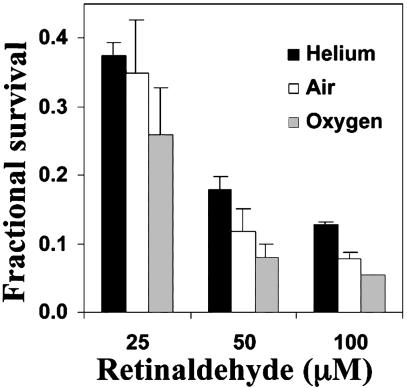
Oxygen Dependence of Phototoxicity. Damage to proteins and lipids mediated by retinaldehyde is oxygen-dependent (15, 19). To determine whether the phototoxicity of retinaldehyde was also oxygen-dependent, ARPE-19 cells in PBS were exposed for 2 h to a series of retinaldehyde concentrations, transferred to sealed chambers filled with 100% oxygen, air, or helium, and exposed for 20 min to UVA in PBS. The cells were then grown for 18 h in serum-free medium in 5% CO2/95% air, and cell survival was determined. Oxygen increased the phototoxicity of retinaldehyde at all concentrations tested, and the cells were more resistant to this toxicity in helium or air (Fig. 2).
Fig. 2.
Oxygen dependence of photosensitized cytotoxicity of retinaldehyde. ARPE-19 cells were treated with 25, 50, or 100 μM retinaldehyde in the dark for 2 h; exposed in PBS to UVA light for 20 min; and grown in serum-free medium for 18 h. Light exposure occurred in 100% helium, 100% oxygen, or air. Fractional survival was compared with cells treated identically without retinaldehyde. Error bars indicate SD (n = 6; P < 0.001).
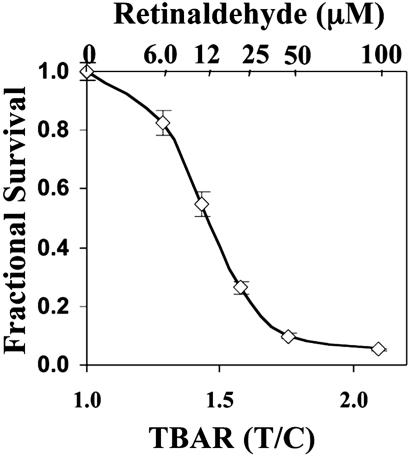
Cytotoxicity and Lipid Peroxidation. It has been suggested that lipid peroxidation may play an important role in the degeneration of photoreceptors and RPE cells (10, 41). Therefore, we examined whether retinaldehyde-induced photooxidative toxicity caused lipid peroxidation in ARPE-19 cells and whether the magnitude of lipid peroxidation correlated with the cytotoxicity. After RPE cells were loaded with a series of concentrations (6.12–100 μM) of all-trans-retinal and illuminated, one set of samples was analyzed for lipid peroxidation by the TBARS assay, and a duplicate set was assayed for cell viability. The results show that the loss in cell viability and the increase in lipid peroxidation were inversely correlated, and both depended on the concentration of retinaldehyde (Fig. 3).
Fig. 3.
Relation between fractional survival and accumulation of lipid peroxidation products (TBARS). ARPE-19 cells were treated with a series of concentrations of retinaldehyde in the dark for 2 h, exposed in PBS to UVA light for 20 min, and grown in serum-free medium for 18 h. Fractional survival at each retinaldehyde concentration and TBARS content (determined by HPLC) were compared with cells treated identically without retinaldehyde. Error bars indicate SD.
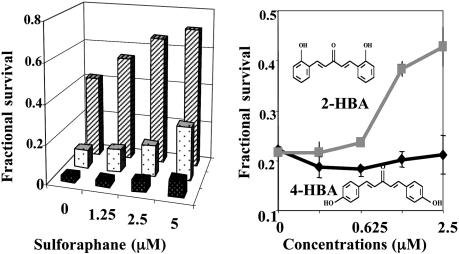
Protective Effects of Sulforaphane. In an earlier study, we showed that prior treatment with sulforaphane provided powerful and long-term protection of RPE cells against the toxicities of various oxidants and that the degree of protection was related to the dose of sulforaphane and correlated quantitatively with induction of the phase 2 response (6). Sulforaphane treatment also protected RPE cells against the photooxidative toxicity of retinaldehyde. Prior treatment of ARPE-19 cells with sulforaphane (1.25–5.0 μM) for 24 h resulted in substantial concentration-dependent protection against exposure to retinaldehyde and light, and the survival of ARPE-19 cells improved as the concentration of sulforaphane was raised (Fig. 4 Left). For example, at 50 μM retinal, only 9.4% of cells survived photooxidation, whereas prior treatment with sulforaphane raised the survival ≈3-fold to 27.4%.
Fig. 4.
Protective effects of phase 2 inducers on photosensitized cytotoxicity of retinaldehyde. ARPE-19 cells were treated with retinaldehyde (25–100 μM) in the dark for 2 h and then exposed in PBS to UVA for 20 min and grown in serum-free medium for 18 h. Fractional survival was compared with cells treated identically without retinaldehyde. Means for six samples (coefficient of variation, <10%) are shown. (Left) Protection against photooxidation by 25 μM (rear bars), 50 μM (middle bars) or 200 μM (front bars) retinaldehyde by prior incubation with sulforaphane (0–5 μM) for 24 h. (Right) Protection against photoxidation by 25 μM retinaldehyde by prior incubation with a series of concentrations of 2-HBA and 4-HBA for 24 h.
Relation Between Chemical Structures and Protective Potencies of Inducers. The potencies of Phase 2 enzyme inducers depend on their structure and reactivity with sulfhydryl groups of a protein sensor in cells (35, 42). For instance, both bis(2-hydroxybenzylidene)acetone (2-HBA) and bis(4-hydroxybenzylidene)acetone (4-HBA) are Michael reaction acceptors and inducers of the phase 2 response, and they differ only in the steric positions of their phenolic hydroxyl groups (Fig. 4 Right). However, 2-HBA is almost 100 times more potent as an inducer than 4-HBA (concentrations required to double NQO1 in murine hepatoma cells are 0.15 and 14 μM, respectively) (31, 35, 42). Accordingly, 2-HBA was a much more potent protector against retinaldehyde-photosensitized oxidation than 4-HBA (Fig. 4 Right). This observation provides another example of the close correlation between the potencies of inducers and their ability to protect against oxidant stress.
Because the UV absorption spectrum of 2-HBA (maximum at 368 nm) partially overlaps the photoactivation spectrum of retinaldehyde (maximum at ≈380 nm), the protective effect of 2-BHA might be attributable to light filtering that reduced photooxidative damage. This possibility was excluded by the finding that 2-HBA is rapidly converted to metabolites that do not absorb in the spectral photoactivation region. Thus, when confluent ARPE-19 cells were incubated with 2-HBA (20 μM) for 0, 2, or 24 h and the intracellular content of 2-HBA was determined by HPLC, the absorption at 368 nm attributable to 2-HBA was dramatically reduced in 2 h and was no longer detectable at 24 h before photooxidation was initiated.
Role of GSH Synthesis in Protection Against Photooxidation. GSH is the most abundant cellular nonprotein thiol. Its synthesis and maintenance in the reduced state are critical for cellular defense against damaging electrophiles and reactive oxidants. The importance of levels and the oxidation status of GSH in the protection of RPE cells against oxidative damage has been documented extensively (43). Induction of phase 2 proteins is invariably accompanied by parallel increases in the tissue levels and rates of synthesis of GSH resulting from transcriptional up-regulation of both regulatory and catalytic subunits of glutamylcysteine ligase, the enzyme that catalyzes the rate-limiting step in GSH synthesis (2, 44). This enzyme is inhibited by BSO, an analogue of methionine, leading to profound depression of cellular GSH levels (45). When ARPE-19 cells were treated with sulforaphane for 24 h in the presence of BSO and then subjected to retinaldehyde-photosensitized oxidation, the protective effects of sulforaphane were partially abolished. The magnitude of this effect depended on the concentrations of BSO (100–500 μM; Table 1). Because BSO is a relatively specific inhibitor of GSH synthesis, these results strongly suggest that synthesis and elevation of GSH levels are important components of the overall protective effects of sulforaphane against photooxidation.
Table 1. Effect of inhibition of GSH synthesis with BSO on the ability of sulforaphane to protect ARPE-19 cells against the photooxidative damage of retinaldehyde.
| Fractional survival at sulforaphane concentrations, μM
|
||||
|---|---|---|---|---|
| BSO, μM | 0 | 1.25 | 2.50 | 5.00 |
| 0 | 0.47 | 0.52 | 0.61 | 0.71 |
| 100 | 0.34 | 0.43 | 0.50 | 0.53 |
| 200 | 0.28 | 0.34 | 0.40 | 0.53 |
| 500 | 0.20 | 0.28 | 0.29 | 0.36 |
After 24 h of incubation with sulforaphane (0-5 μM) and BSO (0-500 μM), the cells were treated with 25 μM retinaldehyde in the dark for 2 h and then exposed in PBS to UVA light for 20 min, and cell viability was measured after incubation in serum-free medium for 18 h. Fractional cell survival was compared with cells treated identically without retinaldehyde. The mean values for six samples are shown.
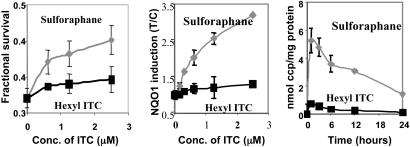
Protective Effect and Accumulation of ITC in RPE Cells. Cellular accumulation levels of ITC determine their potencies in inducing the phase 2 response (38, 40). Two ITCs with related structure, sulforaphane and hexyl ITC, were chosen to investigate the relationship among protective effect, phase 2 enzyme induction, and intracellular accumulation. Sulforaphane was a much more effective protector of RPE cells than hexyl ITC against retinaldehyde-photosensitized cytotoxicity (Fig. 5). Notably, the magnitude of protection was correlated with the potency of induction of the phase 2 response and the intracellular accumulation of the two ITCs.
Fig. 5.
Fractional survival (Left), NQO1 induction (Center), and accumulation of sulforaphane and hexyl ITC metabolites (Right) in ARPE-19 cells. After 24 h of incubation with a range of concentrations (0–2.5 μM sulforaphane or hexyl ITC), the cells were treated with 25 μM retinaldehyde in the dark for 2 h, exposed in PBS to UVA light for 20 min, and grown in serum-free medium for 18 h. Fractional survival was compared with cells treated identically without retinaldehyde. Confluent cells in 10-cm plates were incubated with sulforaphane (5 μM) or hexyl ITC (5 μM) and harvested at the indicated times. The specific activities of NQO1 were determined in cell lysates and are expressed as the ratio of treated (T) to control (C) cells that were not exposed to ITCs. The intracellular accumulation of ITCs (and their conjugates) was determined by the cyclocondensation assay and is expressed as nanomoles of cyclocondensation product (ccp) per milligram of protein. Error bars indicate SD (n = 6).
Importance of the Keap1–Nrf2 Complex in the Protective Effect of Phase 2 Enzymes Against Photooxidative Damage. There is now ample evidence that mice in which the nrf2 gene has been disrupted have low and generally noninducible phase 2 proteins in many tissues and that these animals are much more susceptible to carcinogens and cannot be protected by phase 2 inducers, unlike their WT counterparts (29, 30). These transgenic animals are also much more sensitive to hyperoxia. Thus, 72 h after exposure to hyperoxia, pulmonary hyperpermeability, macrophage inflammation, and epithelial injury in nrf2–/– mice were 7.6-fold, 47%, and 43% greater, respectively, than in nrf2+/+ mice (46).
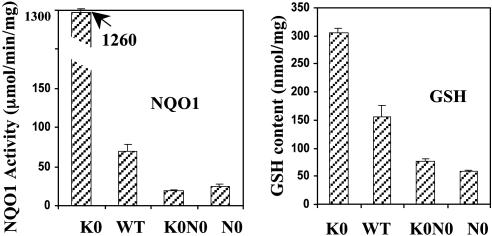
The importance of the Keap1–Nrf2 complex in regulating the protective effect of phase 2 genes against photooxidative damage was demonstrated with nrf2–/–[N0], keap1–/–[K0], and keap1–/–::nrf2–/–[K0N0] double-knockout embryonic fibroblast cell lines established from transgenic mice. We first measured the NQO1 and GSH levels in these knockout cells. The basal levels of NQO1 and GSH were very low in nrf2–/– cells. In contrast, keap1–/– cells had extremely high levels of NQO1 and GSH because Nrf2 was not repressed (Fig. 6). These levels in keap1–/– cells were not only much higher than in nrf2–/– cells and in keap1–/–::nrf2–/– double-knockout cells, but they were also higher than in WT cells (Fig. 6).
Fig. 6.
Basal NQO1-specific activities (Left) and GSH levels (Right) in embryonic fibroblasts derived from WT mice, as well as those in which the keap1 (K0), nrf2 (N0), or keap1 and nrf2 (K0N0) genes were disrupted. Error bars indicate SD (n = 8). Means ± SD for NQO1 (μmol/min/mg protein) and GSH (μmol/mg protein), respectively, for the different cell types were as follows: K0, 1,260 ± 13.8 and 314 ± 10.0; WT, 80.0 ± 8.66 and 173 ± 19.5; K0N0, 19.9 ± 1.38 and 80.0 ± 4.63; and N0, 28.0 ± 2.71 and 58.5 ± 1.11.
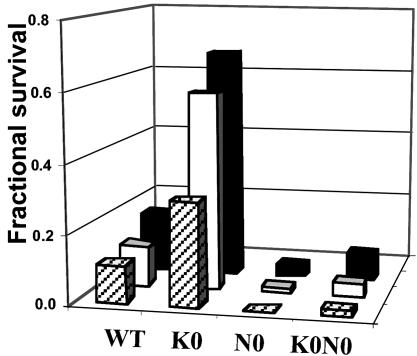
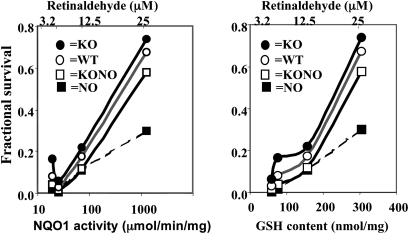
When fibroblasts derived from the three types of transgenic animals were challenged with retinaldehyde and UVA light, their resistance to photooxidative damage differed dramatically and was correlated quantitatively with the corresponding basal levels of phase 2 expression in these cells. Thus, nrf2–/– cells were the most sensitive to photooxidative damage, whereas keap1–/– cells were the most resistant. WT fibroblasts were more resistant than nrf2–/– and keap1–/–::nrf2–/– double-knockout cells but more vulnerable than keap1–/– cells (Fig. 7). After retinaldehyde (6.25–25 μM) induced photooxidative damage, cell viability order was keap1–/– > WT > keap1–/–::nrf2–/– double knockout > nrf2–/– at all tested concentrations of retinaldehyde (Fig. 8). There was a close relation between fractional cell survival and the intrinsic GSH and NQO1 levels (Fig. 8).
Fig. 7.
Photosensitized cytotoxicity of retinaldehyde on mouse embryonic fibroblasts derived from WT mice, as well as those in which keap1 (K0), nrf2 (N0), or keap1 and nrf2 (K0N0) genes were disrupted. Embryonic fibroblasts from these mice were plated at 150,000 cells per well in 24-well plates; treated with 6.25 μM (rear bars), 12.5 μM (middle bars), and 25 μM (front bars) retinaldehyde in the dark for 2 h and then exposed in PBS to UVA for 20 min; and grown in serum-free medium for 18 h. Fractional survival is compared with cells treated identically without retinaldehyde. Results are given as mean values (n = 6).
Fig. 8.
Oxidative photosensitivity of mouse embryo fibroblasts to retinaldehyde. Correlation between basal levels of GSH and specific activities of NQO1 in mouse embryonic fibroblasts derived from WT mice as well as those in which keap1 (K0), nrf2 (N0), or both keap1 and nrf2 (K0N0) genes were disrupted. Mouse embryo fibroblasts were grown for 24 h and then treated with 3.2, 6.3, 12.5, and 25 μM retinaldehyde for 2 h in the dark; exposed in PBS to UVA for 20 min; and grown in serum-free medium for 18 h. Fractional survival is compared with cells treated identically without retinaldehyde.
Discussion
Much evidence points to the central role of oxidative and photooxidative damage in chronic degenerative diseases of the eye, such as AMD. Therefore, development of simple long-term strategies for combating such damage is important. Although some slowing of AMD progression can be achieved by frequent administration of direct-acting antioxidant supplements, the strategy of boosting endogenous phase 2 responses is attractive because it can be achieved by dietary means and does not rely on direct antioxidant action of small molecules that are consumed in the protective process. Induction of phase 2 genes results in the elevation of proteins that exert a spectrum of antioxidant activities, including the synthesis of GSH and its maintenance in the reduced form. These protective effects are mainly catalytic and long-lasting.
In these experiments, we have focused on human adult RPE cells because they are believed to play a major role in protecting photoreceptors against the toxicity of oxidative and photooxidative byproducts of the visual process. Considerable evidence supports the belief that photooxidative damage to ARPE-19 cells caused by retinaldehyde is a relevant model for the chronic degenerative processes. We have presented experimental evidence supporting the conclusion that induction of the phase 2 response is largely, if not exclusively, responsible for the observed protection against photooxidative damage mediated by retinaldehyde in the presence of UV light. Potent inducers such as sulforaphane or certain Michael reaction acceptors are much more effective protectors than closely chemically related but less potent analogues. Moreover, fibroblasts from transgenic mice in which the inducer mechanism is dysfunctional or defective show protection that is quantitatively correlated with the levels of phase 2 components, as reflected in their GSH concentrations and NQO1 activities.
Although most of the experiments reported here were done on RPE cells, the phenomena described are not unique to these cells. Protection against photooxidative damage by retinaldehyde was also observed in mouse embryonic fibroblasts. Fibroblasts from WT and transgenic mice were used because they are much more readily available than RPE cells from these animals. Moreover, we showed in ref. 6 that induction of the phase 2 response protected not only human RPE cells but also mouse L1210 leukemia cells and human keratinocytes against various oxidants. Therefore, we believe that the phenomenon described in this article is of broader significance for a number of cell types. The finding that the ITC sulforaphane, derived from its naturally occurring glucosinolate precursor glucoraphanin, is highly effective in protecting against photooxidative stress is of great interest because sulforaphane is already a component of the human diet and, therefore, is likely to be relatively safe for chronic administration.
Acknowledgments
We thank Albena T. Dinkova-Kostova for the 2-hydroxy-bis(benzylidene)acetone and 4-hydroxy-bis(benzylidene)acetone and for analyses of the transgenic mouse embryonic fibroblasts, which were kindly provided by Nobunao Wakabayashi. We also thank Peter Gehlbach for critical review of the manuscript and Pamela Talalay for advice during its preparation. This work was supported by the Lewis B. and Dorothy Cullman Foundation, grants from the National Cancer Institute, Department of Health and Human Services, Grant CA 94076 and the American Institute for Cancer Research.
Abbreviations: AMD, age-related macular degeneration; BSO, buthionine sulfoximine; GSH, glutathione; 2-HBA, bis(2-hydroxybenzylidene)acetone; 4-HBA, bis(4-hydroxybenzylidene)acetone; ITC, isothiocyanate; MTT, 3-(4,5-dimethylthiazol-2-yl)-2,5-triphenyl tetrazolium bromide; NQO1, NAD(P)H:quinone oxidoreductase; PBS, Dulbecco's PBS; RPE cells, retinal pigment epithelial cells; TBA, thiobarbituric acid; TBARS, TBA reactive substances; sulforaphane, 1-isothiocyanato-4-(methylsulfinyl)butane.
References
- 1.Halliwell, B. & Gutteridge, J. M. C. (1999) Free Radicals in Biology and Medicine (Oxford Science, Oxford), 3rd Ed.
- 2.Hayes, J. D. & McLellan, L. I. (1999) Free Radical Res. 31, 273–300. [DOI] [PubMed] [Google Scholar]
- 3.Talalay, P. (2000) Biofactors 12, 5–11. [DOI] [PubMed] [Google Scholar]
- 4.Hayes, J. D. & McMahon, M. (2001) Cancer Lett. (Shannon, Irel.) 174, 103–113. [DOI] [PubMed] [Google Scholar]
- 5.Talalay, P., Dinkova-Kostova, A. T. & Holtzclaw, W. D. (2003) Adv. Enzyme Regul. 43, 121–134. [DOI] [PubMed] [Google Scholar]
- 6.Gao, X., Dinkova-Kostova, A. T. & Talalay, P. (2001) Proc. Natl. Acad. Sci. USA 98, 15221–15226. [DOI] [PMC free article] [PubMed] [Google Scholar]
- 7.Nelson, K. C., Carlson, J., Newman, M. L., Sternberg, P., Jr., Jones, D. P., Kavanagh, T. J., Diaz, D., Cai, J. & Wu, M. (1999) Invest. Ophthalmol. Visual Sci. 40, 1927–1935. [PubMed] [Google Scholar]
- 8.Nelson, K. C., Armstrong, J. S., Moriarty, S., Cai, J., Wu, M. W., Sternberg, P., Jr. & Jones, D. P. (2002) Invest. Ophthalmol. Visual Sci. 43, 3550–3554. [PubMed] [Google Scholar]
- 9.Winkler, B. S., Boulton, M. E., Gottsch, J. D. & Sternberg, P. (1999) Mol. Vis. 5, 32–42. [PMC free article] [PubMed] [Google Scholar]
- 10.Beatty, S., Koh, H., Phil, M., Henson, D. & Boulton, M. (2000) Surv. Ophthalmol. 45, 115–134. [DOI] [PubMed] [Google Scholar]
- 11.Bok, D. (2002) Proc. Natl. Acad. Sci. USA 99, 14619–14621. [DOI] [PMC free article] [PubMed] [Google Scholar]
- 12.Redmond, T. M., Yu, S., Lee, E., Bok, D., Hamasaki, D., Chen, N., Goletz, P., Ma, J. X., Crouch, R. K. & Pfeifer, K. (1998) Nat. Genet. 20, 344–351. [DOI] [PubMed] [Google Scholar]
- 13.Grimm, C., Wenzel, A., Hafezi, F., Yu, S., Redmond, T. M. & Reme, C. E. (2000) Nat. Genet. 25, 63–66. [DOI] [PubMed] [Google Scholar]
- 14.Mata, N. L., Tzekov, R. T., Liu, X., Weng, J., Birch, D. G. & Travis, G. H. (2001) Invest. Ophthalmol. Visual Sci. 42, 1685–1690. [PubMed] [Google Scholar]
- 15.Sun, H. & Nathans, J. (2001) J. Biol. Chem. 276, 11766–11774. [DOI] [PubMed] [Google Scholar]
- 16.Wu, B. X., Chen, Y., Chen, Y., Fan, J., Rohrer, B., Crouch, R. K. & Ma, J. X. (2002) Invest. Ophthalmol. Visual Sci. 43, 3365–3372. [PubMed] [Google Scholar]
- 17.Yang, M. & Fong, H. K. (2002) J. Biol. Chem. 277, 3318–3324. [DOI] [PubMed] [Google Scholar]
- 18.Harper, W. S. & Gaillard, E. R. (2001) Photochem. Photobiol. 73, 71–76. [DOI] [PubMed] [Google Scholar]
- 19.Ostrovskii, M. A. & Fedorovich, I. B. (1994) Biofizika 39, 13–25. [PubMed] [Google Scholar]
- 20.Sparrow, J. R., Parish, C. A., Hashimoto, M. & Nakanishi, K. (1999) Invest. Ophthalmol. Visual Sci. 40, 2988–2995. [PubMed] [Google Scholar]
- 21.Sparrow, J. R., Zhou, J., Ben Shabat, S., Vollmer, H., Itagaki, Y. & Nakanishi, K. (2002) Invest. Ophthalmol. Visual Sci. 43, 1222–1227. [PubMed] [Google Scholar]
- 22.Snodderly, D. M. (1995) Am. J. Clin. Nutr. 62, 1448S–1461S. [DOI] [PubMed] [Google Scholar]
- 23.Age-Related Eye Disease Study Research Group (2001) Arch. Ophthalmol. 119, 1417–1436. [DOI] [PMC free article] [PubMed] [Google Scholar]
- 24.Fahey, J. W. & Talalay, P. (1999) Food Chem. Toxicol. 37, 973–979. [DOI] [PubMed] [Google Scholar]
- 25.Nguyen, T., Sherratt, P. J. & Pickett, C. B. (2003) Annu. Rev. Pharmacol. Toxicol. 43, 233–260. [DOI] [PubMed] [Google Scholar]
- 26.Itoh, K., Chiba, T., Takahashi, S., Ishii, T., Igarashi, K., Katoh, Y., Oyake, T., Hayashi, N., Satoh, K., Hatayama, I., et al. (1997) Biochem. Biophys. Res. Commun. 236, 313–322. [DOI] [PubMed] [Google Scholar]
- 27.Itoh, K., Wakabayashi, N., Katoh, Y., Ishii, T., Igarashi, K., Engel, J. D. & Yamamoto, M. (1999) Genes Dev. 13, 76–86. [DOI] [PMC free article] [PubMed] [Google Scholar]
- 28.Kwak, M. K., Wakabayashi, N., Itoh, K., Motohashi, H., Yamamoto, M. & Kensler, T. W. (2003) J. Biol. Chem. 278, 8135–8145. [DOI] [PubMed] [Google Scholar]
- 29.Ramos-Gomez, M., Kwak, M. K., Dolan, P. M., Itoh, K., Yamamoto, M., Talalay, P. & Kensler, T. W. (2001) Proc. Natl. Acad. Sci. USA 98, 3410–3415. [DOI] [PMC free article] [PubMed] [Google Scholar]
- 30.Fahey, J. W., Haristoy, X., Dolan, P. M., Kensler, T. W., Scholtus, I., Stephenson, K. K., Talalay, P. & Lozniewski, A. (2002) Proc. Natl. Acad. Sci. USA 99, 7610–7615. [DOI] [PMC free article] [PubMed] [Google Scholar]
- 31.Dinkova-Kostova, A. T., Abeygunawardana, C. & Talalay, P. (1998) J. Med. Chem. 41, 5287–5296. [DOI] [PubMed] [Google Scholar]
- 32.Wakabayashi, N., Itoh, K., Wakabayashi, J., Motohashi, H., Noda, S., Takahashi, S., Imakado, S., Kotsuji, T., Otsuka, F., Roop, D. R., et al. (2003) Nat. Genet. 35, 202–204.14593401 [Google Scholar]
- 33.Wakabayashi, N., Dinkova-Kostova, A. T., Holtzclaw, W. D., Kang, M.-I., Kobayashi, A., Yamamoto, M., Kensler, T. W. & Talalay, P. (2004) Proc. Natl. Acad. Sci. USA 101, 2040–2045. [DOI] [PMC free article] [PubMed] [Google Scholar]
- 34.Anderson, M. E. (1985) Methods Enzymol. 113, 548–555. [DOI] [PubMed] [Google Scholar]
- 35.Dinkova-Kostova, A. T., Massiah, M. A., Bozak, R. E., Hicks, R. J. & Talalay, P. (2001) Proc. Natl. Acad. Sci. USA 98, 3404–3409. [DOI] [PMC free article] [PubMed] [Google Scholar]
- 36.Prochaska, H. J., Santamaria, A. B. & Talalay, P. (1992) Proc. Natl. Acad. Sci. USA 89, 2394–2398. [DOI] [PMC free article] [PubMed] [Google Scholar]
- 37.Fahey, J. W., Zhang, Y. & Talalay, P. (1997) Proc. Natl. Acad. Sci. USA 94, 10367–10372. [DOI] [PMC free article] [PubMed] [Google Scholar]
- 38.Ye, L. & Zhang, Y. (2001) Carcinogenesis 22, 1987–1992. [DOI] [PubMed] [Google Scholar]
- 39.Ye, L., Dinkova-Kostova, A. T., Wade, K. L., Zhang, Y., Shapiro, T. A. & Talalay, P. (2002) Clin. Chim. Acta 316, 43–53. [DOI] [PubMed] [Google Scholar]
- 40.Zhang, Y. & Talalay, P. (1998) Cancer Res. 58, 4632–4639. [PubMed] [Google Scholar]
- 41.Nowak, M., Swietochowska, E., Wielkoszynski, T., Marek, B., Karpe, J., Gorski, J., Glogowska-Szelag, J., Kos-Kudla, B. & Ostrowska, Z. (2003) Eur. J. Ophthalmol. 13, 281–286. [DOI] [PubMed] [Google Scholar]
- 42.Dinkova-Kostova, A. T., Holtzclaw, W. D., Cole, R. N., Itoh, K., Wakabayashi, N., Katoh, Y., Yamamoto, M. & Talalay, P. (2002) Proc. Natl. Acad. Sci. USA 99, 11908–11913. [DOI] [PMC free article] [PubMed] [Google Scholar]
- 43.Davidson, P. C., Sternberg, P., Jr., Jones, D. P. & Reed, R. L. (1994) Invest. Ophthalmol. Visual Sci. 35, 2843–2849. [PubMed] [Google Scholar]
- 44.Wild, A. C. & Mulcahy, R. T. (2000) Free Radical Res. 32, 281–301. [DOI] [PubMed] [Google Scholar]
- 45.Meister, A. (1991) Pharmacol. Ther. 51, 155–194. [DOI] [PubMed] [Google Scholar]
- 46.Cho, H. Y., Jedlicka, A. E., Reddy, S. P. M., Kensler, T. W., Yamamoto, Y., Zhang, L.Y. & Kleeberg, S.R. (2002) Am. J. Resp. Cell Mol. Biol. 26, 175–182. [DOI] [PubMed] [Google Scholar]


