

Abstract
The human brain is topologically organized into a set of spatially distributed, functionally specific networks. Of these networks, the default-mode network (DMN), executive-control network (ECN), and salience network (SN) have received the most attention recently for their vital roles in cognitive functions. However, very little is known about whether and how the interactions within and between these 3 networks would be modulated by cognitive demands. Here, we employed graph-based modularity analysis to identify the DMN, ECN, and SN during an N-back working memory (WM) task and further investigated the modulation of intra- and inter-network interactions at different cognitive loads. As the task load elevated, functional connectivity decreased within the DMN while increased within the ECN, and the SN connected more with both the DMN and ECN. Within-network connectivity of the ventral and dorsal posterior cingulate cortex was differentially modulated by cognitive load. Further, the superior parietal regions in the ECN showed increased internetwork connections at higher WM loads, and these increases correlated positively with WM task performance. Together, these findings advance our understanding of dynamic integrations of specialized brain systems in response to cognitive demands and may serve as a baseline for assessing potential disruptions of these interactions in pathological conditions.
Keywords: connectomics, default-mode network, executive-control network, module, salience network
Introduction
An emerging concept in cognitive neuroscience advocates that cognitive constructs arise from a collection of brain areas acting together as large-scale networks. In support of this concept, functional brain imaging data have revealed that the human brain is topologically organized into a set of domain-specific, distributed brain networks (Damoiseaux et al. 2006; Smith et al. 2009; Power et al. 2011). Of the major brain networks, the default-mode network (DMN), executive-control network (ECN), and salience network (SN) have received the most attention in recent literature (Bressler and Menon 2010; Cocchi et al. 2014). The putative DMN includes mainly the cinguloparietal regions of the medial prefrontal cortex (mPFC), posterior cingulate cortex (PCC), and inferior parietal lobe (IPL). Based on its increased activity in response to internally focused cognitive processes, the DMN is thought to be associated with a range of internal cognitive functions such as self-referential thinking and autobiographical memory (Gusnard et al. 2001; Raichle et al. 2001). In contrast to the DMN, the ECN, distributed in the frontoparietal areas, is typically engaged in a broad spectrum of externally directed tasks and has been implicated in the management of exogenous cognitive functions. The SN, anchored primarily in the bilateral anterior insula (AI) and dorsal anterior cingulate cortex (Seeley et al. 2007), has been proposed to allocate resources to the most homeostatically salient events among internal (involved in the DMN) and external (involved in the ECN) activities (Sridharan et al. 2008; Menon and Uddin 2010).
These 3 brain networks have been reliably identified during passive resting state as well as internally and externally demanding cognitive task states (Smith et al. 2009). Furthermore, it has been demonstrated that functional interactions among these 3 brain networks could reconfigure in response to cognitive tasks. Studies have shown that the task-positive ECN increases its own integration and interactions with the SN to support cognitive processes (Honey et al. 2002; Newton et al. 2011; Ma et al. 2012; Repovš and Barch 2012). Other studies that focused on the DMN also provided evidence of task-induced modulations on its internal and external functional interactions (Fransson 2006; Hampson et al. 2006; Repovš and Barch 2012). However, it is still largely elusive how these 3 large-scale brain networks reconfigure their intra- and inter-interactions in response to cognitive modulations (Cocchi et al. 2014).
In this study, we systematically examined functional interactions within and between the DMN, ECN, and SN in 40 healthy subjects undergoing a functional MRI scan while performing an N-back working memory (WM) task. To identify these 3 brain networks, we used the graph theory-based modularity analysis, which partitions the brain based on its connectivity profiles and therefore naturally provides further information about network interactions (Power et al. 2011; Sporns 2014). Based on the distinct roles of the DMN and ECN in cognitive functioning, we hypothesized that the interactions within the DMN would decrease whereas the interactions within the ECN would increase with elevated cognitive load. Moreover, given the putative role of the SN in toggling activities between the DMN and ECN, we postulated that the interactions between the SN and both the DMN and ECN would be modulated by the cognitive load. We further hypothesized that the interactions of these brain networks would be associated with task performance across individuals.
Materials and Methods
Participants
Forty healthy adults participated in the study. All participants were screened to ensure no history of neurological/psychiatric conditions or drug abuse. Informed consent was obtained from all subjects in accordance with the guidelines of the Institutional Review Board of the Intramural Research Program of the National Institute on Drug Abuse. See Table 1 for population demographics.
Table 1.
Demographic characteristics of the participants
| Demographic factor | |
|---|---|
| Age (years) | 27.4 ± 7.1 |
| Gender (male/female) | 15/25 |
| Education (years) | 14.4 ± 1.52 |
| WAIS vocabulary score | 59.95 ± 7.25 |
| Ethnicity | |
| African American | 17 |
| Asian | 3 |
| Caucasian | 17 |
| Hispanic | 1 |
| Mixed | 2 |
Note: Mean ± SD are shown. WAIS: Wechsler Adult Intelligence Scale.
Imaging Data Acquisition
MRI scans were performed on a 3 Tesla Siemens Allegra MR Scanner (Siemens) equipped with a quadrature volume head coil. High-resolution anatomical images were acquired using a 3-D MPRAGE T1-weighted sequence with 160 slices, 1.0-mm isotropic voxels, repetition time (TR) = 2500 ms, echo time (TE) = 4.38 ms, and flip angle (FA) = 8°. Functional BOLD images were acquired using an echo-planar imaging sequence with TR = 2000 ms, TE = 27 ms, FA = 77°, thirty-nine 4-mm slices without interslice gap, field of view (FOV) = 220 × 220 mm2, and an in-plane resolution of 3.44 × 3.44 mm2. Head movement was minimized using individually custom-made foam padding, and earplugs were used to attenuate scanner noise.
N-back WM task data were acquired for each participant. The task was presented as a block paradigm with 4 conditions: 3 active WM tasks (1-back, 2-back, and 3-back) and a low-level vigilance task (0-back). In the vigilance task, following the instruction “press for D,” participants pressed one button each time the letter D (or d) appeared on the screen. In the 3 active WM task conditions, following the instruction “N back” (where N = [1, 2, 3]), participants pressed a button when the current letter shown on the screen matched the one presented “N” items back. The task included 6 runs, with one 0-back, 1-back, 2-back, and 3-back block in each run and took a total of about 27 min to complete. Each block lasted 62 s and included a 2-s indication of the task difficulty level followed by 30 consecutive trials of single-letter stimuli (500-ms duration and 1500-ms interstimulus interval). Each run therefore lasted 4 min, 24 s and began with an 8-s fixation followed by the 0-back block and then the randomized 1-, 2-, and 3-back blocks. All 6 possible orders of 1b, 2b, and 3b occurred in the 6 runs, with the run order counter-balanced across subjects. An additional 8-s fixation occurred at the end of each run. Visual stimuli were presented and responses were collected using E-Prime (Psychology Software Tools, Inc.). The stimuli were back-projected onto a screen inside the scanner using an LCD projector. The WM fMRI data were previously used by Zou et al. (2013) and Liang et al. (2013) for separate studies.
Image Preprocessing
The fMRI data were preprocessed using the Analysis of Functional Neuroimaging software package (Cox 1996). Preprocessing steps included slice-timing correction, head motion correction, linear trend removal, high-pass filtering with 0.01 Hz, and spatial smoothing (FWHM = 6 mm). The task-state time series of each run were divided into separate conditions (0-back, 1-back, 2-back, and 3-back) as follows: For each 60-s block in each run, the first 4 volumes (8 s) were discarded and 2 volumes (4 s) of the next block were included to minimize the effects of hemodynamic delay from previous conditions (Mostofsky et al. 2009). Then, all task fMRI data were aligned to their corresponding T1-weighted images, and normalized fMRI images were created by applying the transformation of T1-weigthed images to the ICBM452 template. Finally, several nuisance variables, including 6 head motion parameters, the averaged signal from white matter, and the averaged signal from ventricles were removed by multiple linear regression analysis.
Network Construction
To confine the network node definition within brain regions that are related to the WM task, we created a task mask as an “or” combination of the significant activation maps for the 1-back, 2-back, and 3-back conditions compared with the 0-back condition. Briefly, task activation maps for the 1-back, 2-back, and 3-back conditions compared with the 0-back condition were generated using general linear models of box-car regressors convolved with a hemodynamic response function for the 3 WM task conditions. Quadratic trends and the 6 motion parameters were included as covariates of no interest. For each task condition, a one-sample t-test was performed across subjects against the null hypothesis. The significance threshold was set to P < 0.01 corrected for whole brain multiple comparisons based on Monte Carlo simulations (Cox 1996); this threshold corresponded to an uncorrected single voxel significance level of P < 0.01 and a minimum cluster size of 297 mm3.
For each individual, we extracted time courses from the task mask and computed the voxel-wise Pearson correlation matrix within each block. We then averaged across the 6 runs for each task load condition and thresholded the resultant correlation matrices to generate binary brain graphs. We used a set of thresholds ranging from 1% to 5% connection density with a step of 1%. The lowest threshold (1%) was determined to ensure that the resulting graphs are not severely fragmented (the largest component size >90%), whereas the highest threshold (5%) was set to remove weak correlations so that only the correlations whose corresponding P-values passed a statistical threshold (P < 0.05) were retained. The P-values were corrected for multiple comparisons using the false discovery rate procedure at a q-value of 0.05. Note that the negative correlations took only a very small portion in the voxel-wise correlation matrices after the thresholding process no matter the global signal was removed or not, here we only focused on the positive connections in our analysis by setting the negative correlations to zero.
Modularity Analyses
The resulting brain graphs were then subjected to a graph-based modularity analysis to identify brain modules (i.e., brain networks) and to estimate module-based graph properties.
To identify modules (i.e., groups of nodes that are highly connected with each other but less connected with other nodes), a module identification algorithm optimizes the total number of modules and the associated module membership of nodes by maximizing modularity, Q, which was defined as follows:
where M is the number of modules, ls is the number of within-module edges in the module s, L is the total number of edges in the network, ds is the sum of the degrees at each node in the module s, and the degree of a node is the number of linked edges within the given node (Newman 2004). In practice, the modularity of a network with a strong modular structure typically ranges from 0.3 to 0.7 (Newman and Girvan 2004). In this study, we used the Louvain algorithm (Blondel et al. 2008), a fast and relatively accurate algorithm suitable for detecting modules in large networks.
For each task condition, the modularity analysis was first performed on every individual brain graph. Given that module number and membership vary between subjects, we also performed the modularity analysis on group-level brain graphs to determine the modular structure at each task load. For the group-level analysis, a group brain graph was obtained by averaging all correlation matrices across the subjects and then thresholding at each of the pre-selected network densities from 1% to 5%. After the group-level modular analysis, the similarity between the modularity partition obtained at 0-back and that obtained at the 1-back, 2-back, and 3-back conditions was estimated using normalized mutual information (NMI) (Danon et al. 2005), a measure of the similarity between 2 partitions that ranges from 0 for unrelated partitions to 1 for identical partitions. DMN, SN, and ECN modules, which were of particular interest in the present study, were selected from the module partitions at each task load by visual inspection. Since the modular partitions were very similar between task loads according to the NMI analysis (see Results), we used the modules of DMN, SN, and ECN at the low-level task state of 0-back to compute the following module-based graph properties at both module and nodal levels.
At the module level, the intramodule connectivity was calculated as the sum of connections within a module, whereas the intermodule connectivity was calculated as the sum of connections between any pair of 2 modules.
At the nodal level, we measured the within-module degree (WD) z-score and participation coefficient (PC) across the modules of DMN, SN, and ECN (Guimera and Amaral 2005a, b). WD measures the normalized degree of connections of a node within its corresponding module:
where ki is the number of intramodule connections of a node i within module s, and ks is the average number of intramodule connections of all nodes in module s. is the standard deviation of the intramodule connection numbers of all nodes in module s. Thus, zi will be large for a node that has a large number of intramodule connections relative to other nodes in the same module. The PC for node i is defined as follows:
where NM is the number of modules and kis is the number of connections between the node i and module s. ki is the total number of connections of node i in the network. The PC of node i will be close to one if its connections are distributed among different modules and zero if it is connected exclusively within its own module.
Statistical Analysis
We used a repeated-measures analysis of variance (ANOVA), with WM load as a within-subject fixed effect, to determine the effect of memory load on each module-based graph metric. For module-wise measures (i.e., intra-/inter-module connectivity), the significant threshold was set at 0.05/6 = 0.0083 using a Bonferroni correction method for multiple comparisons. For those network metrics showing significant effects of WM load, statistical differences between all pairs of memory load levels were estimated using paired t-tests. The Bonferroni-corrected significance threshold was set at 0.05/6 = 0.0083. For nodal-wise (i.e., voxel-wise) WD and PCs, the significance level was set at Pcorrected < 0.05 combined with a cluster threshold of 68 voxels based on Monte Carlo and an uncorrected single voxel significance level of P < 0.05. Subsequently, paired t-tests were performed on the averaged WD/PC values of the brain regions that were significantly modulated by WM load. The Bonferroni-corrected significance threshold was set at 0.05/6 = 0.0083.
To test whether WM task-related network measures might correlate with behavioral performance, Pearson correlation analyses were carried out with dprime. Dprime is defined as the difference between the normalized values of the hit rates and false alarm rates. The better the participant maximizes hits and minimizes false alarms, the better the participant performs to discriminate target during the task, and then the higher dprime scores (Haatveit et al. 2010). Note that we did not use the reaction time as a measure of task performance because we did not specifically instruct the subjects to respond as quickly as possible during the WM task. Task-related network measures were calculated as the ratio of each WM task load (1-back, 2-back, and 3-back) to its baseline (0-back) value; behavioral performance was accordingly calculated as the ratio of dprime under each task load to that under 0-back. The analyses were performed for the 2-back and 3-back conditions only, as performance in the 1-back condition was at its ceiling.
Validation Analysis
To evaluate the reliability of our results, we examined the influences of different preprocessing and analysis strategies. First, we explored the reproducibility of our results with global signal regression, given that there is still ongoing debate about the complex composition of global signal, which likely originates from both nuisance (e.g., respiration, cardiac signals, etc.) and neuronal signals (Schölvinck et al. 2010; Chai et al. 2012; Saad et al. 2012). Second, we also repeated our analyses on weighted networks to evaluate the reproducibility of our findings.
Results
Behavior Analysis
There was significant WM load-effect in task performance as measured by dprime (F3,156 = 125.02, P < 0.005) (Supplementary Fig. 1). Post hoc t-tests using Bonferroni correction for multiple comparisons revealed that dprime was significantly different between each pair of the 2 conditions (P < 0.01). As noted earlier, dprime was calculated on the basis of the hit rate and the false alarm rate. WM load has significant effects in both hit rate (F3,156 = 20.43, P < 0.005) and false alarm rate (F3,156 = 125.03, P < 0.005) (Supplementary Fig. 1). Post hoc t-tests using Bonferroni correction for multiple comparisons found that both these 2 measures were significantly different between each pair of the 2 conditions (P < 0.01).
Brain Module Identification
By combining the task activation maps across task loads, we obtained a WM-related task mask consisting of both task-activated and -deactivated regions. Task-activated regions included the inferior and middle frontal gyrus, superior parietal lobe (SPL), AI, dorsal ACC, and thalamus (Fig. 1A), whereas the deactivated regions were observed in the medial prefrontal cortex, PCC, hippocampus/parahippocampal gyrus, paracentral and postcentral gyrus, superior frontal gyrus, superior temporal gyrus, and cuneus (Fig. 1A)
Figure 1.

Illustration of module identification results. (A) Task mask generated from a combination of activation/deactivation maps across 1-back, 2-back, and 3-back against 0-back. Modularity analyses were performed within this mask. Brain areas showing task-related activation are depicted in red; areas showing task-related deactivation are depicted in blue. (B) The mean modularity across subjects obtained for 0-back, 1-back, 2-back, and 3-back at network sparsities ranging from 1% to 5%. (C) Module partitions of the 0-back brain graph thresholded at the highest density of 1%. (D) Maps of the DMN (blue), ECN (red), and SN (yellow) at 0-back, 1-back, 2-back, and 3-back. (E) A spring-embedded layout of nodes and edges within the DMN, ECN, and SN networks at 0-back. The network was visualized with the Pajek program (Batagelj and Mrvar 1998).
Modularity analysis was performed on brain graphs within the task mask over a range of density thresholds. All subjects showed high modularity Q-values at all 4 WM task loads across the density range (Fig. 1B). As the network density decreased, modularity Q increased monotonically. A two-way repeated ANOVA revealed no significant effect of task load on modularity (F3,117 = 1.19, P = 0.317). There was also no significant interaction between task load and density threshold (F12,468 = 1.477, P = 0.129). NMI was computed for module partitions obtained from the group brain graphs between different density thresholds and between task loads. For each task load, NMI ranged from 0.55 to 0.85, indicating similar module assignments across thresholds. For each density threshold, the NMI of module partitions between task loads also exhibited high values (ranging from 0.61 to 0.85), indicating the module structure of the brain network was relatively stable across different task loads. Given the above observation of highly consistent module assignments between density thresholds and task loads, we chose to report our results based on the module partitions of the 0-back brain graph thresholded at the sparsest density of 1%.
Figure 1C plots the module assignments of the 0-back brain network at 1% threshold onto the brain surface. A total of 16 modules were identified, including the DMN, SN, and ECN modules, which were selected for further analysis. As illustrated in Figure 1D, the 3 networks of DMN, SN, and ECN were present at all task loads. The DMN module is composed of regions of the rostral ACC, mPFC, superior frontal cortex, inferior temporal lobe, PCC/precuneus (PCu), and inferior parietal cortex; the SN module includes regions of dorsal ACC and bilateral insula; and the ECN module includes primarily the bilateral lateral frontal and parietal cortices. Figure 1E depicts the 3 modules in a spring-embedded layout, where ties act as springs to position the nodes in space such that well-connected groups of nodes are pulled together.
Load-Dependent Changes in Interactions among the DMN, ECN, and SN
Module-Wise Changes
We then examined how interactions within and between DMN, SN, and ECN networks varied with WM load. Repeated-measures ANOVA revealed significant main effects of WM load on intra-module connectivity within the DMN (F4, 40 = 13.3, P < 0.001) and ECN modules (F4, 40 = 8.17, P < 0.001). Post hoc tests indicated that connectivity within the DMN decreased when WM load increased from 0-back to 2-back and 3-back, and from 1-back to 2-back and 3-back (Fig. 2A), whereas connectivity within the ECN network increased from 0-back to 1-back, 2-back, and 3-back (Fig. 2B).
Figure 2.

Load-dependent differences in intranetwork connections within the DMN (A) and the ECN (B), and internetwork connections between the SN and the DMN (C) and between the SN and the ECN (D). Error bars refer to SE. **Pcorrected < 0.05, *Puncorrected < 0.05.
Significant effects of WM load on intermodule connectivity between the SN and DMN modules (F4, 40 = 11.7, P < 0.001) and between the SN and ECN modules (F4, 40 = 5.28, P = 0.0019) were also observed. The SN module routed more connections to both the DMN and ECN networks with increasing WM load. Connectivity between the SN and DMN networks increased significantly from 0-back to 2-back and 3-back, and from 1-back to 2-back and 3-back (Fig. 2C), whereas connectivity between the SN and ECN increased significantly from 0-back to 1-back and 3-back (Fig. 2D). By correlating between beta weights (activation/deactivation) and changes in module-wise connectivity, we found that the task deactivation correlated negatively with SN-DMN connectivity (r = −0.34, P = 0.035) at 3-back, whereas the task activation correlated positively with SN-DMN connectivity (r = 0.35, P = 0.027) at 3-back (Supplementary Fig. 2). However, these correlations were not significant after correcting for multiple comparisons.
Note that connectivity within the ECN module and connectivity between the SN and ECN modules reached its highest value at 1-back and then dropped at 2-back and 3-back in comparison with the 1-back condition, but these differences did not reach the statistical threshold after correction for multiple comparisons.
Nodal-Wise Changes
We then moved on to characterizing the topological roles of each node (i.e., voxel) within and between the DMN, SN, and ECN modules, and determining whether and how they were modulated by increasing WM load.
Two standard network metrics, WD and PC, were used to depict the localization and diversity of connections linked to every node. WD helps to identify the nodes that are highly connected within their own modules. Fig 3A mapped the WD onto the brain surface, which exhibited very similar spatial patterns across the 4 memory loads. Brain regions of high WD were located in the PCC and mPFC within the DMN module, the bilateral AI within the SN module, and the bilateral posterior parietal gyrus within the ECN module. A repeated-measure ANOVA revealed that the WD was significantly modulated by WM load in the regions of the mPFC/ACC, left IPL, and ventral and dorsal PCC (Fig. 3B). Post hoc paired t-tests further revealed that WD in the ventral PCC and left IPL decreased significantly when WM load increased from 0-back to 2-back and 3-back, and from 1-back to 2-back and 3-back, whereas WD in mPFC/ACC and dorsal PCC increased significantly when WM load increased from 0-back to 2-back and 3-back, and from 1-back to 2-back and 3-back (Fig. 3C).
Figure 3.

Load-dependent effects in WD. (A) The WD map at 0-back, 1-back, 2-back, and 3-back. (B) Repeated-measures ANOVA revealed significantly modulated WD values by task load in the ACC (1) and ventral PCC (2), dorsal PCC (3), and left IPL (4). (C) Significant differences in WD across the 4 task loads in the 4 regions. Error bars refer to SE. *Pcorrected < 0.05.
The PC measures the extent to which a node connects to different modules other than its own. Low PCs indicate that nodes are solely connected within their own modules, whereas higher coefficients indicate that their connections are distributed in a variety of modules. Fig. 4A shows very similar patterns of PCs at different WM loads. Brain regions with high PCs were mainly distributed in the bilateral AI, bilateral frontal and parietal gyrus, dorsal ACC, and dorsal PCC. Significant effects of WM load were observed in the mPFC/ACC, PCC, left SPL, and right MFG (Fig. 4B). Further post hoc tests indicated that PCs in these regions increased significantly when WM load increased from 0-back to 2-back and 3-back, and from 1-back to 2-back and 3-back (Fig. 4C). The observed increase of PC in the PCC covered both its ventral and dorsal components; however, given the opposite patterns in the change of WD of these 2 PCC subregions, it may worth further exploring whether they have different profiles of connectivity change with ECN and/or SN modules. Thus, we anatomically partitioned the PCC cluster into a dorsal subregion and a ventral subregion. We then separately computed the ROI-module connectivity for these 2 subregions as the number of connections between the subregion and the ECN or SN module. Repeated ANOVA analysis revealed that while the ventral PCC had more connections with both ECN and SN modules, the dorsal PCC showed more connections only with the SN module (Supplementary Fig. 3). This result indicated that although both ventral and dorsal PCC had increased PC as task load increased, these 2 PCC subregions could be distinguished by the different patterns of their connectivity change with the ECN module.
Figure 4.

Load-dependent effects in PC. (A) The PC map at 0-back, 1-back, 2-back, and 3-back. (B) Repeated-measures ANOVA revealed significantly modulated PC values by task load in the rACC (1) and PCC (2), left SPL (3), and right MFG (4). (C) Significant differences in PC across the 4 task loads in the 4 regions. Error bars refer to SE. *Pcorrected < 0.05.
We further found that the PC of the left SPL correlated positively with WM task performance at the 3-back level (r = 0.39, P = 0.01) (Fig. 5); that is, the subjects with higher PC values in the left SPL performed better during the 3-back WM task. This result indicates that the interactions of left SPL with other brain modules may play vital role in predicting individual variations in performing the WM task. Therefore, we went on to explore the detailed connectivity pattern of the left SPL to answer 2 further questions: 1) which specific regions are left SPL more connected with during high loads; (2) which specific connections with left SPL would correlate with the WM performance. We first computed the connectivity between left SPL and every other voxels within the task mask as the number of connections between a specific voxel and the voxels within the left SPL region. Repeated ANOVA and post hoc analysis revealed increasing trends (uncorrected P < 0.05) in connectivity between left SPL with frontoparietal cortices, dorsal ACC, and precuneus as task load increased (Supplementary Fig. 4). By correlating WM performance dprime and left SPL connectivity, we found that dprime correlated positively with the connectivity between left SPL and the regions of bilateral lateral frontal and parietal cortices, right AI, dorsal anterior, and posterior cingulate cortices at 3-back under an uncorrected significance level of P < 0.05 (Supplementary Fig. 5).
Figure 5.

Relationship between WM task performance and PC in the left SPL at 3-back. (A) PC in the region of the left SPL showed significant modulation effect of task loads (3-back–0-back). (B) Plot of the average changes in PC (3-back/0-back) in the left SPL against dprime (3-back/0-back).
Reproducibility of the Findings
With global signal regression, most of our above-mentioned findings in task load-effect on intra- and inter-module connectivity remained similar (Supplementary Fig. 6). However, the positive correlation between the PC in the left SPL and WM task performance was no longer significant (r = 0.24, P = 0.15). This result partly supported the notion that the global signal is reflective of neuronal signals and the removal of it could wash out interesting variance related to behavioral performance. When applying our analyses on weighted networks, most of our findings reported above were reproducible except for the increased SN–ECN connectivity as task load increased (Supplementary Fig. 7).
Discussion
We used graph-based modularity analysis to identify the DMN, ECN, and SN, the 3 brain networks that are thought to play important roles in cognitive function and dysfunction. By assessing functional interactions within and between each of these 3 brain networks during an N-back WM task, we aimed to elucidate whether and how their interactions are modulated by cognitive load. Our results showed that as WM load increased, functional connectivity decreased within the DMN and increased within the ECN. Additionally, the SN connected more with both the DMN and ECN. We further identified specific brain regions that were modulated by increasing cognitive load in terms of their within-network or between-network connectivity profile.
Modular Organization of Brain Networks in WM Tasks
Modularity analysis showed that functional brain graphs exhibited modular organization with high modularity at all WM loads, which is consistent with previous findings during both resting (He et al. 2009; Power et al. 2011) and task states (Kitzbichler et al. 2011). Modular topology is “optimal” for brain networks because it provides greater robustness, adaptability, and evolvability of network function (Meunier et al. 2010). Since modular organization favors functional segregations through relatively rapid within-module processes, a less modular structure would be expected during cognitively effortful conditions that support brain-wide global integration and synchronization (Kitzbichler et al. 2011). Although we did not find a significant cognitive load-dependent effect on modularity, we observed a trend of decreases in modularity at higher cognitive loads (2-back and 3-back) compared with lower cognitive loads (0-back and 1-back) (Fig. 1B), suggesting that the functional brain network is adapting toward a more globally oriented organization.
We also noticed that the spatial distribution of brain modules was largely preserved across the 4 task conditions and that the major modules, especially the DMN, ECN, and SN which were of particular interest in the current study, showed spatial patterns consistent with those identified during a task-free resting state (Power et al. 2011). These observations suggest that the modular topology is a fundamental setting of the brain system; while each brain module may specialize in specific functions, an integration of modules through dynamic interactions is necessary in order to perform a complex, cognitively demanding task.
Intranetwork Interactions Modulated by Cognitive Load
We found in this study that the functional interactions within the DMN and ECN were modulated by WM load. Firstly, we found that connectivity within the ECN increased at high loads of the WM task, which is consistent with previous studies showing increased connectivity among ECN areas during cognitive tasks (Honey et al. 2002; Nagel et al. 2011; Newton et al. 2011; Ma et al. 2012; Repovš and Barch 2012). In contrast, functional connectivity within the DMN decreased as cognitive load increased, which is in accordance with prior studies showing down-regulated activity and connectivity within the DMN during cognitive tasks (Fransson 2006; Repovš and Barch 2012). This finding also confirms that the internally oriented DMN may become less involved as cognitive demand increases. More interestingly, we found that the standard graph metric of WD for every node (i.e., voxel) did not homogeneously decrease across the DMN; regions of the ventral PCC and left IPL showed significantly decreased within-module connectivity whereas the mPFC/ACC and dorsal PCC exhibited increased within-module connectivity as the cognitive load increased.
Internetwork Interactions Modulated by Cognitive Load
At high cognitive loads of the WM task, we found increased connections between the SN and both the ECN and DMN. More specifically, at the nodal level, DMN regions of the mPFC/ACC and PCC and ECN regions of the SPL and MFG showed increased PCs at high WM loads, indicating that intermodule connections increase as WM load increases. These findings are consistent with previous studies showing increased integration between the frontoparietal and the cingulo-opercular regions (Nagel et al. 2011; Repovš and Barch 2012; Cocchi et al. 2014) and between DMN regions and the SN (Leech et al. 2011; Repovš and Barch 2012) during cognitively demanding states.
The SN has been proposed to monitor the most salient event among internal and external stimuli and to dynamically relocate resources between the ECN and DMN according to the cognitive requirements of the salient event (Menon and Uddin 2010). Sridharan et al. (2008) demonstrated that the key region of the SN, the right AI, acts as a “causal hub” in activating the frontoparietal ECN and deactivating the DMN across task paradigms and stimulus modalities. A recent study has shown that damage to the white matter tracts within the SN can result in abnormality of DMN function and deficits in inhibitory control, suggesting that the structural integrity of the SN is necessary for efficient regulation of activity in the DMN for efficient cognitive control (Bonnelle et al. 2012). Together with this evidence, our observations of increased integration between the SN and both the ECN and DMN during high WM loads suggest that as task demands increase, the SN may engage more closely with brain areas mediating high-order cognitive processes while disengaging the internally directed DMN regions to facilitate externally oriented task implementation. Moreover, although marginal, we observed the increased connectivity between SN and DMN correlated negatively with deactivation and positively with activation, which indicate that the interactions between SN and DMN may mediate local activity of both default mode and ECNs in responding to elevated cognitive load.
Lastly, we observed a significant relationship between participant coefficient in the right SPL and task performance at the 3-back level, indicating that individuals who had more intermodule connections with the SPL tended to have better task performance. The SPL is a central region within the ECN and has been associated with the manipulation and rearrangement of information in WM (Koenigs et al. 2009). Previous studies have demonstrated that greater activity in the SPL during WM tasks can predict superior task performance (Wager and Smith 2003). Our results complementarily suggest that the SPL actively interacts with other WM-related regions during the task and that the degree of interactions contributes to the proficiency of task performance.
Ventral and Dorsal PCC Connections in WM Tasks
The PCC is a central region in the DMN (Buckner et al. 2008; Hagmann et al. 2008) and also one of the most metabolically active brain regions (Raichle et al. 2001; Liang et al. 2013). Recent studies suggest that the PCC can be separated into ventral and dorsal components in terms of their distinct cytoarchitectonics (Vogt et al. 2006) and functional connectivity patterns (Margulies et al. 2009; Leech et al. 2012). While the ventral part of the PCC connected solely with other DMN regions and is involved in internally directed functions, the dorsal PCC has broad connections to both DMN and cognitive control areas and has been thought to work together with the SN to detect and regulate the internal and external events (Margulies et al. 2009; Leech et al. 2012). In line with previous studies showing opposite patterns in the change of between-network interactions for ventral and dorsal PCC subregions at higher task load (Leech et al. 2011), we found that as WM load increases, the ventral PCC showed decreased within-module interactions in DMN and increased intermodule interactions with ECN, whereas the dorsal PCC exhibited increased within-module connectivity with DMN but no significant changes in its interactions with ECN. These findings demonstrate the functional heterogeneousness of the ventral and dorsal parts of the PCC. The relatively decreased connectivity with DMN and increased connectivity with ECN in ventral PCC during high cognitive loads might reflect a suppression of internally directed cognition in support of cognitive engagement in the externally oriented WM task. In contrast, the dorsal PCC showed increased functional integration with both DMN and SN as task load increases, which may indicate that the dorsal PCC is actively involved in mediating attention directed externally at higher task loads.
Our results are largely in consistence with existing theories about the neural mechanism of WM. WM is the process to maintain and manipulate information that no longer present in the immediate environment but necessary for future adaptive behavior. Active maintenance of temporarily maintained information and executive control are 2 key components during the WM process (Miyake and Shah 1999). Empirical evidences strongly indicate that the active maintenance of task-relevant representations may be represented by sustained activity in the prefrontal and posterior parietal cortices (D'Esposito et al. 1999; Curtis and D'Esposito 2003). Our findings of increased functional connectivity among the frontoparietal regions as a function of WM task load may provide further support on the neural mechanisms of maintenance processes. Moreover, our results of the intermodule connectivity reorganization emphasize the mechanism of the monitoring and detection of the internal and external environment for the cognitive control process during the implementation of the WM task.
Figure 6 schematically summarizes the connectivity architecture changes during the WM task. As the WM load increases, functional interactions within and between the ECN, SN, and ECN networks reorganized in response to the task load. While the intra-network connectivity increased in ECN and decreased in DMN at a higher task load, the SN exhibited more connections to both ECN and DMN. These results are largely consistent with previous WM studies (Hampson et al. 2006; Newton et al. 2011; Ma et al. 2012; Repovš and Barch 2012) and extend our understanding of the neural substrates of WM from focal activity changes within frontoparietal regions to the reorganization of functional connectivity between these regions. Our findings also provide evidence to support the notion that the dynamic interactions among ECN, SN, and DMN may play vital role during cognitive functions (Cocchi et al. 2014). Interesting results were also observed regarding the regional-specific changes with increasing WM load. For example, the differential load-dependent changes in ventral and dorsal PCC may update our understanding about the function of the DMN regions as involved solely in internal cognitive processing, and the increased intermodule connectivity of key ECN regions may indicate the importance of system-wise cooperation and integration to support the implementation of demanding tasks.
Figure 6.
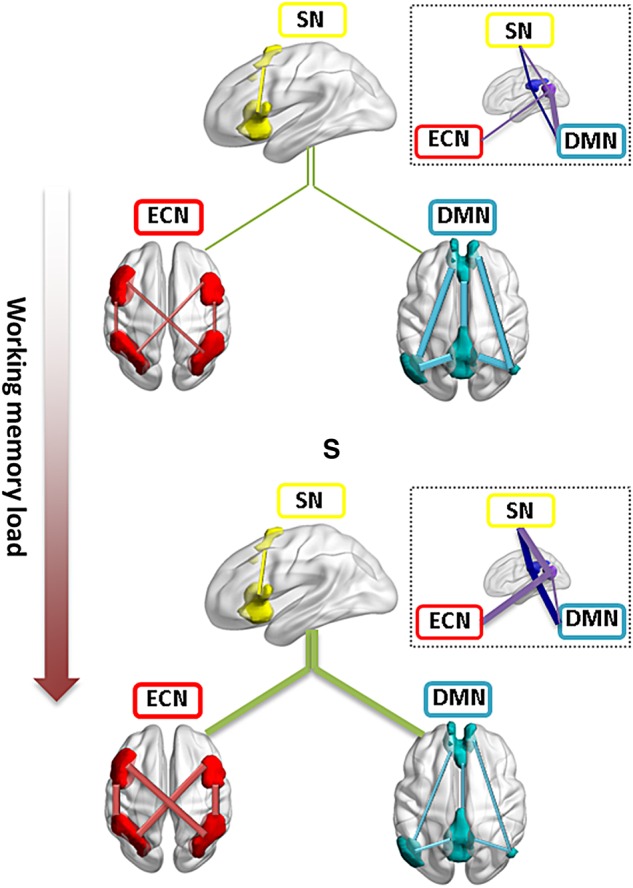
Schematic illustration of the load-dependent reorganization of intra- and inter-module connectivity among the DMN, SN, and ECN. As task load increases, connectivity within DMN decreased whereas connectivity within ECN increases. SN showed more connections to both DMN and ECN. The inset figure circled by dashed lines shows the heterogeneous changes in intermodule connectivity for ventral (purple) and dorsal (dark blue) PCC subregions. The lines match the color of the brain modules or regions. Module-level intermodule connections are depicted in green color. PCC, posterior cingulate cortex. The 3D brain regions were drawn using the BrainNet viewer (www.nitrc.org/projects/bnv (Xia et al. 2013)).
Further Considerations
There are several issues that need to be addressed in the present study. First, although we used imaging voxels to construct brain networks, there are other approaches to doing so such as those based on structurally or functionally defined brain regions (Wang et al. 2009; Craddock et al. 2012). Further investigation will be necessary to compare our current voxel-wise observations with those from region-wise brain networks and to provide more insights on the impact of different nodal definitions. Second, the interactions within/between different brain regions/networks were unidirectional; it would be interesting to include directional information using analyses such as granger causality analysis (Roebroeck et al. 2005) and dynamic causal modeling (Friston et al. 2003) to explore the causal influences of signaling in cortical circuits. Third, it might be worth exploring how these intra- and inter-network connections change in patients with neuropsychiatric disorders such as Alzheimer's disease and depression, given that previous studies have shown declines of various cognitive functions associated with the DMN, ECN, and SN (Menon 2011).
In conclusion, the present study demonstrated that while the spatial contents of the DMN, ECN, and SN were largely consistent across different WM task loads, functional connectivity within and between these 3 brain networks was modulated by increasing WM load. These findings advance our understanding of the dynamic interactions of specialized functional systems in normal cognition and provide a baseline for assessing their potential disruptions in neuropsychiatric disorders.
Supplementary Material
Supplementary material can be found at: http://www.cercor.oxfordjournals.org/.
Funding
This work was supported by the Intramural Research Program of the National Institute on Drug Abuse (NIDA), National Institutes of Health, USA; Natural Science Foundation of China Grants 81030028 and 31221003 (Y.H.); National Science Fund for Distinguished Young Scholars Grant 81225012 (Y.H.); and Natural Science Foundation of China Grant 81201142 (QH.Z).
Supplementary Material
Notes
We thank Julia K. Brynildsen for helpful discussion of the manuscript. Conflict of Interest: None declared.
References
- Batagelj V, Mrvar A. 1998. Pajek-program for large network analysis. Connections. 21:47–57. [Google Scholar]
- Blondel V, Guillaume J, Lambiotte R, Lefebvre E. 2008. Fast unfolding of communities in large networks. J Stat Mech. 2008:P10008. [Google Scholar]
- Bonnelle V, Ham TE, Leech R, Kinnunen KM, Mehta MA, Greenwood RJ, Sharp DJ. 2012. Salience network integrity predicts default mode network function after traumatic brain injury. Proc Natl Acad Sci USA. 109:4690–4695. [DOI] [PMC free article] [PubMed] [Google Scholar]
- Bressler SL, Menon V. 2010. Large-scale brain networks in cognition: emerging methods and principles. Trends Cogn Sci. 14:277–290. [DOI] [PubMed] [Google Scholar]
- Buckner RL, Andrews-Hanna JR, Schacter DL. 2008. The brain's default network: anatomy, function, and relevance to disease. Ann NY Acad Sci. 1124:1–38. [DOI] [PubMed] [Google Scholar]
- Chai XJ, Castañón AN, Ongür D, Whitfield-Gabrieli S. 2012. Anticorrelations in resting state networks without global signal regression. Neuroimage. 59:1420–1428. [DOI] [PMC free article] [PubMed] [Google Scholar]
- Cocchi L, Halford GS, Zalesky A, Harding IH, Ramm BJ, Cutmore T, Shum DH, Mattingley JB. 2014. Complexity in Relational Processing Predicts Changes in Functional Brain Network Dynamics. Cereb Cortex. 24:2283–2296. [DOI] [PubMed] [Google Scholar]
- Cocchi L, Zalesky A, Fornito A, Mattingley JB. 2013. Dynamic cooperation and competition between brain systems during cognitive control. Trends Cogn Sci. 17:493–501. [DOI] [PubMed] [Google Scholar]
- Cox RW. 1996. AFNI: software for analysis and visualization of functional magnetic resonance neuroimages. Comput Biomed Res. 29:162–173. [DOI] [PubMed] [Google Scholar]
- Craddock RC, James GA, Holtzheimer PE, Hu XP, Mayberg HS. 2012. A whole brain fMRI atlas generated via spatially constrained spectral clustering. Hum Brain Mapp. 33:1914–1928. [DOI] [PMC free article] [PubMed] [Google Scholar]
- Curtis CE, D'Esposito M. 2003. Persistent activity in the prefrontal cortex during working memory. Trends Cogn Sci. 7:415–423. [DOI] [PubMed] [Google Scholar]
- Damoiseaux JS, Rombouts SA, Barkhof F, Scheltens P, Stam CJ, Smith SM, Beckmann CF. 2006. Consistent resting-state networks across healthy subjects. Proc Natl Acad Sci USA. 103:13848–13853. [DOI] [PMC free article] [PubMed] [Google Scholar]
- Danon L, Díaz-Guilera A, Duch J, Arenas A. 2005. Comparing community structure identification. J Stat Mech. 2005:P09008. [Google Scholar]
- D'Esposito M, Postle BR, Ballard D, Lease J. 1999. Maintenance versus manipulation of information held in working memory: an event-related fMRI study. Brain Cogn. 41:66–86. [DOI] [PubMed] [Google Scholar]
- Fransson P. 2006. How default is the default mode of brain function? Further evidence from intrinsic BOLD signal fluctuations. Neuropsychologia. 44:2836–2845. [DOI] [PubMed] [Google Scholar]
- Friston KJ, Harrison L, Penny W. 2003. Dynamic causal modelling. Neuroimage. 19:1273–1302. [DOI] [PubMed] [Google Scholar]
- Guimera R, Amaral L. 2005a. Cartography of complex networks: modules and universal roles. J Stat Mech. 2005:P02001. [DOI] [PMC free article] [PubMed] [Google Scholar]
- Guimera R, Amaral L. 2005b. Functional cartography of complex metabolic networks. Nature. 433:895–900. [DOI] [PMC free article] [PubMed] [Google Scholar]
- Gusnard DA, Akbudak E, Shulman GL, Raichle ME. 2001. Medial prefrontal cortex and self-referential mental activity: relation to a default mode of brain function. Proc Natl Acad Sci USA. 98:4259–4264. [DOI] [PMC free article] [PubMed] [Google Scholar]
- Haatveit BC, Sundet K, Hugdahl K, Ueland T, Melle I, Andreassen OA. 2010. The validity of d prime as a working memory index: results from the “Bergen n-back task”. J Clin Exp Neuropsychol. 32:871–880. [DOI] [PubMed] [Google Scholar]
- Hagmann P, Cammoun L, Gigandet X, Meuli R, Honey CJ, Wedeen VJ, Sporns O. 2008. Mapping the structural core of human cerebral cortex. PLoS Biol. 6:e159. [DOI] [PMC free article] [PubMed] [Google Scholar]
- Hampson M, Driesen NR, Skudlarski P, Gore JC, Constable RT. 2006. Brain connectivity related to working memory performance. J Neurosci. 26:13338–13343. [DOI] [PMC free article] [PubMed] [Google Scholar]
- He Y, Wang J, Wang L, Chen ZJ, Yan C, Yang H, Tang H, Zhu C, Gong Q, Zang Y, et al. 2009. Uncovering intrinsic modular organization of spontaneous brain activity in humans. PLoS One. 4:e5226. [DOI] [PMC free article] [PubMed] [Google Scholar]
- Honey GD, Fu CH, Kim J, Brammer MJ, Croudace TJ, Suckling J, Pich EM, Williams SC, Bullmore ET. 2002. Effects of verbal working memory load on corticocortical connectivity modeled by path analysis of functional magnetic resonance imaging data. Neuroimage. 17:573–582. [PubMed] [Google Scholar]
- Kitzbichler MG, Henson RN, Smith ML, Nathan PJ, Bullmore ET. 2011. Cognitive effort drives workspace configuration of human brain functional networks. J Neurosci. 31:8259–8270. [DOI] [PMC free article] [PubMed] [Google Scholar]
- Koenigs M, Barbey AK, Postle BR, Grafman J. 2009. Superior parietal cortex is critical for the manipulation of information in working memory. J Neurosci. 29:14980–14986. [DOI] [PMC free article] [PubMed] [Google Scholar]
- Leech R, Braga R, Sharp DJ. 2012. Echoes of the brain within the posterior cingulate cortex. J Neurosci. 32:215–222. [DOI] [PMC free article] [PubMed] [Google Scholar]
- Leech R, Kamourieh S, Beckmann CF, Sharp DJ. 2011. Fractionating the default mode network: distinct contributions of the ventral and dorsal posterior cingulate cortex to cognitive control. J Neurosci. 31:3217–3224. [DOI] [PMC free article] [PubMed] [Google Scholar]
- Liang X, Zou Q, He Y, Yang Y. 2013. Coupling of functional connectivity and regional cerebral blood flow reveals a physiological basis for network hubs of the human brain. Proc Natl Acad Sci USA. 110:1929–1934. [DOI] [PMC free article] [PubMed] [Google Scholar]
- Ma L, Steinberg JL, Hasan KM, Narayana PA, Kramer LA, Moeller FG. 2012. Working memory load modulation of parieto-frontal connections: evidence from dynamic causal modeling. Hum Brain Mapp. 33:1850–1867. [DOI] [PMC free article] [PubMed] [Google Scholar]
- Margulies DS, Vincent JL, Kelly C, Lohmann G, Uddin LQ, Biswal BB, Villringer A, Castellanos FX, Milham MP, Petrides M. 2009. Precuneus shares intrinsic functional architecture in humans and monkeys. Proc Natl Acad Sci USA. 106:20069–20074. [DOI] [PMC free article] [PubMed] [Google Scholar]
- Menon V. 2011. Large-scale brain networks and psychopathology: a unifying triple network model. Trends Cogn Sci. 15:483–506. [DOI] [PubMed] [Google Scholar]
- Menon V, Uddin LQ. 2010. Saliency, switching, attention and control: a network model of insula function. Brain Struct Funct. 214:655–667. [DOI] [PMC free article] [PubMed] [Google Scholar]
- Meunier D, Lambiotte R, Bullmore ET. 2010. Modular and hierarchically modular organization of brain networks. Front Neurosci. 4:200. [DOI] [PMC free article] [PubMed] [Google Scholar]
- Miyake A, Shah P. 1999. Models of working memory: Mechanisms of active maintenance and executive control. New York: Cambridge University Press. [Google Scholar]
- Mostofsky SH, Powell SK, Simmonds DJ, Goldberg MC, Caffo B, Pekar JJ. 2009. Decreased connectivity and cerebellar activity in autism during motor task performance. Brain. 132:2413–2425. [DOI] [PMC free article] [PubMed] [Google Scholar]
- Nagel IE, Preuschhof C, Li SC, Nyberg L, Bäckman L, Lindenberger U, Heekeren HR. 2011. Load modulation of BOLD response and connectivity predicts working memory performance in younger and older adults. J Cogn Neurosci. 23:2030–2045. [DOI] [PubMed] [Google Scholar]
- Newman M. 2004. Fast algorithm for detecting community structure in networks. Phys Rev E. 69: 066133. [DOI] [PubMed] [Google Scholar]
- Newman ME, Girvan M. 2004. Finding and evaluating community structure in networks. Phys Rev E Stat Nonlin Soft Matter Phys. 69:026113. [DOI] [PubMed] [Google Scholar]
- Newton AT, Morgan VL, Rogers BP, Gore JC. 2011. Modulation of steady state functional connectivity in the default mode and working memory networks by cognitive load. Hum Brain Mapp. 32:1649–1659. [DOI] [PMC free article] [PubMed] [Google Scholar]
- Power JD, Cohen AL, Nelson SM, Wig GS, Barnes KA, Church JA, Vogel AC, Laumann TO, Miezin FM, Schlaggar BL, et al. 2011. Functional network organization of the human brain. Neuron. 72:665–678. [DOI] [PMC free article] [PubMed] [Google Scholar]
- Raichle ME, MacLeod AM, Snyder AZ, Powers WJ, Gusnard DA, Shulman GL. 2001. A default mode of brain function. Proc Natl Acad Sci USA. 98:676–682. [DOI] [PMC free article] [PubMed] [Google Scholar]
- Repovš G, Barch DM. 2012. Working memory related brain network connectivity in individuals with schizophrenia and their siblings. Front Hum Neurosci. 6:137. [DOI] [PMC free article] [PubMed] [Google Scholar]
- Roebroeck A, Formisano E, Goebel R. 2005. Mapping directed influence over the brain using Granger causality and fMRI. Neuroimage. 25:230–242. [DOI] [PubMed] [Google Scholar]
- Saad ZS, Gotts SJ, Murphy K, Chen G, Jo HJ, Martin A, Cox RW. 2012. Trouble at rest: how correlation patterns and group differences become distorted after global signal regression. Brain Connect. 2:25–32. [DOI] [PMC free article] [PubMed] [Google Scholar]
- Schölvinck ML, Maier A, Ye FQ, Duyn JH, Leopold DA. 2010. Neural basis of global resting-state fMRI activity. Proc Natl Acad Sci USA. 107:10238–10243. [DOI] [PMC free article] [PubMed] [Google Scholar]
- Seeley WW, Menon V, Schatzberg AF, Keller J, Glover GH, Kenna H, Reiss AL, Greicius MD. 2007. Dissociable intrinsic connectivity networks for salience processing and executive control. J Neurosci. 27:2349–2356. [DOI] [PMC free article] [PubMed] [Google Scholar]
- Smith SM, Fox PT, Miller KL, Glahn DC, Fox PM, Mackay CE, Filippini N, Watkins KE, Toro R, Laird AR, et al. 2009. Correspondence of the brain's functional architecture during activation and rest. Proc Natl Acad Sci USA. 106:13040–13045. [DOI] [PMC free article] [PubMed] [Google Scholar]
- Sporns O. 2014. Contributions and challenges for network models in cognitive neuroscience. Nat Neurosci. 17:652–660. [DOI] [PubMed] [Google Scholar]
- Sridharan D, Levitin DJ, Menon V. 2008. A critical role for the right fronto-insular cortex in switching between central-executive and default-mode networks. Proc Natl Acad Sci USA. 105:12569–12574. [DOI] [PMC free article] [PubMed] [Google Scholar]
- Vogt BA, Vogt L, Laureys S. 2006. Cytology and functionally correlated circuits of human posterior cingulate areas. Neuroimage. 29:452–466. [DOI] [PMC free article] [PubMed] [Google Scholar]
- Wager TD, Smith EE. 2003. Neuroimaging studies of working memory: a meta-analysis. Cogn Affect Behav Neurosci. 3:255–274. [DOI] [PubMed] [Google Scholar]
- Wang J, Wang L, Zang Y, Yang H, Tang H, Gong Q, Chen Z, Zhu C, He Y. 2009. Parcellation-dependent small-world brain functional networks: a resting-state fMRI study. Hum Brain Mapp. 30:1511–1523. [DOI] [PMC free article] [PubMed] [Google Scholar]
- Xia M, Wang J, He Y. 2013. BrainNet Viewer: a network visualization tool for human brain connectomics. PLoS One. 8:e68910. [DOI] [PMC free article] [PubMed] [Google Scholar]
- Zou Q, Ross TJ, Gu H, Geng X, Zuo XN, Hong LE, Gao JH, Stein EA, Zang YF, Yang Y. 2013. Intrinsic resting-state activity predicts working memory brain activation and behavioral performance. Hum Brain Mapp. 34:3204–3215. [DOI] [PMC free article] [PubMed] [Google Scholar]
Associated Data
This section collects any data citations, data availability statements, or supplementary materials included in this article.