

Abstract
While the 3T3-L1 adipocyte model is routinely used for the study of obesity and diabetes, the mitochondrial respiratory profile in normal versus high glucose has not been examined in detail. We matured adipocytes in normal (5 mM) or high (30 mM) glucose and insulin and examined the mitochondrial bioenergetics. We also assessed the requirement for the Unfolded Protein Response (UPR) and ER stress under these conditions. Basal respiration was ∼1.7-fold greater in adipocytes that had matured in 30 mM glucose; however, their ability to increase oxygen consumption in response to stress was impaired. Adipogenesis proceeded in both normal and high glucose with concomitant activation of the UPR, but only high glucose was associated with increased levels of ER stress and mitochondrial stress as observed by parallel increases in CHOP and protein succination. Treatment of adipocytes with sodium phenylbutyrate relieved mitochondrial stress through a reduction in mitochondrial respiration. Our data suggests that mitochondrial stress, protein succination and ER stress are uniquely linked in adipocytes matured in high glucose.
Keywords: Adipocyte, Cysteine, Diabetes, Fumarate, Phenylbutyrate, Succination, Uncoupler
Introduction
Adipose tissue is composed of a network of cell types including adipocytes and macrophages that play a central role in the maintenance of nutrient homeostasis and hormonal secretion (Orr 2014, Rosen 2014). Increased adipose tissue mass during the development of type 2 diabetes is associated with increased macrophage infiltration and hypertrophied adipocytes that have compromised metabolic and endocrine functions. We have identified a chemical modification of proteins that appears to increase selectively in adipose tissue during type 2 diabetes (Thomas 2012). This protein modification, known as S-2-succinocysteine (2SC), is derived from the irreversible reaction between the Krebs cycle metabolite fumarate and cysteine residues on proteins, and is also termed protein succination (Alderson 2006, Nagai 2007). Mechanistically, the increase in succination is related to the nature of adipocyte metabolism; in the presence of nutrient excess (glucotoxicity) the adipocyte produces more ATP than is energetically required and this leads to an increase in the mitochondrial membrane potential (ΔΨm) and the NADH/NAD+ ratio. Consequently, the NAD+-dependent enzymes of the Krebs cycle are inhibited resulting in an increase in fumarate and protein succination (Frizzell 2012). We have further confirmed this by demonstrating that chemical uncouplers, which can relieve the increased ΔΨm, are able to reduce mitochondrial stress and the accumulation of succinated proteins (Frizzell 2012). We have identified ∼40 succinated proteins in adipocytes (Merkley 2013, Nagai 2007, Piroli 2014,) and we have demonstrated that succination appears to impair protein function or regulation, e.g. increased succination of adiponectin in the presence of high glucose can reduce the polymerization and secretion of this adipokine (Frizzell 2009). Interestingly we have observed that several endoplasmic reticulum (ER) proteins, including the oxidoreductase protein disulfide isomerase (PDI), are succinated in the adipocyte during diabetes (Nagai 2007). This may be significant considering that the unfolded protein response (UPR, a response to the accumulation of misfolded proteins) and ER stress develop in 3T3-L1 adipocytes grown in 30 mM glucose (Basseri 2009, Han 2013a). ER stress has also been documented in the adipose tissue of diet induced obese (DIO) (Lefterova 2009), ob/ob (Ozcan 2006), db/db mice (Han 2009) and in the adipose tissue of obese insulin-resistant humans (Boden 2008, Gregor 2009). However, although these studies document the presence of ER stress in diabetes, the direct initiator of adipocyte ER stress remains to be elucidated. We propose that increased succination of proteins may contribute to the accumulation of misfolded proteins and that this links mitochondrial stress to ER stress. We investigated the effect of sodium phenylbutyrate (PBA), an agent that reduces ER stress in adipocytes (Basseri 2009, Ozcan 2006), to determine if this compound may also be acting on the mitochondria and potentially limiting protein succination and ER stress in a different manner.
The 3T3-L1 adipocyte model is a widely accepted model for the study of adipocyte function in obesity and diabetes. These studies are often conducted in the presence of high (25-30 mM) glucose concentrations as many cell lines are commonly maintained under these conditions. However, recent reports have documented that extracellular glucose concentrations have a significant impact on the measurement of mitochondrial bioenergetics (Valsecchi 2013) and this is of importance for experimental conditions examining mitochondrial function in diabetes. While several studies have examined adipocytes cultured in both 5 mM (normal) and 25-30 mM (high) glucose (Gagnon 1998, Han 2007, Lin 2005) the majority of published studies with 3T3-L1 adipocytes appear to be conducted in high glucose medium. We have previously demonstrated that the levels of protein succination are dependent on the glucose concentration; 2SC is increased in a concentration dependent manner in adipocytes cultured in 10 - 30 mM glucose (Nagai 2007). In this study, we examined the impact of glucose and insulin concentrations on mitochondrial bioenergetics, markers of ER stress and protein succination in adipocytes. Our data highlights the role of mitochondrial stress and ER stress in the adipocyte as a function of nutrient conditions. In addition, we demonstrate that PBA alters mitochondrial bioenergetics in the adipocyte during maturation in high glucose medium.
2. Materials and methods
2.1 Chemicals
Unless otherwise noted, all chemicals were purchased from Sigma/Aldrich Chemical Co (St. Louis, MO & Milwaukee, WI). DNA extraction solvents were from Life Technologies (Grand Island, NY). Criterion polyacrylamide gels and Precision Plus protein ladder were purchased from BioRad Laboratories (Richmond, CA). PVDF membrane and ECL Plus chemiluminescent substrate were from GE Healthcare (Piscataway, NJ). Pierce® ECL 2 Western Blotting Substrate was from Thermo Scientific (Rockford, IL). Sodium phenylbutyrate (PBA) was from Enzo Life Sciences. Saturated phenol and phenol/chloroform/isoamyl alcohol were from Life Technologies (Grand Island, NY). The synthesis of 2-succinocysteamine (2SCEA) and preparation of polyclonal anti-2SC antibody has been described previously (Nagai 2007).
2.2 3T3-L1 Adipocyte Culture
Murine 3T3-L1 fibroblasts were obtained from American Type Cell Culture (Manassas, VA). Confluent monolayers were differentiated into adipocytes in DMEM containing 255 nM dexamethasone, 500 μM IBMX and 160 μM insulin as described previously (Nagai 2007). After differentiation, the adipocytes were matured in DMEM containing either 5 mM glucose and 0.3 nM insulin or 30 mM glucose and 3 nM insulin. Cells cultured in 5 mM glucose were supplemented with 5 mM glucose daily and several hours prior to protein harvest to maintain glucose levels. Cells were harvested in 500 μl radio immuno precipitation assay (RIPA) lysis buffer (50 mM Tris-HCl, 150 mM NaCl, 1 mM EDTA, 1% Triton X-100, 0.1% SDS, 0.5% sodium deoxycholate, pH 7.4, 2 mM ethylenediaminetetraacetic acid (EDTA), 2 mM sodium fluoride, 2 mM sodium orthovanadate, and protease inhibitors). The cell lysate was pulse sonicated at 2 watts RMS using a Model 100 sonic dismembrator (Fisher Scientific, Fair Lawn, NJ) for 3 seconds 3 times each. The protein was precipitated with 9 volumes of cold acetone for 10 min on ice. After centrifugation at 2000 × g for 10 min and removal of the acetone the protein pellet was resuspended in RIPA buffer. The protein content was determined by the Lowry assay (Lowry 1951).
2.3 Western Immunoblotting
Western blotting was performed using the Bio-Rad Criterion System. Proteins were resolved on Criterion TGX gels at 200V for 1 hour and transferred to PVDF membranes at 40 mA overnight or 250 mA for 100 minutes. Detection of protein succination was performed as previously described using a polyclonal anti-2SC antibody (Nagai 2007). Antibodies for PPARγ, cleaved caspase 3, GAPDH, eIF2α, p-eIF2α, succinate dehydrogenase (SDHA), fumarase, PDI, calreticulin, and Ero1-Lα were from Cell Signaling Technologies (Danvers, MA). NDUFS4 was from Abcam (Cambridge, MA). β-tubulin, and Grp78 were from Santa Cruz Biotech (Dallas, TX). Monoclonal anti-CHOP was from Thermo Fisher Scientific (Waltham, MA). Anti-adiponectin was from R&D systems (Minneapolis, MN). Chemiluminescent signals were captured on photographic film (Denville Scientific, Metuchen, NJ). Image J software (NIH) was used to quantify band intensity by densitometry.
2.4 Measurement of Oxygen Consumption Rate (OCR)
Murine 3T3-L1 fibroblasts were seeded on V7 cell culture microplates coated with 0.2% gelation at a density of 10,000 cells/well. After 72 hours, the cells were differentiated and matured as described in section 2.2. The Seahorse extracellular flux analyzer 24 XF-24 was used to measure the oxygen consumption rate (OCR). XF Assay Medium was supplemented with 1 mM sodium pyruvate and the glucose and insulin concentrations described above. After measurement of basal respiration, oligomycin (5 μg/mL), carbonyl cyanide 4-(trifluoromethoxy)phenylhydrazone (FCCP) (1.25 μM), rotenone/antimycin A (3 μM/4 μM) were added sequentially to determine ATP production/proton leak, spare respiratory capacity and non-mitochondrial respiration. After completion of the assay, the medium was removed and the cells were washed 3 times with cold PBS. The plate was stored at -70°C prior to the measurement of the total DNA content using the CyQuant® Assay (Invitrogen, Grand Island, NY).
2.5 Measurement of Mitochondrial Membrane Potential
Mitochondrial membrane potential (ΔΨm) was measured using the fluorescent potentiometric dye 5,5′,6,6′-tetra-chloro-1,1′,3,3′-tetraethylbenzimidazolyl-carbocyanine iodide (JC-1) (Molecular Probes, Eugene, OR). Briefly, 3T3-L1 adipocytes were cultured in 24-well plates and treatments in maturation medium were continued for 2 days, which was the optimal time point for measurement of ΔΨm. After 2 days in various treatments, the cells were incubated with 10 μg/ml JC-1 dye for 20 min at 37°C. The cells were then washed and resuspended in 200 μl PBS and JC-1 fluorescence was measured on a Tecan Safire 2 microplate reader (Tecan, Zurich, Switzerland). The fluorescence of the JC-1 monomer was measured at 485nm excitation/535nm emission and the fluorescence of the JC-1 aggregate was measured at 550nm excitation/600nm emission. The aggregate/monomer ratios (600/535) were used to assess ΔΨm. Cells treated with 10 μM CCCP were used as a positive control to demonstrate partial depolarization of the mitochondrial membrane.
2.6 Measurement of triglycerides, glucose, and inflammatory markers
Triglyceride content was measured in 10 μl aliquots of cell lysates using the Infinity™ Triglycerides assay kit (Thermo Fisher Scientific, Waltham, MA), according to the manufacturer's instructions. Glucose concentration was measured in phenol red free medium using the Amplex® Red Glucose/Glucose Oxidase Assay kit (Invitrogen, Grand Island, NY). The media on 3T3-L1 adipocytes was replaced with serum-free DMEM for 18 hrs prior to collection of the media. Pro-inflammatory cytokines in the conditioned media were analyzed by ELISA according to the manufacturer's instructions (Mouse Obesity ELISA, Signosis, Santa Clara, CA).
2.7 Mitochondrial DNA isolation and content analysis
Cell lysates were collected in 500 μL PBS and centrifuged at 2000 rpm for 5 min to yield a pellet which was resuspended in 350 μL DNA lysis buffer (10 mM Tris-HCl, pH7.5, 400 mM NaCl, 2.5 mM EDTA , and 0.1% SDS)and 50 μL of 50 mg/mL proteinase K and heated at 55°C overnight. The tubes were inverted to dissolve any remaining solid then extracted in a 1:1 ratio of lysis buffer:saturated phenol, pH 7.9. The samples were then centrifuged at 10,000 × g for 5 min, the supernatant was collected and extracted in a 1:1 ratio, supernatant:phenol/chloroform/isoamyl alcohol (25:24:1), pH 7.9 and centrifuged at 10,000 × g for 5 min. The supernatant was collected and the DNA was precipitated with 350 μL 100% ethanol and 35 μL of 3 M sodium acetate, pH 5.2, and collected by centrifugation at 10,000 × g for 2 min. The DNA pellet was washed with 70% ethanol, dried, and then resuspended in 100 μL water .Quantitative real-time PCR analysis was carried out in 25 μl reactions consisting of 2 × SYBR green PCR buffer (AmpliTaq Gold DNA Polymerase, Buffer, dNTP mix, MgCl2) (Applied Biosystems, Foster City, CA, USA), 0.150 μg DNA, molecular grade water, and 60 nM of each primer. The primer sequences were: Cytochrome B Forward, 5′ - ATT CCT TCA TGT CGG ACG AG −3′; Cytochrome B Reverse, 5′ - ACT GAG AAG CCC CCT CAA AT - 3′, GAPDH Forward, 5′ - TTG GGT TGT ACA TCC AAG CA - 3′; GAPDH Reverse, 5′ - CAA GAA ACA GGG GAG CTG AG - 3′. The samples were analyzed on an ABI 7300 Sequence Detection System. Reactions were incubated for 2 min at 50°C and 10 min at 95°C, followed by 40 cycles consisting of a 15 s denaturing step at 95°C and 1 min annealing/extending step at 60°C. Data were analyzed using ABI software (Applied Biosystems, Foster City, CA, USA). using the cycle threshold (CT), which is the cycle number at which the fluorescence emission is midway between detection and saturation of the reaction. The 2-Δ CT method was used to determine changes in gene expression between Cytochrome B with GAPDH CT as the correction factor.
2.8 Data Analysis
All graphs were generated in Sigmaplot 11. Statistical analyses of the data were performed on SigmaStat software (Sigmaplot 11, San Jose, CA). All data were plotted as means ± SEM and the data was analyzed using student's t test or a one-way ANOVA. One-way Analysis of Variance on Ranks was performed when the data was not normally distributed. Tukey's post-hoc and Kruskall-Wallis were used as appropriate. Differences were considered statistically significant at *p<0.05, **p<0.01 and ***p<0.00.1.
Results
3.1 Oxygen consumption rate (OCR) is increased in adipocytes matured in high glucose medium
The respiratory profile of 3T3-L1 adipocytes matured in high glucose (30 mM) conditions has been described previously (Curtis 2012), however, these conditions correspond to a hyperglycemic, hyperinsulinemic environment and are not appropriate ‘control’ conditions for the study of normal adipocyte respiration. The Seahorse XF analyzer was used to contrast the oxygen consumption rate (OCR) of adipocytes after 2 days maturation (M2) in either 5 mM or 30 mM glucose. The glucose/insulin concentrations were 5 mM/0.3 nM and 30 mM/3 nM to reflect normal conditions and a hyperglycemic/hyperinsulinemic state, respectively. A representative trace is shown in Figure 1A, illustrating the basal OCR of adipocytes followed by ATP synthase inhibition (oligomycin, O), mitochondrial membrane depolarization using trifluorocarbonylcyanide phenylhydrazone (FCCP) (F) and complex I/complex III inhibition using rotenone/antimycin A, (R/A) as denoted by the arrows. There was ∼1.7-fold increase in the basal respiration and ∼1.8-fold increase in oxygen consumption coupled to ATP synthesis in adipocytes grown in high glucose (gray bars) vs. normal glucose (black bars) (***p<0.001, Figure 1B). Proton leak and non-mitochondrial respiration (NMR) were also significantly increased in high glucose (Figure 1B). However, the spare respiratory capacity (SRC), a measure of the cellular capacity to increase mitochondrial respiration, was ∼2.4-fold lower in high glucose vs. normal glucose (***p<0.001, Figure 1B).
Figure 1. Bioenergetic profile of 3T3-L1 adipocytes matured in 5 mM and 30 mM glucose.

(A) The respiratory profile of adipocytes matured in 5 mM (black squares) or 30 mM glucose (gray squares) was measured after 2 days maturation using the Seahorse XF Analyzer as described in the Materials and Methods. A blank injection (Blank) was performed prior to addition of compounds at the indicated arrows to assess mitochondrial function. (B) Basal respiration (Basal), oxygen consumption coupled to ATP production (ATP), spare respiratory capacity (SRC), proton leak (H+ leak), and non-mitochondrial respiration (NMR) were measured following the addition of oligomycin (O), FCCP (F), and rotenone/Antimycin A (R/A) respectively. Data are representative of n=4 measurements expressed as means ± S.E, **P<0.01 and ***P<0.001 for 30 mM glucose vs. 5 mM glucose.
3.2 The effects of glucose concentration on the unfolded protein response (UPR), ER stress and adipogenesis
Several studies have described ER stress as a requirement for 3T3-L1 fibroblasts undergoing differentiation into adipocytes in high glucose and high insulin conditions (Basseri 2009, Han 2013a). To determine if high glucose was responsible for the UPR/ER stress response as adipogenesis progressed, we conducted adipocyte maturation in normal or high glucose/insulin and assessed several markers of differentiation and ER stress. The production of adiponectin and PPARγ confirmed that the 3T3-L1 fibroblasts had differentiated and matured into adipocytes in both 5 mM and 30 mM glucose during the 11 day time course (3 days differentiation in 30 mM glucose followed by a subsequent 8 days in 5 mM or 30 mM glucose maturation medium). Notably, adipocytes matured in 30 mM glucose had decreased total intracellular adiponectin levels versus those cultured in 5 mM glucose towards the end of maturation (M7 and M8) (Figure 2 A&B, lanes 16-23). Markers of the UPR and ER stress were up-regulated in adipocytes as they begin maturation in both normal and high glucose. The UPR marker GRP 78 increased throughout maturation in normal and high glucose, with a peak level occurring in 5 mM glucose at M5 (Figure 2D). PDI, Ero1-Lα and p-eIF2α increased most during days M1-5 of maturation and declined thereafter until day M8 (M1-M8, Figure 2A & C, Lanes 4-23), but did not differ significantly with glucose concentration suggesting that activation of the UPR is a normal component of adipogenesis. Concomitant with a decrease in p-eIF2α levels, there was a pronounced increase in CHOP, a terminal marker of ER stress, but only in adipocytes matured in 30 mM glucose (Figure 2A&E). Consistent with previous results (Nagai 2007, Frizzell 2009), protein succination increases in adipocytes matured in 30 mM glucose for up to 8 days (M2-M8, lanes 8-23) and interestingly appears to increase in parallel with CHOP levels (Figure 2A). In addition to the observed decrease in intracellular adiponectin, the adipocytes matured in 30 mM glucose secreted increased levels of pro-inflammatory cytokines including TNFα, VEGF and MCP-1 (Figure 2F-G). Taken together, these results confirm that increased protein succination occurs in parallel with increased ER stress (CHOP), decreased adiponectin production and elevated pro-inflammatory cytokine production when adipocytes are matured in high glucose concentrations.
Figure 2. Activation of the UPR is required for adipogenesis in both normal and high glucose conditions; CHOP levels are sustained only in high glucose.
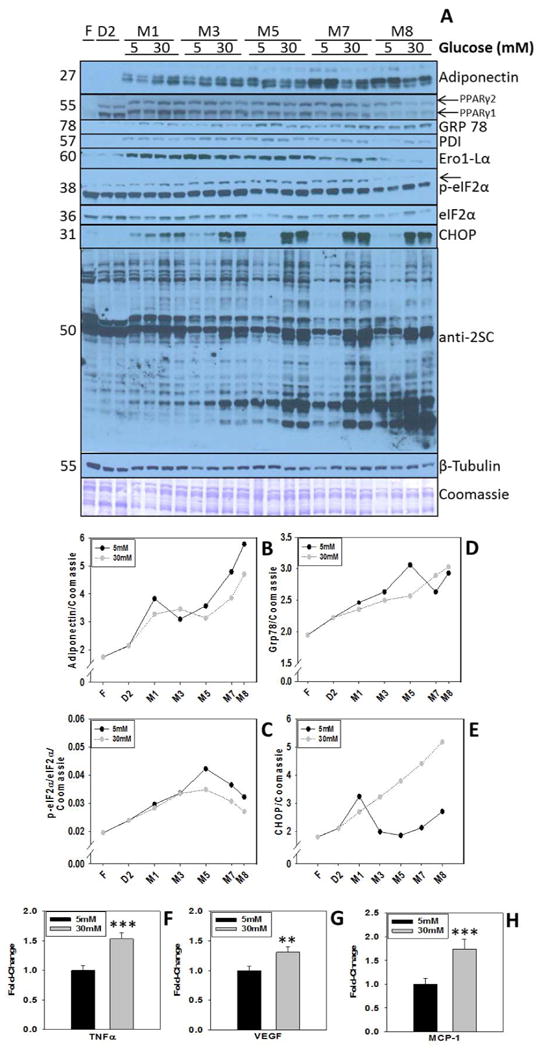
(A) Time course of ER stress and adipogenic proteins in adipocytes cultured normal (5 mM) or high (30 mM) glucose. Total cell lysates (20 μg protein) from adipocytes harvested at the indicated time points were separated by 1-D PAGE. Adipogenic proteins and ER stress markers were detected as described in the Materials and Methods. F indicates fibroblasts, D represent cells undergoing differentiation and M represents the maturation period in either 5 mM or 30 mM glucose. A representative Coomassie staining is shown as a loading control. Duplicate lanes are representative of n=6 experiments. (B-E) Densitometric quantification of protein bands for select UPR/ER stress markers in 5 vs. 30 mM glucose. (F-H) Secreted levels of pro-inflammatory cytokines were measured by a mouse obesity ELISA as described in the Materials and Methods. Data are representative of n=4 measurements. Data is expressed as means ± S.E, **P<0.01 and ***P<0.001 for 30 mM glucose vs. 5 mM glucose.
Recent work has suggested that insulin alone is sufficient to increase ER stress in adipocytes and adipose tissue (Boden 2013). Considering that our 5 mM glucose adipocytes are cultured in 0.3 nM insulin and our 30 mM glucose adipocytes are cultured in 3 nM insulin we investigated if the increase in CHOP we observed was due to either the glucotoxicity or the high insulin concentration. To do this we examined ER stress and protein succination in both glucose concentrations in the presence or absence of added insulin. As observed in Figure 3, the addition of insulin leads to increased protein succination in adipocytes matured in 30 mM glucose (lanes 7-12) and has no effect on the levels of protein succination in adipocytes matured in 5 mM glucose (lanes 1-6). Therefore it appears that combined glucotoxicity and elevated insulin are required to observe an increase in 2SC, a biomarker of mitochondrial stress. Grp78 levels were measured to assess activation of the UPR and demonstrated that insulin leads to the induction of the UPR (Figure 3, lanes 1-3 vs. 4-6 or lanes 7-9 vs. 10-12), independent of glucose concentration. We then measured CHOP levels and observed a pronounced increase in CHOP in 30 mM glucose in the presence of insulin. However, CHOP was unchanged in 5 mM glucose with or without insulin, indicating that the high glucose is required for ER stress in this model. We also performed a parallel experiment in which the cells had the insulin removed in a washout and were then treated with insulin for 7 hours prior to harvest. Consistent with the above observations, there was an increase in CHOP levels in 30 mM glucose that was not present in adipocytes matured in 5 mM glucose in the presence or absence of insulin (data not shown).
Figure 3. Insulin induces the UPR while glucotoxicity increases succination and ER stress.

Adipocytes were matured in either 5 mM or 30 mM glucose in the absence (0) or presence of 10 nM insulin (10). 20 μg of protein was separated by 1-D PAGE and immunoblotting was performed to detect 2SC-modified proteins, Grp78, CHOP and β-tubulin as described in Materials and Methods. Data is representative of n=3 experiments.
3.3 Sodium phenylbutyrate (PBA) reduces protein succination and mitochondrial membrane potential in adipocytes matured in high glucose
Protein succination in the adipocyte is increased due to glucotoxicity driven mitochondrial stress, and we have previously demonstrated that this can be reduced after treatment with chemical uncouplers of oxidative phosphorylation e.g. dinitrophenol and salicylic acid (SA) (Frizzell 2012). We hypothesized that the phenolic compound PBA may be able to cross the mitochondrial membrane carrying a proton, thereby acting as a weaker uncoupler similar to salicylic acid (Norman 2004). Considering that PBA has been shown to lower ER stress in 3T3-L1 adipocytes matured in high glucose (Basseri 2009), we speculated that it may do this indirectly by lowering mitochondrial stress and protein succination. As shown in Figure 4A, adipocytes matured in high glucose have increased levels of 2SC compared to adipocytes matured in normal glucose for 8 days. When adipocytes are treated with 1 mM PBA for 8 days, the levels of protein succination are significantly reduced in adipocytes matured in high glucose and unchanged in normal glucose (Figure 4A). PBA treatment of adipocytes in 30 mM glucose significantly reduced the mitochondrial membrane potential ΔΨm (***p<0.001) compared to untreated adipocytes (Figure 4B). CCCP served as a positive control to lower the ΔΨm (***p<0.001). These results suggested that PBA was acting to lower mitochondrial stress within the adipocyte.
Figure 4. PBA reduces protein succination and the mitochondrial membrane potential.
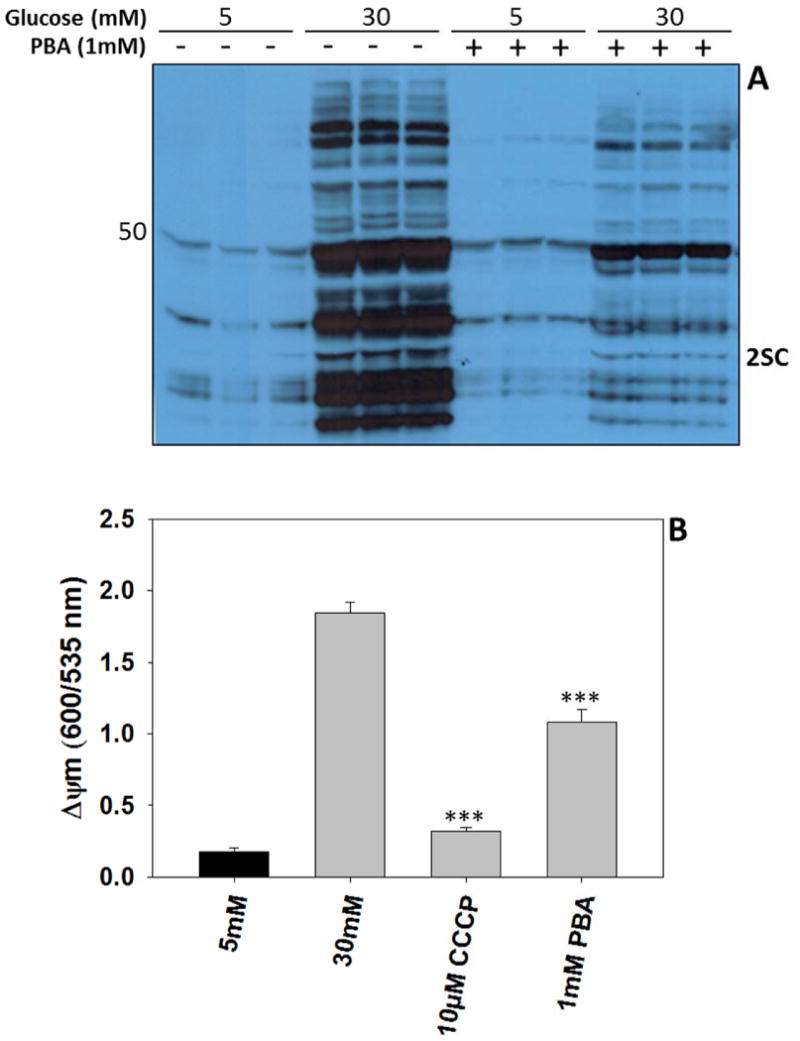
(A) Adipocytes were matured in 5 mM or 30 mM glucose with or without the addition of 1 mM PBA for 8 days. 30 μg of protein was separated by 1-D PAGE and the immunoblot was probed with anti-2SC to detect protein succination. The triplicate lanes are representative of n=6 experiments. (B) The mitochondrial membrane potential (ΔΨm) was measured for adipocytes matured in 5 mM glucose (black bar), 30 mM glucose, 30 mM glucose + 10 μM carbonyl cyanide m-chloro phenyl hydrazone (CCCP) or 30 mM glucose + 1 mM PBA for 2 days (gray bars) using the dye JC-1. The fluorescence was measured at Ex/Em 550/600 nm and Ex/Em 485/535 nm, as described in Materials and Methods. The ΔΨm is expressed as a ratio of the fluorescence at 600/535 nm. Data are representative of n=4 measurements expressed as mean ± S.E, ***P<0.001 for 30 mM glucose vs. 30 mM + CCCP or PBA.
3.4 PBA inhibits adipogenesis and lowers mitochondrial respiration in adipocytes
PBA has been documented to relieve ER stress and also inhibit adipogenesis in vitro (Basseri 2009). To replicate these findings we also measured and observed a significant reduction in PPAR gamma, the master regulator of adipogenesis, after treatment with 1 mM PBA (Figure 5A). In addition, the adipocyte triglyceride content was decreased in a dose dependent manner after 2 and 8 days of PBA treatment versus 30 mM glucose alone (Figures 5 B&C). We then quantified the extracellular glucose concentrations in order to determine if PBA altered glucose uptake into the adipocyte and observed that there was a significant increase in glucose remaining in the medium after 2 days of treatment with 1 mM PBA (Figure 5D).
Figure 5. PBA inhibits adipocyte maturation and glucose uptake.

(A) Adipocytes were matured in 5 mM glucose or 30 mM glucose with or without 1 mM PBA added for 2 days. 30 μg total cell lysate was separated by 1-D PAGE and the immunoblot was probed with anti-PPARγ. Triplicate data is representative of n=3 experiments. (B) Adipocytes cultured in 30 mM glucose were treated with 0.5 - 5 mM PBA on days 0-2 or (C) days 0-8 of maturation and triglyceride content was measured as described in the Materials and Methods. (D) The medium was collected after 2 days from adipocytes matured in 30 mM glucose + 0.5 - 5 mM PBA and the extracellular glucose concentration was measured as described in the Materials and Methods. The results are expressed as mean ± SE, n=4, ***p<0.001 for 30 mM glucose vs. 30 mM glucose + PBA.
The reduction in ΔΨm observed after PBA treatment (Figure 4B) supported our hypothesis that PBA may be acting as a mitochondrial depolarization agent. Using the Seahorse XF 24 analyzer, we compared the ability of PBA to decrease the ΔΨm and subsequently increase the OCR versus the strong uncoupler FCCP (F) or the mild uncoupler salicylic acid (SA) (Frizzell 2012). FCCP uncoupled oxidative phosphorylation at previously titered micromolar concentrations, as demonstrated by the rapid increase in the OCR (Figure 6A, black/solid triangles). We have previously shown that SA reduces both the ΔΨm and the levels of 2SC-modified proteins in adipocytes matured in high glucose (Frizzell 2012). Here, we confirmed that SA is acting as a mild uncoupler as increasing concentrations of SA depolarized the inner mitochondrial membrane leading to successive increases in the OCR (open circles, Figure 6A, arrows denote addition of SA). In contrast, increasing concentrations of PBA (Figure 6A, closed circles, arrows denote addition of PBA) did not appear to increase the OCR above the basal rate (Figure 6 A&B), although a marginal increase was statistically significant upon addition of 10 mM PBA (Figure 6B). However, additional experiments with 10 mM PBA for longer time periods indicated that it reduced cell viability, therefore we used only 1 mM and 5 mM PBA for further experiments. As the affects after acute PBA treatment were minimal we next examined the OCR after treatment with 1 mM or 5 mM PBA for 2 days. Interestingly, the basal OCR was significantly reduced in adipocytes matured in 30 mM glucose treated with both 1 mM and 5 mM PBA (open triangles vs. open circles, closed triangles vs. open circles Figure 6C, striped and checked bars vs. gray bars, basal respiration, Figure 6D, ***p<0.001). Compared to adipocytes matured in high glucose alone, ATP synthesis coupled to oxygen consumption, proton leak and NMR all tended to be reduced with 1 mM and 5 mM PBA treatment (Figure 6D). Proton leak was significantly reduced by 1 mM and 5 mM PBA treatment compared to adipocytes matured in 30 mM glucose. Notably, the 1 mM PBA treated adipocytes had an improved response to uncoupling by FCCP whereas the 5 mM PBA treated adipocytes were unable to respond to membrane depolarization (Figure 6 C & D).
Figure 6. PBA reduces mitochondrial respiration in 30 mM glucose cultured adipocytes.
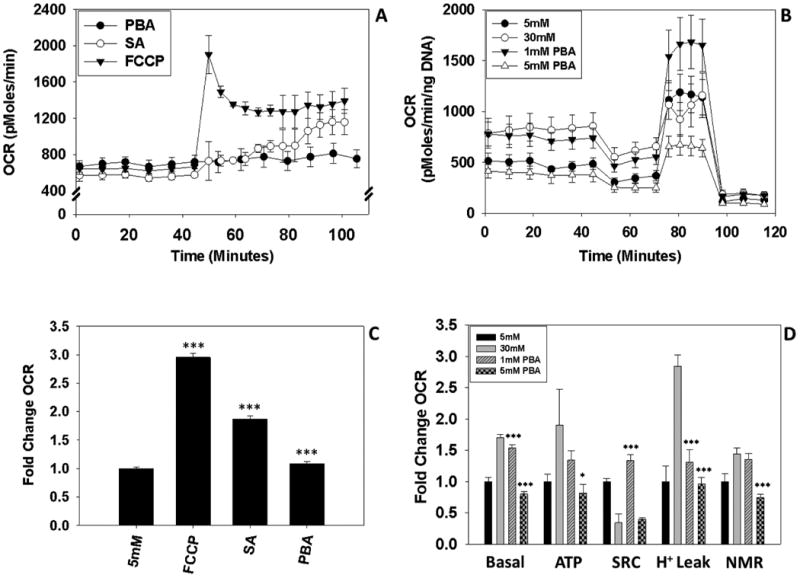
(A) Mitochondrial oxygen consumption was measured after the addition of PBA to determine if it could act as an uncoupler of mitochondrial respiration. FCCP (1.25 μM, black triangle) served as a positive control and was injected once as indicated by the first arrow. PBA was injected on 3 occasions (closed circles) at the concentrations 1 mM, 5 mM and 10 mM as indicated by the arrows. Salicylic acid (SA) was added to another series of wells to compare PBA to the effects of a known mild-uncoupler (open circles). SA was injected into the wells on 3 occasions at concentrations of 1 mM, 2 mM and 5 mM, as indicated by the arrows. (B) Fold-change increase in the basal oxygen consumption rate after the cumulative concentrations of the drugs were added, ***P<0.001 for 5 mM glucose vs. FCCP, SA and PBA. (C) The respiratory profile of adipocytes cultured in 5 mM and 30 mM glucose or, 30 mM glucose with either 1 mM or 5 mM PBA treatment on days 0-2 of maturation was measured as described in the Materials and Methods. Drugs (oligomycin (O), FCCP (F), and rotenone/Antimycin A (R/A)) were added at the indicated arrows to assess mitochondrial function. (D) Fold change for the measurements of basal respiration (Basal), oxygen consumption coupled to ATP production (ATP), spare respiratory capacity (SRC), proton leak (H+ leak), and non-mitochondrial respiration (NMR) obtained in (C). Data are representative of n=4 measurements for all experiments and are expressed as means ± S.E, **P<0.01 and ***P<0.001 for 30 mM glucose vs. 30 mM glucose + PBA.
3.5 PBA reduces mitochondrial protein content
PBA treatment reduced the levels of both adiponectin and PPARγ in the adipocytes, although the effects were much more pronounced with 5 mM PBA, confirming that elevated PBA concentrations do inhibit adipogenesis (Figure 7A). PBA treatment lowered UPR markers as noted by reductions in calreticulin, PDI and p-eIF2α levels, particularly with 5 mM PBA. Unexpectedly, CHOP levels were significantly increased after 2 days maturation in the presence of PBA and cleaved caspase-3, a marker of ER stress-induced apoptosis, was increased with 5 mM PBA treatment (Figure 7A). Although there was no significant reduction in cell viability at 8 days (data not shown) it is clear that elevated PBA concentrations appear to initiate apoptosis after 8 days. Although PBA treatment did not reduce the mitochondrial DNA copy number (Figure 7B) there were reductions in the levels of several mitochondrial proteins including succinate dehydrogenase (SDHA) and NDUFS4, a component of complex I, versus the 30 mM glucose controls (Figure 7A). This suggested that PBA may also be acting to selectively lower the levels of some mitochondrial proteins.
Figure 7. PBA reduces ER stress and inhibits adipogenesis.
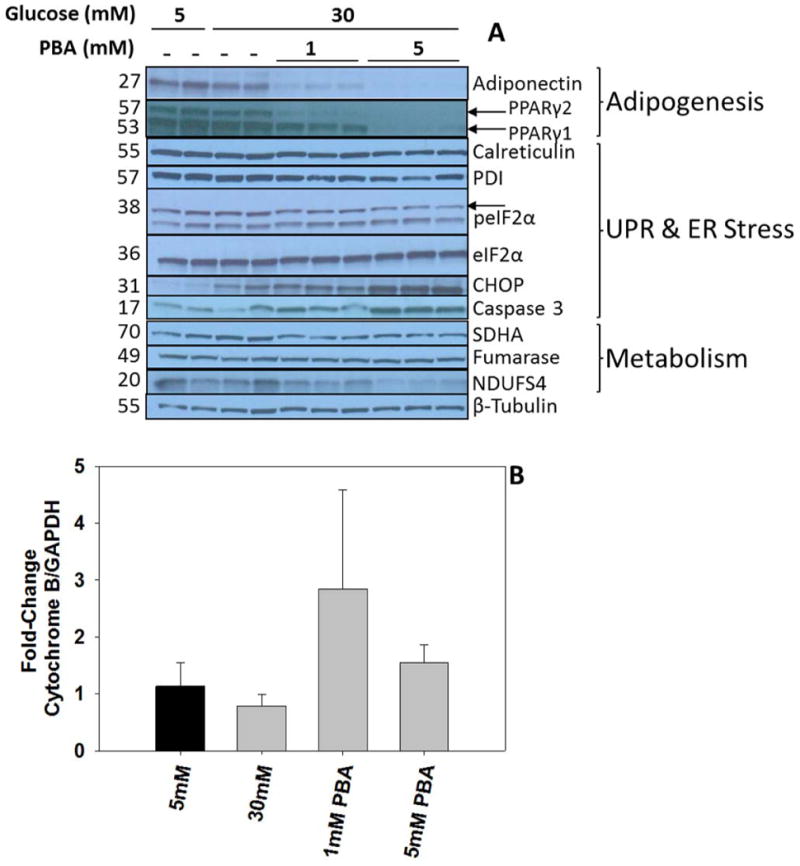
(A) Adipocytes were matured in 5 mM glucose, 30 mM glucose or 30 mM glucose + 1 mM or 5 mM PBA for 2 days. 20 μg protein from cell lysates was separated by 1-D PAGE and immunoblotting was performed to detect markers of adipogenesis, UPR/ER stress and mitochondrial metabolism as described in the Materials and Methods. The data shown are representative of n=6 experiments. (B) Mitochondrial content as determined by the mitochondrial:nuclear DNA ratio. The data are representative of n=5 experiments.
Discussion
The differentiation of 3T3-L1 fibroblasts into adipocytes has been extensively studied (Rosen 2006). The maturation of the adipocytes most commonly occurs in 25 mM (∼450 mg/dL) glucose and insulin concentration ranging from 10-1700 nmol/L (Boden 2014, Curtis 2012), well beyond the physiological range. In this study we compared adipocytes matured in 5 mM glucose/0.3 nM insulin or 30 mM glucose/3 nM insulin to reflect normal conditions and poorly controlled diabetes, respectively. We examined the respiratory profile of adipocytes that had matured in 5 mM or 30 mM glucose for 2 days (after a 3 day differentiation period) and observed that the cells cultured in 30 mM glucose had a ∼1.7-fold increase in the basal respiration rate (Figure 1 A&B). In contrast, the spare respiratory capacity, a measure of the mitochondrial capability to respond to increased ATP demand, was ∼2.4-fold lower in high glucose versus normal glucose cultured adipocytes. These data indicate that cells cultured in high glucose conditions are already respiring close to their maximal capacity and are not optimal for use as ‘healthy’ controls for normal adipocyte function. It has been suggested that 3T3-L1 adipocytes predominantly consume oxygen in non-mitochondrial pathways (Han 2012), however, our OCR measurements allowed us to assess both mitochondrial and non-mitochondrial oxygen consumption as they included a final rotenone/antimycin A inhibition of Complex I/III (effectively inhibiting mitochondrial respiration). Our data demonstrates that non-mitochondrial respiration accounts for ∼22% of the OCR in high glucose (Figure 1A). This indicates that while non-mitochondrial respiration is significant, it is not the major source of oxygen consumption in the 3T3-L1 adipocyte. Oxygen consumption coupled to ATP production was increased in high glucose (Figure 1 B, ATP), confirming our previous observations of an increased ATP/ADP ratio in adipocytes cultured in 30 mM glucose (Frizzell 2012). Ultimately, this high rate of ATP production contributes to partial electron transport chain inhibition via respiratory control in these cells leading to an increase in NADH and fumarate levels (Frizzell 2012). Recently, Valsecchi et al. highlighted the importance of glucose concentration for the study of mitochondrial (dys)function, noting that primary cultures maintained in the presence of high glucose may suppress or mask differences in reactive oxygen species (ROS) measurements. In addition, immortalized cell lines that are frequently used to study mitochondrial function in high glucose have a high glycolytic activity, rather than a dependence on mitochondrial metabolism (Valsecchi 2013).
In addition to the effects of glucose on mitochondrial metabolism in diabetes, insulin concentrations can also have varying effects on intracellular signaling pathways. Boden et al. have described increases in UPR and ER stress markers in human subjects after the infusion of insulin (Boden 2014). We performed this experiment in 3T3-L1 adipocytes and found that insulin induced the UPR in both normal and high glucose, but only high glucose and high insulin combined led to ER stress and an increase in the levels of CHOP (Figure 3). A combination of high glucose and high insulin was also required to detect maximal protein succination. Overall, our results highlight the importance of both glucose and insulin conditions for the study of mitochondrial bioenergetics in the context of diabetes research. The markedly different respiratory profile between adipocytes matured in normal or high glucose/insulin will ultimately impact additional intracellular signaling pathways.
Activation of the Unfolded Protein Response (UPR) and ER stress have been described as requirements for adipogenesis when cells are cultured in high glucose medium (Basseri 2009, Han 2013a). We investigated if this was unique to cells cultured in high glucose or if the UPR was still increased when cells were cultured in normal (5 mM) glucose. As shown in Figure 2 A, both adipocytes cultured in normal or high glucose proceed through differentiation (D) and maturation (M) normally as indicated by the significant increase in PPARγ and adiponectin. Several markers of the UPR including GRP78, PDI and p-eif2α were increased, indicating that UPR activation is a normal component of 3T3-L1 adipogenesis, irrespective of the glucose concentration. Although there were subtle changes in UPR markers between 5 mM and 30 mM glucose at various time points, these changes were not significant (Figure 2 A-E) but CHOP, a terminal marker of ER stress, was significantly increased as maturation progressed and this was sustained only in 30 mM glucose (Figure 2 A, M2-M8). Interestingly, as CHOP levels increased in 30 mM glucose this occurred in parallel with an increase in protein succination, a biomarker of mitochondrial stress (Figure 2 A, anti-2SC). The increase in CHOP and succinated proteins corresponded to a decrease in total adiponectin levels at days M7 - M8 in 30 mM vs. 5 mM glucose (Figure 2 A) and was also associated with an increase in the release of the pro-inflammatory markers TNF-α, MCP-1 and VEGF into the medium (Figure 2F-H). Taken together, this data confirms that UPR activation is a normal aspect of 3T3-L1 adipogenesis and activation; however the sustained increase in CHOP observed in parallel with protein succination indicate that both ER stress and mitochondrial stress occur simultaneously in the high glucose culture conditions. These observations also corresponded with an increased secretion of pro-inflammatory molecules, linking mitochondrial stress with the demise of the healthy adipocyte.
Protein succination is a biomarker of adipocyte dysfunction and increases as a consequence of mitochondrial stress. The increase in fumarate is associated with an increased ATP/ADP ratio, elevated ΔΨm and increased NADH/NAD+ and this can be reduced after treatment with CCCP, a mitochondrial depolarization agent (Frizzell 2012). To further determine if mitochondrial stress and ER stress were linked we treated adipocytes with 1 mM sodium phenylbutyrate (PBA) and observed a significant reduction in succination and also the ΔΨm (Figure 4). We hypothesized that PBA may be acting as a depolarization agent, given that there was a reduction in the ΔΨm upon treatment of adipocytes in 30 mM glucose with PBA (Figure 4 B). In contrast to known uncouplers such as FCCP and salicylic acid (SA), we did not observe an increase in the OCR with 1 mM or 5 mM PBA (Figure 6 A) indicating that PBA is not acting acutely as an uncoupler. Although 10 mM PBA led to a small increase in OCR we later determined that this concentration was toxic to cells and diminished viability in culture. When the adipocytes were instead treated with 1 mM or 5 mM PBA for 2 days, we noted a decrease in the basal OCR and ATP production coupled to oxygen consumption, which is consistent with the decrease in the ΔΨm. After further investigation, we also observed a reduction in the mitochondrial protein content as noted by a decrease in SDHA and NDUFS4, but there was no change in the mitochondrial DNA copy number (Figure 7 A&B). We observed that PBA reduced adipocyte glucose uptake (Figure 5 D), suggesting that overall the OCR is lower due to decreased metabolic flux coupled with selective reductions in mitochondrial protein content (Figure 6D). This is in contrast to in vivo studies using ob/ob mice where PBA was shown to reduce blood glucose levels after 4 days of treatment, indicating that it facilitated glucose uptake in an animal model of obesity (Ozcan 2006). However, PBA had no effect on blood glucose in other models of diabetes such as alloxan-induced diabetic mice or the Goto-Kakizaki rat (Xu 2010).
PBA has been described as a chemical chaperone that can alleviate ER stress (Ozcan 2006) and has been shown to inhibit adipogenesis at high concentrations (Basseri 2009). In line with these results, we see a decrease in PPARγ and adiponectin when adipocytes are treated with PBA (Figures 5 A & 7 A). Consistent with inhibition of adipogenesis, there is a dose dependent reduction in triglyceride levels when adipocytes are treated with PBA during days 0-2 of maturation (Figure 5 B-C). The UPR was also reduced by PBA as noted by the decrease in calreticulin and p-eIF2α (Figure 7A), but surprisingly CHOP levels increased with PBA treatment in a dose-dependent manner. Increased CHOP levels in ER stress are frequently associated with the induction of apoptosis as a terminal response to stress (Oyadomari 2004). We observed an increase in cleaved caspase 3 with 5 mM PBA treatment, suggesting that this concentration actually induces ER stress rather than relieve it after 8 days in culture. While we see increased CHOP in untreated 30 mM glucose adipocytes there is no activation of cleaved caspase 3. Han et al. recently demonstrated that the levels of CHOP are important in determining cell fate as very high levels CHOP levels can lead to large increases in protein synthesis and oxidative stress, ultimately culminating in cell death (Han 2013b). Recent work also suggests that increased CHOP levels may have other metabolism-related roles in the cell. CHOP has recently been shown to be involved in binding to promoter regions involved in suppression of lipogenic genes in the liver (Chikka 2013). Overall, it appears that the levels of CHOP induced in response to stress ultimately determine the cellular response.
In conclusion, we have shown that there are important differences in the mitochondrial bioenergetics of adipocytes matured in normal or high glucose and insulin. In order to study adipocyte dysfunction it is essential to first establish a healthy control system. Both normal and high glucose adipocytes proceed through adipogenesis by activation of the UPR but only in high glucose is this accompanied by increased protein succination and CHOP production. It will be interesting to determine if the increase in succination contributes to the increase in CHOP through the direct accumulation of misfolded, succinated proteins. While PBA relieved mitochondrial stress and reduced protein succination it was associated with reduced mitochondrial protein content and increased levels of CHOP in the adipocyte. Further studies will be necessary to determine the precise mechanism of action of this compound.
Acknowledgments
We thank Professor John Baynes for helpful discussion. We thank Dr. Aditi Narsale and Dr. Melissa Puppa-Lasher for assistance with mitochondrial DNA measurements. This work was supported by a grant from the American Diabetes Association (1-11-JF-13) and a University of South Carolina Research Foundation ASPIRE-1 award.
References
- Alderson NL, Wang Y, Blatnik M, Frizzell N, Walla MD, Lyons TJ, Alt N, Carson JA, Nagai R, Thorpe SR, Baynes JW. S-(2-Succinyl)cysteine: a novel chemical modification of tissue proteins by a Krebs cycle intermediate. Arch Biochem Biophys. 2006;450:1–8. doi: 10.1016/j.abb.2006.03.005. [DOI] [PubMed] [Google Scholar]
- Basseri S, Lhoták Š, Sharma A, Austin RC. The chemical chaperone 4-phenylbutyrate inhibits adipogenesis by modulating the unfolded protein response. J Lipid Research. 2009;50:2486–2501. doi: 10.1194/jlr.M900216-JLR200. [DOI] [PMC free article] [PubMed] [Google Scholar]
- Blatnik M, Frizzell N, Thorpe SR, Baynes JW. Inactivation of glyceraldehyde-3-phosphate dehydrogenase by fumarate in diabetes: formation of S-(2-succinyl)cysteine, a novel chemical modification of protein and possible biomarker of mitochondrial stress. Diabetes. 2008;57:41–49. doi: 10.2337/db07-0838. [DOI] [PMC free article] [PubMed] [Google Scholar]
- Boden G, Duan X, Homko C, Molina EJ, Song W, Perez O, Cheung P, Merali S. Increase in endoplasmic reticulum stress-related proteins and genes in adipose tissue of obese, insulin-resistant individuals. Diabetes. 2008;57:2438–44. doi: 10.2337/db08-0604. [DOI] [PMC free article] [PubMed] [Google Scholar]
- Boden G, Cheung P, Salehi S, Homko C, Loveland-Jones C, Jayarajan S, Stein TP, Williams KJ, Liu ML, Barrero CA, Merali S. Insulin regulates the unfolded protein response in human adipose tissue. Diabetes. 2014;63:912–22. doi: 10.2337/db13-0906. [DOI] [PMC free article] [PubMed] [Google Scholar]
- Chikka M, McCabe D, Tyra H, Rutkowski D. C/EBP homologous protein (CHOP) contributes to suppression of metabolic genes during endoplasmic reticulum stress in the liver. J Biol Chem. 2013;288:4405–4415. doi: 10.1074/jbc.M112.432344. [DOI] [PMC free article] [PubMed] [Google Scholar]
- Curtis J, Hahn W, Stone M, Inda J, Droullard D, Kuzmicic P, Donoghue M, Long E, Armien A, Lavandero S, Arriaga E, Griffin T, Bernlohr D. Protein carbonylation and adipocyte mitochondria function. J Biol Chem. 2012;287:32967–32980. doi: 10.1074/jbc.M112.400663. [DOI] [PMC free article] [PubMed] [Google Scholar]
- Ducluzeau P, Priou M, Weitheimer M, Flammen M, Dulue L, Iacobazi F, Soleti R, Simard G, Durand A, Rieusset J, Andriantsitohaina R, Malthièry Y. Dynamic regulation of mitochondrial network and oxidative functions during 3T3-L1 fat cell differentiation. J Physiol Biochem. 2011;67:285–296. doi: 10.1007/s13105-011-0074-6. [DOI] [PubMed] [Google Scholar]
- Frizzell N, Rajesh M, Jepson MJ, Nagai R, Carson JA, Thorpe SR, Baynes JW. Succination of thiol groups in adipose tissue proteins in diabetes: succination inhibits polymerization and secretion of adiponectin. J Biol Chem. 2009;284:25772–257781. doi: 10.1074/jbc.M109.019257. [DOI] [PMC free article] [PubMed] [Google Scholar]
- Frizzell N, Thomas S, Carson J, Baynes JW. Mitochondrial stress causes increased succination of proteins in adipocytes in response to glucotoxicity. Biochem J. 2012;445:247–254. doi: 10.1042/BJ20112142. [DOI] [PubMed] [Google Scholar]
- Gagnon A, Sorisky A. The effect of glucose concentration on insulin-induced 3T3-L1 adipose cell differentiation. Obes Res. 1998;6:157–63. doi: 10.1002/j.1550-8528.1998.tb00330.x. [DOI] [PubMed] [Google Scholar]
- Gregor MF, Yang L, Fabbrini E, Mohammed BS, Eagon JC, Hotamisligil GS, Klein S. Endoplasmic reticulum stress is reduced in tissues of obese subjects after weight loss. Diabetes. 2009;58:693–700. doi: 10.2337/db08-1220. [DOI] [PMC free article] [PubMed] [Google Scholar]
- Han C, Subramanian S, Chan C, Omer M, k Chiba T, Wight T, Chat A. Adipocyte-derived serum amyloid A3 and hyluronan play a role in monocyte recruitment and adhesion. Diabetes. 2007;56:2260–2273. doi: 10.2337/db07-0218. [DOI] [PubMed] [Google Scholar]
- Han C, Umemoto T, Omer M, Hartigh L, Chiba T, LeBoeuf R, Buller C, Sweet I, Pennathur S, Abel E, Chait A. NADPH oxidase-derived reactive oxygen species increases expression of monocyte chemotactic factor genes in cultured adipocytes. J Biol Chem. 2012;287:10379–10393. doi: 10.1074/jbc.M111.304998. [DOI] [PMC free article] [PubMed] [Google Scholar]
- Han J, Murthy R, Wood B, Song B, Wang S, Sun B, Malhi H, Kaufman RJ. ER stress signaling through eIF2α and CHOP, but not IRE1α, attenuates adipogenesis in mice. Diabetologia. 2013;56:911–924. doi: 10.1007/s00125-012-2809-5. [DOI] [PMC free article] [PubMed] [Google Scholar]
- Han J, Back S, Hur J, Lin Y, Gildersleeve R, Shan J, Yuan C, Krokowski D, Wang S, Hatzoglou M, Kilberg M, Sartor M, Kaufman R. ER-stress induced transcriptional regulation increases protein synthesis leading to cell death. Nat Cell Biol. 2013;15:481–490. doi: 10.1038/ncb2738. [DOI] [PMC free article] [PubMed] [Google Scholar]
- Han MS, Chung KW, Cheon HG, Rhee SD, Yoon CH, Lee MK, Kim KW, Lee MS. Imatinib mesylate reduces endoplasmic reticulum stress and induces remission of diabetes in db/db mice. Diabetes. 2009;58:329–36. doi: 10.2337/db08-0080. [DOI] [PMC free article] [PubMed] [Google Scholar]
- Lefterova MI, Mullican SE, Tomaru T, Qatanani M, Schupp M, Lazar MA. Endoplasmic reticulum stress regulates adipocyte resistin expression. Diabetes. 2009;58:1879–86. doi: 10.2337/db08-1706. [DOI] [PMC free article] [PubMed] [Google Scholar]
- Lin Y, Berg AH, Iyengar P, Lam TK, Giacca A, Combs TP, Rajala MW, Du X, Rollman B, Li W, Hawkins M, Barzilai N, Rhodes CJ, Fantus IG, Brownlee M, Scherer PE. The hyperglycemia-induced inflammatory response in adipocytes. J Biol Chem. 2005;280:4617–4626. doi: 10.1074/jbc.M411863200. [DOI] [PubMed] [Google Scholar]
- Lowry OH, Rosenbrough NJ, Farr AL, Randall RJ. Protein measurement with the Folin phenol reagent. J Biol Chem. 1951;193:265–275. [PubMed] [Google Scholar]
- Merkley ED, Metz TO, Smith RD, Baynes JW, Frizzell N. The succinated proteome. Mass Spectrom Rev. 2014;33:98–109. doi: 10.1002/mas.21382. [DOI] [PMC free article] [PubMed] [Google Scholar]
- Nagai R, Brock JW, Blatnik M, Baatz JE, Bethard J, Walla MD, Thorpe SR, Baynes JW, Frizzell N. Succination of protein thiols during adipocyte maturation: a biomarker of mitochondrial stress. J Biol Chem. 2011;11:85–97. doi: 10.1074/jbc.M703551200. [DOI] [PubMed] [Google Scholar]
- Norman C, Howell KA, Millar AH, Whelan JM, Day DA. Salicylic acid is an uncoupler and inhibitor of mitochondrial electron transport. Plant Physiol. 2004;134:492–501. doi: 10.1104/pp.103.031039. [DOI] [PMC free article] [PubMed] [Google Scholar]
- Orr JS, Kennedy A, Anderson-Baucum EK, Webb CD, Fordahl SC, Erikson KM, Zhang Y, Etzerodt A, Moestrup SK, Hasty AH. Obesity alters adipose tissue macrophage iron content and tissue iron distribution. Diabetes. 2014;63:421–32. doi: 10.2337/db13-0213. [DOI] [PMC free article] [PubMed] [Google Scholar]
- Oyadomari S, Mori M. Roles of CHOP/GADD153 in endoplasmic reticulum stress. Cell Death Differ. 2004;11:381–389. doi: 10.1038/sj.cdd.4401373. [DOI] [PubMed] [Google Scholar]
- Özcan U, Yilmaz E, Özcan L, Furuhashi M, Vaillancourt E, Smith R, Görgün C, Hotamisligil G. Chemical chaperones reduce ER stress and restore glucose homoeostasis in a mouse model of type 2 diabetes. Science. 2006;313:1137–1140. doi: 10.1126/science.1128294. [DOI] [PMC free article] [PubMed] [Google Scholar]
- Piroli GG, Manuel AM, Walla MD, Jepson MJ, Brock JW, Rajesh MP, Tanis RM, Cotham WE, Frizzell N. Identification of Protein Succination as a Novel Modification of Tubulin. Biochem J. 2014 Jun 9; doi: 10.1042/BJ20131581. Epub ahead of print. [DOI] [PMC free article] [PubMed] [Google Scholar]
- Rosen D, Spiegelman B. What we talk about when we talk about fat. Cell. 2014;156:20–44. doi: 10.1016/j.cell.2013.12.012. [DOI] [PMC free article] [PubMed] [Google Scholar]
- Rosen E, MacDougald O. Adipocyte differentiation from inside out. Mol Cell Biol. 2006;7:885–896. doi: 10.1038/nrm2066. [DOI] [PubMed] [Google Scholar]
- Thomas S, Storey K, Baynes J, Frizzell N. Tissue distribution of S-(2-Succino)cysteine (2SC), a biomarker of mitochondrial stress in obesity and diabetes. Obesity. 2012;20:263–269. doi: 10.1038/oby.2011.340. [DOI] [PubMed] [Google Scholar]
- Valsecchi F, Grefte S, Roestenberg P, Joosten-Wagenaars J, Smeitink J, Willems P, Koopman W. Primary fibroblasts of NDUFS4-/- mice display increase ROS levels and aberrant mitochondrial morphology. Mitochondrion. 2013;13:436–443. doi: 10.1016/j.mito.2012.12.001. [DOI] [PubMed] [Google Scholar]
- Xu T, Chen R, Wang P, Zhang R, Ke S, Miao C. 4-Phenylbutyric acid does not generally reduce glucose levels in rodent models of diabetes. Clin Exp Pharmacol Physiol. 2010;37:441–446. doi: 10.1111/j.1440-1681.2009.05328.x. [DOI] [PubMed] [Google Scholar]