Abstract
The nerve terminals found in the body wall of Drosophila melanogaster larvae are readily accessible to experimental manipulation. We used the light-activated ion channel, channelrhodopsin-2, which is expressed by genetic manipulation in Type II varicosities to study octopamine release in Drosophila. We report the development of a method to measure neurotransmitter release from exocytosis events at individual varicosities in the Drosophila larval system by amperometry. A microelectrode was placed in a region of the muscle containing a varicosity and held at a potential sufficient to oxidize octopamine and the terminal stimulated by blue light. Optical stimulation of Type II boutons evokes exocytosis of octopamine, which is detected through oxidization at the electrode surface. We observe 22700±4200 molecules of octopamine released per vesicle. This system provides a genetically accessible platform to study the regulation of amine release at an intact synapse.
Keywords: Drosophila larvae, octopamine, amperometry, varicosity, channelrhodopsin
Channelrhodopsin-2 (ChR2) is a light-switched cation selective ion channel, which is found in Chlamydomonas reinhardtii. ChR2 can be inserted into specific neurons using standard genetic manipulations.[1] ChR2 opens rapidly after absorption of a blue light photon and generates a large permeability for monovalent and divalent cations. This process can be used as a tool for optogenetic stimulation of neurons. [2]
Drosophila melanogaster, the fruit fly, has been widely used as a model organism to study complex biological processes and the nervous system using molecular and genetic approaches. It has a simple nervous system, exhibits many of the same higher-order brain functions as the mammalian brain and can be a useful model to study human neurodegenerative diseases such as Amyotrophic lateral sclerosis, Parkinson’s disease, and Alzheimer’s disease.[3]
The body wall of Drosophila larvae has relatively few muscles, identifiable and arranged in a regular pattern which makes it an attractive model system to study synaptic vesicle trafficking, neuroplasticity, and development in nerve terminals.[4] The neuromuscular junction (NMJ) in Drosophila larvae has been recently used to investigate the behavioral relevance of monoamine neurotransmitter release from synaptic vesicles (SVs) versus large dense-core vesicles (LDCVs) [5] and to study the role of octopamine in synaptic and behavioral plasticity.[6]
The biogenic amine octopamine has been extensively studied in invertebrates, and serves as a functional analogue of norepinephrine in the vertebrate. Octopamine has been proposed as a neurotransmitter, neuromodulator, and neurohormone in various arthropod physiological systems.[7] Importantly, unlike most other aminergic synapses in the fly, octopaminergic boutons at the neuromuscular junction represent a peripheral site outside of the central nervous system. The peripheral location of these release sites could potentially allow greater accessibility to electrochemical probes including the carbon fiber electrodes used for amperometry. This possibility has not been tested. More generally, although the action of octopamine on synaptic potentials at the arthropod neuromuscular junction (NMJ)[7a] has been extensively studied, a method to quantify octopamine release from the vesicles in the neuromuscular junction responsible for insect behaviors has not been available.
In this study, we introduce a novel method to measure octopamine release from the small varicosities of an aminergic neuron in Drosophila larvae. We have taken advantage of the peripheral localization of the neuromuscular junction to facilitate probe access, and the relatively superficial position of octopaminergic boutons within the larval body wall to enhance signal detection.
Electrochemical methods provide a new tool for studying electroactive neurotransmitters in Drosophila. Figure 1 shows several stages of the procedure used to make electrochemical measurements at single varicosities. The varicosities, also known as boutons, innervate the body wall and comprise the neuromuscular junction (Figure 1A). To measure octopamine release at the fly neuromuscular junction, we took advantage of a Drosophila larval fillet preparation previously used for both electrophysiological and live imaging studies (Figure 1B). The fillet preparation exposes the inside surface of the larval body wall, composed of ~30 bilaterally symmetric muscles that are stereotypically repeated in each hemisegment.[4c] Type I varicosities are glutamatergic and found on most of the muscles of mature larval (and adult) muscles. They are responsible for fast synaptic transmission and muscle contraction. Type I have been subdivided into Type Ib (big, about 3-6 μm) and Type Is (small, 2-4 μm). Processes containing Type 1s varicosities are somewhat longer than those with Type Ib. Type II varicosities synthesize and store octopamine and are found on a subset of larval muscles including muscles 12 and 13, used for this study. They are smaller than most Type I boutons (1-3 μm), appear as "beads on a string," and can extend nearly the entire length of the muscle surface.
Figure 1.
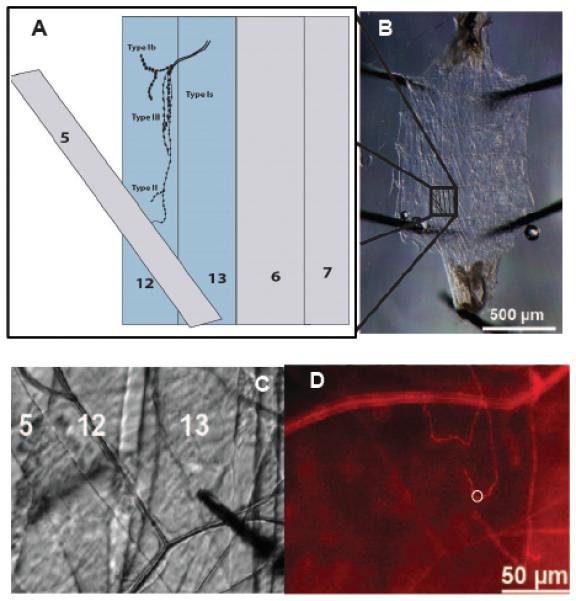
The larval system showing the muscle fibers and nerve terminals. A) Schematic of a muscle structure in one of the body wall’s hemisegments. B) a filet of the muscle wall of the 3rd instar Drosophila larvae. C) Microelectrode placement on the Type II varicosities in muscle 13. D) Same view as 1C but with fluorescence, m-cherry labeled octopaminergic terminals (Type II varicosities) presented as a red line and the white ring shows the placement of the microelectrode.
Type II varicosities occupy a superficial space immediately below the muscle surface. By contrast, the position of Type I terminals is slightly deeper within the muscle. A third subtype, Type III varicosities, are filled primarily with dense core vesicles and express peptide neurotransmitters.[4a, 4c, 4d, 8]
Expression in Type II terminals was visualized using the red fluorescent marker mCherry. The mCherry marker is expressed as a fusion protein in tandem with the light sensitive ion channel protein ChR2. Figure 1C shows a representative fluorescence image of muscle 13 with mCherry labeled octopaminergic terminals: the white ring outlines the (former) position of a carbon fiber electrode (removed to allow visualization of the bouton). Visualization of individual terminals allowed the precise placement of the carbon fiber electrode immediately adjacent to presumptive release sites (Figure 1D).
Constant potential amperometry performed at carbon fiber microelectrodes was used to monitor octopamine release from target cells by blue-light stimulation. Figure 2A shows a trace where a potential of 900 mV potential (vs. Ag/AgCl reference electrode) was applied to the working electrode, the optimum oxidation potential for octopamine[7b], with the electrode in place over a varicosity, while the blue-light for stimulation was off: no signal was detected. Subsequently, the power to the light was switched on with the potential at 0 V, which is not sufficient to oxidize octopamine. Again only background noise was observed (Figure 2B). When the potential was increased again and we stimulated with blue-light, a large number of current spikes were detected by amperometry as shown in Figure 2C. Comparison to controls (2A, B) indicates that the spikes we detected result from octopamine that was released and oxidized at the electrode surface rather than an artifact of the potential or the blue light.
Figure 2.
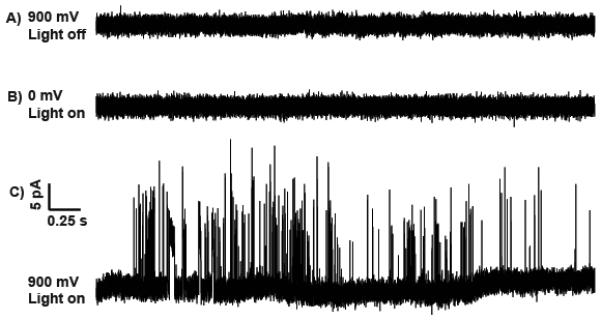
Amperometric traces from a microelectrode placed on a varicosity. A) A potential of 900 mV (vs Ag/AgCl reference electrode) was applied, no light stimulation. B) A potential of 0 mV was applied, with blue light stimulation. C) A 900 mV potential, stimulated with blue light. Same scale for all traces.
In addition to recording well-defined quantal amperometric spikes from octopaminergic terminals we observed the presence of several different kinds of events. Three categories of spikes are made evident by zooming in on the traces (Figure 3, main). The first category of events, which contain 10.4% of all peaks, displays two or three overlapping spikes (Figure 3A). The second category, the most common type of peak (44.6%), displays single events consisting of a single rise and a single falling phase (Figure 3C). The third category represents complex events[9] (Figure 3 B, D, E). Complex events contain what appear to be multiple flickering events. They show a significantly longer duration of release and a greater number of molecules (calculated by integrating the current under the traces) released than simple events.
Figure 3.
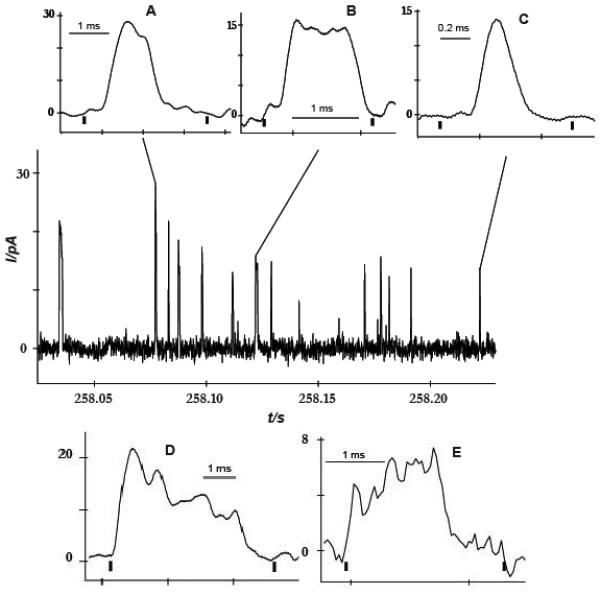
Amperometry of octopamine release at Drosophila larvae varicosities. Main panel: an amperometric trace from blue light stimulated exocytosis. Different event types during exocytosis are shown: A) two overlapped peaks, B) plateau complex event, C) single event, D) complex event with decreasing current during the event, and E) complex event with increasing current during the event. Note both traces in D and E show what appears to be varied flickering of release, which could be very interesting.
Interestingly, different shapes of complex events are detected, possibly representing different modes of vesicle fusion. During exocytosis, a vesicle docks to the cell membrane and the content inside of it is released through a nanometric fusion pore by means of diffusion. We speculate that the opening and closing of the pore might be responsible for the different spike characteristics. We propose that the shape of the plateau for the complex spike in Figure 3B which contain 11.3% of all peaks is the result of release from a pore that is open continuously with the same size, perhaps constricting and expanding slightly over time. If the pore opening decreases over time during continuous flickering (28.2% of all peaks) then the current should also decrease during such an event (Figure 3D). In the third complex event type, which is the least common event type in our results, only 8.4% of all peaks, the pore might open to increasing diameters over time during continuous flickering. Here, the current is expected to actually increase during the event as we observe (Figure 3E). It is important to note that the overlapping peaks and complex peaks might also result from detection of release from multiple sites if the electrode covers more than one varicosity. However, based on the size of the electrode and the distance between varicosities (see methods above) we believe this is a relatively unlikely possibility.
Since Type II varicosities contain roughly equal numbers of SVs and LDCVs it was surprising that we only detected one form of single release event. It is not yet clear whether the observed events represent SVs or LDCVs. It is possible that we were unable to reliably distinguish small events from background in these initial studies, and that release from smaller vesicles (SVs) has therefore not yet been detected.
Oxidation of octopamine results in a precisely quantified current increase at the electrode (Figure 2) and the oxidation potential of a single molecule of octopamine is known. Therefore, the area under each current spike can be correlated to the predicted number of transmitter molecules released from each vesicle. To determine the number of molecules released per vesicle, we examined only single spikes (Figure 3C) rather than complex events as at this stage these latter events are too complicated to quantify and compare. In this measurement, Faraday’s law (Q=nNF) was used to quantify the mole amount of released octopamine per vesicle (N), where the Q is the charge under the current transient on the amperometry trace, n is the number of electrons exchanged in the oxidation reaction (in the case of octopamine n is equal to 1), and F is Faraday’s constant (96485 C/mol).
Mean data for these measurements are shown in Table S1 (see supporting information). The single non-complex exocytosis events are fast, with half width of 1.5±0.2 ms, and the mean number of molecules released per vesicle is 22700±4200. In addition, it is possible to estimate the sizes of vesicles representing each event using the predicted number of molecules and previous estimates of neurotransmitter concentration in the vesicle lumen. If we assume the concentration of octopamine inside the vesicle is 150 mM[10] and full release, then the average diameter would be 90±5 nm, which is close to what has been reported by both the Budnik and Atwood labs.[4c, 4d] However, importantly the data in Figure 3 suggests partial release is prevalent.
A histogram of the mole amounts of octopamine released from a number of individual current transients is shown in Figure 4. The cube root of N is used to achieve a more Gaussian shape and this appears to indicate a near Gaussian distribution of vesicle radii.[11]
Figure 4.
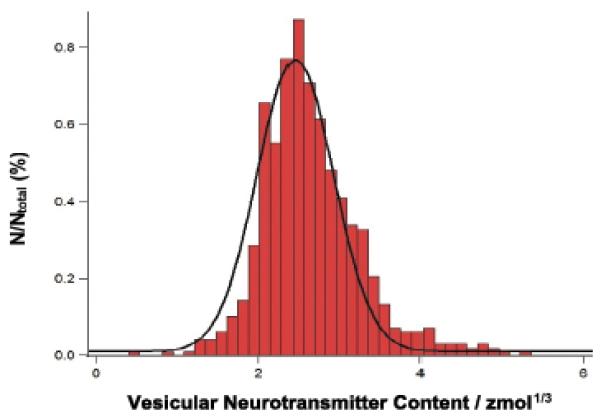
Histogram of octopamine amount from exocytosis from Type II varicosities in Drosophila larvae. Cube root transform used. Bin size =0.01 zmol1/3. Line: Gaussian curve fit of the data.
To strengthen the proposed link between the observed amperomeric events and octopamine release, we pharmacologically manipulated octopamine synthesis via bath application of its immediate enzymatic precursor, tyramine.[12]
The larval fillet was incubated for 10 min in HL3.1 supplemented with 100 mM tyramine, followed by light-induced stimulation of Type II boutons and amperometric recording. We then calculated the average number of octopamine molecules representing each event using Faraday's law. The calculated number of octopamine molecules released observed after tyramine incubation was significantly higher than before the tyramine incubation (p=0.005, n=6 fillet) (Figure 5A).
Figure 5.
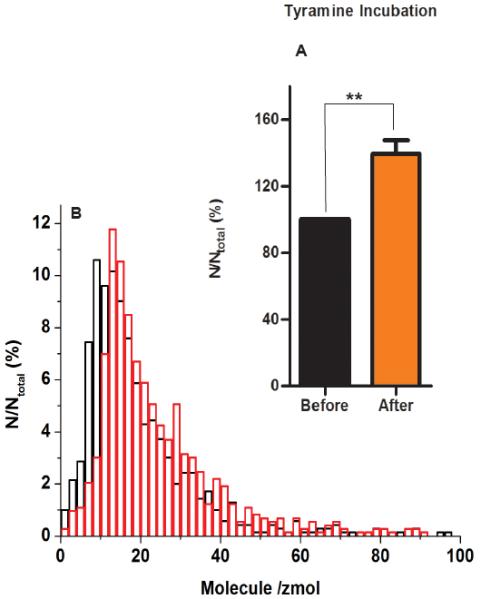
A) Average moles of octopamine quantified per vesicle for exocytosis from Drosophila varicosities before and after pharmacological manipulation. Error bar: SEM. Octopamine molecules released increases after 10 min of tyramine (p=0.005, n=6). B) Distribution of octopamine amount per release event from tyramine-treated (red line) and untreated (black line) Drosophila varicosities. Bin size=0.01 zmol.
We also show a normalized frequency histogram for the calculated amount of octopamine released per vesicle before and after tyramine incubation (Figure 5B).
In summary, we have developed a method based on amperometry to measure octopamine release from nanometric vesicles at Type II varicosities in Drosophila larvae muscle. Optical stimulation at channelrhodopsin transfected cells can be used to evoke exocytosis release from these Type II varicosities. The procedure is reliable and sufficiently sensitive to detect and quantify octopamine in in vivo larvae muscle samples. Furthermore, the method provides us with the ability to quantify the amount of transmitter released from single vesicles and to estimate the size of the vesicles, as well as to monitor changes after pharmacological manipulation. Additionally, we observe different types of release according to the different shape of the spikes, and this we speculate is related to the mechanism of opening of the vesicle to make the nanometer fusion pore.
Supplementary Material
Footnotes
Funding for this project was provided by European Research Council (Advanced Grant), the Swedish Vetenskapsrådet, the Knut and Alice Wallenberg Foundation, and the USA National Institutes of Health.
Supporting information for this article is given via a link at the end of the document.
Contributor Information
Soodabeh Majdi, Department of Chemistry and Chemical Engineering Chalmers University of Technology Department, Kemivägen 10, 41296 Gothenburg, Sweden.
E. Carina Berglund, Department of Chemistry and Molecular Biology University of Gothenburg, Kemivägen 10, 41296 Gothenburg, Sweden.
Johan Dunevall, Department of Chemistry and Chemical Engineering Chalmers University of Technology Department, Kemivägen 10, 41296 Gothenburg, Sweden.
Alexander I. Oleinick, Ecole Normale Supérieure-PSL Research University, Département de Chimie, Sorbonne Universités - UPMC Univ Paris 06, CNRS UMR 8640 PASTEUR, 24, rue Lhomond, 75005 Paris, France
Christian Amatore, Ecole Normale Supérieure-PSL Research University, Département de Chimie, Sorbonne Universités - UPMC Univ Paris 06, CNRS UMR 8640 PASTEUR, 24, rue Lhomond, 75005 Paris, France.
David Krantz, Department of Psychiatry and Biobehavioral Sciences, Gonda Center for Neuroscience and Genetics Research, David Geffen School of Medicine at University of California, Los Angeles, California, USA.
Andrew G. Ewing, Department of Chemistry and Chemical Engineering Chalmers University of Technology Department, Kemivägen 10, 41296 Gothenburg, Sweden, Department of Chemistry and Molecular Biology University of Gothenburg, Kemivägen 10, 41296 Gothenburg, Sweden.
REFERENCES
- [1].Nagel G, Szellas T, Huhn W, Kateriya S, Adeishvili N, Berthold P, Ollig D, Hegemann P, Bamberg E. Proceedings of the National Academy of Sciences. 2003;100:13940–13945. doi: 10.1073/pnas.1936192100. [DOI] [PMC free article] [PubMed] [Google Scholar]
- [2].Boyden ES, Zhang F, Bamberg E, Nagel G, Deisseroth K. Nature neuroscience. 2005;8:1263–1268. doi: 10.1038/nn1525. [DOI] [PubMed] [Google Scholar]
- [3].a Finelli A, Kelkar A, Song H-J, Yang H, Konsolaki M. Molecular and Cellular Neuroscience. 2004;26:365–375. doi: 10.1016/j.mcn.2004.03.001. [DOI] [PubMed] [Google Scholar]; b Feany MB, Bender WW. Nature. 2000;404:394–398. doi: 10.1038/35006074. [DOI] [PubMed] [Google Scholar]; c Watson MR, Lagow RD, Xu K, Zhang B, Bonini NM. Journal of Biological Chemistry. 2008;283:24972–24981. doi: 10.1074/jbc.M804817200. [DOI] [PMC free article] [PubMed] [Google Scholar]
- [4].a Johansen J, Halpern ME, Johansen KM, Keshishian H. The Journal of Neuroscience. 1989;9:710–725. doi: 10.1523/JNEUROSCI.09-02-00710.1989. [DOI] [PMC free article] [PubMed] [Google Scholar]; b Jiao W, Shupliakov A, Shupliakov O. Journal of neuroscience methods. 2010;185:273–279. doi: 10.1016/j.jneumeth.2009.10.010. [DOI] [PubMed] [Google Scholar]; c Atwood H, Govind C, Wu CF. Journal of neurobiology. 1993;24:1008–1024. doi: 10.1002/neu.480240803. [DOI] [PubMed] [Google Scholar]; d Jia XX, Gorczyca M, Budnik V. Journal of neurobiology. 1993;24:1025–1044. doi: 10.1002/neu.480240804. [DOI] [PMC free article] [PubMed] [Google Scholar]
- [5].Grygoruk A, Chen A, Martin CA, Lawal HO, Fei H, Gutierrez G, Biedermann T, Najibi R, Hadi R, Chouhan AK. The Journal of Neuroscience. 2014;34:6924–6937. doi: 10.1523/JNEUROSCI.0694-14.2014. [DOI] [PMC free article] [PubMed] [Google Scholar]
- [6].a Koon AC, Ashley J, Barria R, DasGupta S, Brain R, Waddell S, Alkema MJ, Budnik V. Nature neuroscience. 2011;14:190–199. doi: 10.1038/nn.2716. [DOI] [PMC free article] [PubMed] [Google Scholar]; b Koon AC, Budnik V. The Journal of Neuroscience. 2012;32:6312–6322. doi: 10.1523/JNEUROSCI.6517-11.2012. [DOI] [PMC free article] [PubMed] [Google Scholar]
- [7].a Ormerod KG, Hadden JK, Deady LD, Mercier AJ, Krans JL. Journal of neurophysiology. 2013;110:1984–1996. doi: 10.1152/jn.00431.2013. [DOI] [PubMed] [Google Scholar]; b Cooper SE, Venton BJ. Analytical and bioanalytical chemistry. 2009;394:329–336. doi: 10.1007/s00216-009-2616-0. [DOI] [PubMed] [Google Scholar]
- [8].a Bradley RJ, Harris RA, Jenner P, Budnik V, Gramates LS. Neuromuscular Junctions in Drosophila: Neuromuscular Junctions in Drosophila. Vol. 43. Academic Press; 1999. [Google Scholar]; b Monastirioti M, Gorczyca M, Rapus J, Eckert M, White K, Budnik V. Journal of Comparative Neurology. 1995;356:275–287. doi: 10.1002/cne.903560210. [DOI] [PMC free article] [PubMed] [Google Scholar]; c Hoang B, Chiba A. Developmental biology. 2001;229:55–70. doi: 10.1006/dbio.2000.9983. [DOI] [PubMed] [Google Scholar]; d Botella JA, Bayersdorfer F, Schneuwly S. Neurobiology of Disease. 2008;30:65–73. doi: 10.1016/j.nbd.2007.11.013. [DOI] [PubMed] [Google Scholar]
- [9].Sulzer D, Pothos EN. Reviews in the Neurosciences. 2000;11:159–212. doi: 10.1515/revneuro.2000.11.2-3.159. [DOI] [PubMed] [Google Scholar]
- [10].Fei H, Krantz D. Handbook of Neurochemistry and Molecular Neurobiology. Springer; 2009. pp. 87–137. [Google Scholar]
- [11].Finnegan JM, Pihel K, Cahill PS, Huang L, Zerby SE, Ewing AG, Kennedy RT, Wightman RM. Journal of neurochemistry. 1996;66:1914–1923. doi: 10.1046/j.1471-4159.1996.66051914.x. [DOI] [PubMed] [Google Scholar]
- [12].Roeder T. Progress in Neurobiology. 1999;59:533–561. doi: 10.1016/s0301-0082(99)00016-7. [DOI] [PubMed] [Google Scholar]
Associated Data
This section collects any data citations, data availability statements, or supplementary materials included in this article.


