
Figure 7. The length of the linker between R-motifs in the rpL5 peptide influences the molecular organization within rpL5:N130 liquid-like droplets.
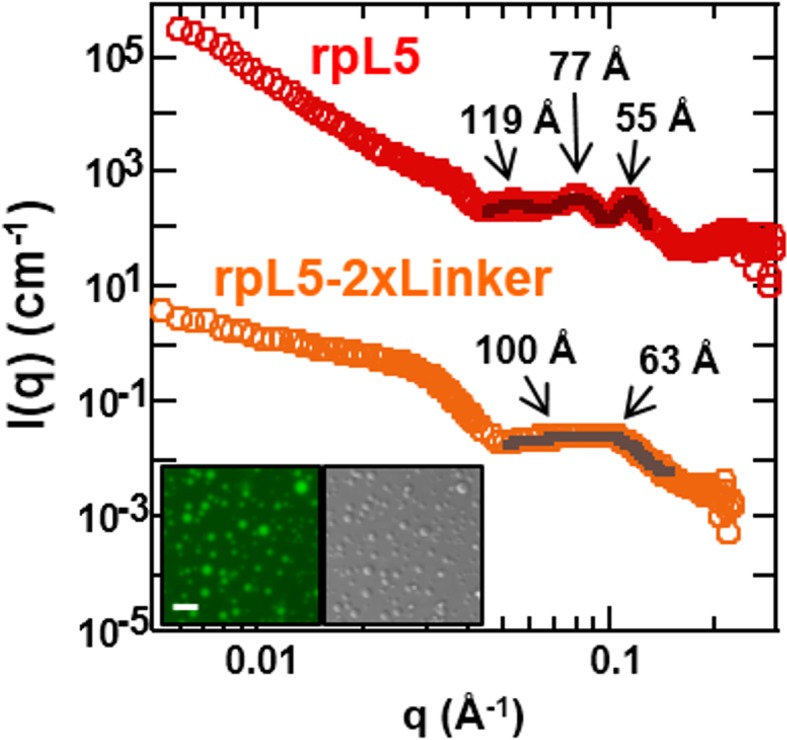
(a) SANS curves, I(q) versus q, for 3:1 rpL5:N130 (red) and rpL5-2xLinker:N130 (orange) solutions; the N130 concentration for both was 200 μM. The curve for the droplets containing rpL5 2xLinker is displayed on absolute I(q) scale (cm-1) with the curve corresponding to rpL5 containing droplets shifted in 4 decade increments for clarity. Fits (solid lines) of the curves to obtain correlation distances are shown (See Analysis methods for details on curve fitting). Peak positions for the droplets with the rpL5-2xLinker correspond to correlation distances (d) of 63 Å & 100 Å whereas those observed with the wild-type rpL5 peptide correspond to d values of 56 Å, 79 Å & 119 Å. Inset: wide-field fluorescence microscopy (left) and DIC (right) images of droplets formed from the 3:1 rpL5-2xLinker:N130 solution. Scale bar = 10 μm.