. 2016 Feb 15;5:e12959. doi: 10.7554/eLife.12959

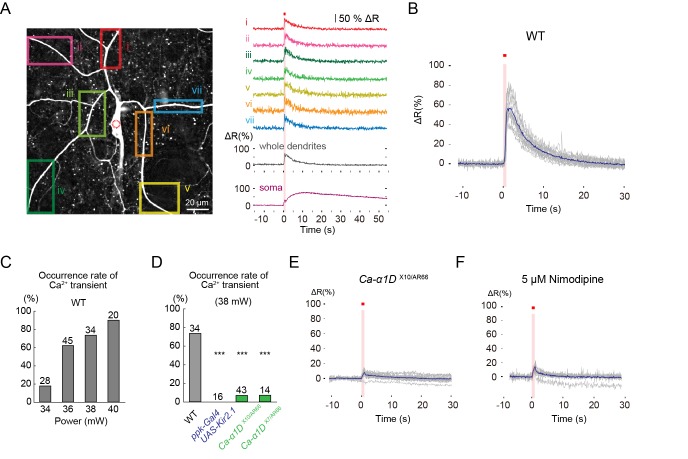
Figure 2. L-type VGCC-dependent global Ca2+ transients occur in Class IV neurons upon noxious thermal stimulation.

Ca2+ responses of Class IV neuron ddaC expressing TN-XXL in whole-mount larvae, except for F (fillet preparations), upon IR irradiation. Throughout this figure, somata were targeted (red dotted circle in A). The output power of the laser was 38 mW except for C. Red squares above traces and magenta shadings in A, B, E, and F indicate the 1 s irradiations. (A) (Left) Time-projected image that is constructed by multiplying CFP and YFP images at every time point. Rectangles i–vii indicate the regions of interest (ROIs). (Right) Global Ca2+ transients were detected in individual ROIs (i–vii). The transient was also detected when we drew a ROI around the entire dendritic arbor excluding the soma (whole dendrite). Ca2+ transient measured in somata displayed slower fluctuation compared to the dendritic ones (soma). (B) Time courses of Ca2+ transients in whole dendrites. Gray lines indicate dendritic Ca2+ transients of 14 cells, and the blue line represents the averaged amplitude. The data from cells that did not generate Ca2+ transients were excluded. (C) Occurrence rate of dendritic Ca2+ transients when stimulated with different IR-laser output powers. We performed one trial per cell and the number of cells examined is displayed at the top of each bar. (D) Occurrence rate of dendritic Ca2+ transients was dramatically reduced in Class IV neurons overexpressing Kir2.1 (ppk-Gal4 UAS-Kir2.1) or in neurons of larvae with mutations of the L-type VGCC gene (Ca-α1DX10/AR66 and Ca-α1DX7/AR66). *** p < 0.001 versus wild type by Fisher’s exact test. (E) Ca2+ fluctuations in dendrites of Ca-α1D mutant neurons (Ca-α1DX10/AR66). Gray lines indicate Ca2+ responses of 17 cells, and the blue line represents the averaged amplitude. (F) Ca2+ fluctuations in dendrites of fillet preparations when treated with 5 μM Nimodipine. Gray lines indicate Ca2+ responses of 11 cells, and the blue line represents the averaged amplitude. In E and F, we excluded data where ratiometric signals could not be continuously recorded due to movements of mounted larvae.

DOI: http://dx.doi.org/10.7554/eLife.12959.007

Figure 2—source data 1. A sample file of FRET imaging.
DOI: 10.7554/eLife.12959.008

Figure 2.

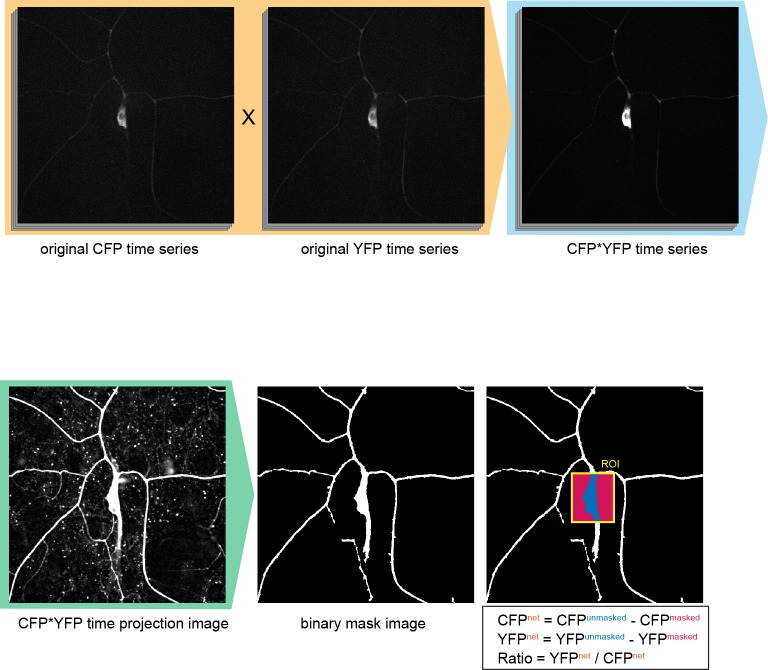
Figure 2—figure supplement 1. Configuration of the region-of-interest (ROI) in Ca2+ FRET imaging.

Figure 2—figure supplement 1.

To improve the fluorescent S/N ratio, original CFP time series were multiplied by the YFP series (orange shading). Then the multiplied images (CFP*YFP time series) were projected on the time-axis (CFP*YFP time projection image). Next the backgrounds of the image were equalized and the connected components (such as dendrites) were weighted by using the 'morphology filter' (MATLAB, MathWorks), and then the image was binarized to make the 'binary mask image'. The ROIs were indicated by rectangles on the original CFP or YFP time series, and the regions of proper signals and of background noise were determined by using the 'binary mask image' within such ROIs. Genotype: 3×[ppk-TN-XXL] (attP40)/+.
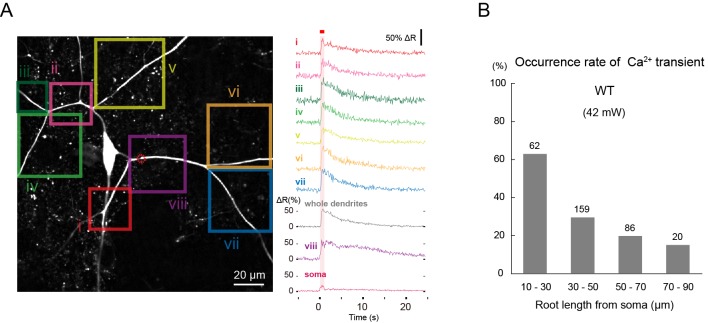
Figure 2—figure supplement 2. Ca2+ transients evoked by IR-laser irradiation of dendrites.

Figure 2—figure supplement 2.

Ca2+ responses of Class IV neuron ddaC expressing TN-XXL in whole-mount larvae upon IR irradiation. Throughout this figure, dendrites were targeted (e.g. red dotted circle in A). The output power of the laser was 42 mW. (A) (Left) Time-projected image that was constructed by multiplying CFP and YFP images at every time point. Rectangles i-viii indicate the regions of interest (ROIs). (Right) Global Ca2+ transients were detected in individual ROIs (i–viii). The transient was also detected when we drew a ROI around the entire dendritic arbor and excluded the soma (whole dendrite). Ca2+ transient measured in the dendrites including the IR-laser focus (trace labeled as 'viii') displayed a slower decay compared to the other dendritic regions (i–vii). A red square above traces and a magenta shading indicate duration of 1 s irradiation. (B) Occurrence rate of dendritic Ca2+ transients when stimulated at dendrites located at different root distances from somata. We performed one trial per cell and the number of cells examined is displayed above each bar. Genotype: 3×[ppk-TN-XXL] (attP2)/+.
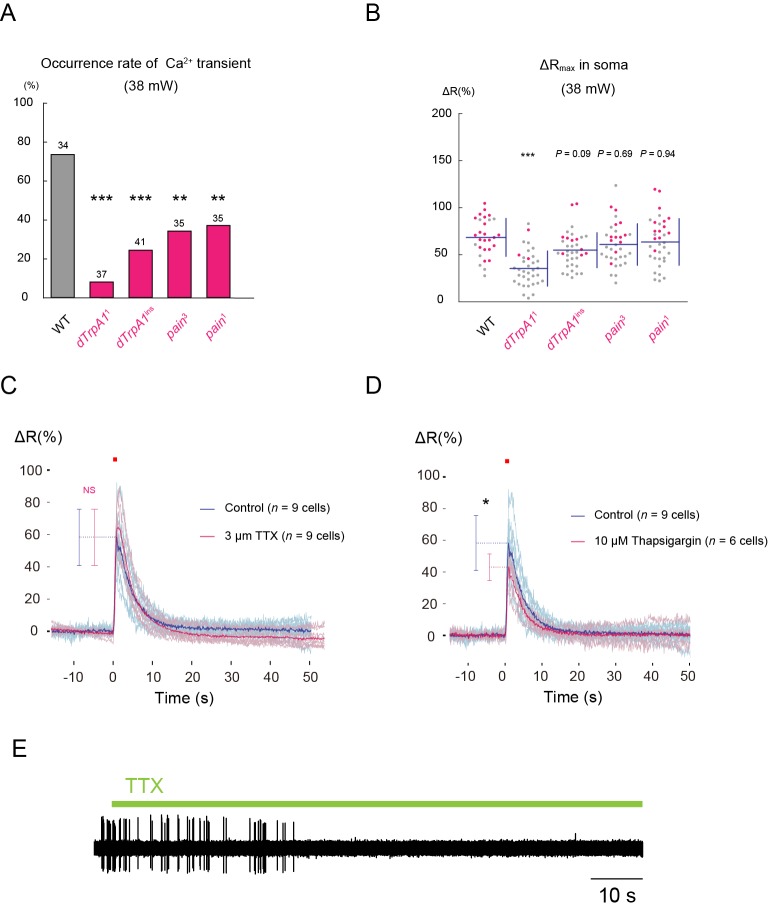
Figure 2—figure supplement 3. Effects of genotypes and pharmacological treatments on occurrence rates of dendritic Ca2+ transients, peak amplitudes of the transients, and/or slow Ca2+ rises in somata, when somata were irradiated.

Figure 2—figure supplement 3.

(A) Occurrence rates of dendritic Ca2+ transients in whole-mount preparations of the wild type, dTrpA1, and painless mutants, which were evoked by IR-laser irradiations (38 mW, 1 s) onto somata. We performed one trial per cell, and the number of cells of each genotype examined are indicated above each bar. (B) Peak amplitudes in somata of individual trials are plotted. Note that Ca2+ rises in somata were slow in contrast to the sharp dendritic Ca2+ transients when somata were irradiated (cf. Figure 2A; 'soma'). The magenta dots in B indicate occurrences of dendritic Ca2+ transients; the gray dots represent those with no apparent Ca2+ transient. The peak amplitudes of these slow Ca2+ rises were significantly decreased in dTrpA1 null mutants. This result was suggestive of a contribution of a dTrpA1-mediated physiological process, although an exact mechanism underlying such slow fluctuations remains unclear. (CE) Occurrences of dendritic Ca2+ transients in the presence of TTX or Thapsigargin treatment, which depletes the cytoplasmic Ca2+ store. We focused the IR-laser (38 mW, 1 s) onto the somata of Class IV neurons in the fillet-mounted larvae, which were pretreated with TTX and Thapsigargin (C and D, respectively). Blue traces indicate the amplitudes of Ca2+ transients of controls, whereas magenta traces indicate those with the drugs. The semitransparent traces represent amplitudes of Ca2+ transients of individual cells, and the solid traces show the average values of each group. Error bars indicate the standard deviations of the peak amplitudes of Ca2+ transients. The TTX-treatment had no effect on the occurrence and amplitude of Ca2+ transients (C), whereas the Thapsigargin-treatment only decreased the amplitude of Ca2+ transients (D). The effects of TTX was confirmed by loss of spikes. The application of TTX is indicated by a green bar above the trace (E). Fisher’s exact test (A), ANOVA and Dunnet post-hoc analysis (B), and Student’s unpaired t-test (C and D) were performed and statistical significances were assigned, *p < 0.05, **p < 0.01, ***p < 0.001. Genotype: 3×[ppk-TNXXL] (attP40)/+. To further address the contribution of Ca2+-induced Ca2+-release (CICR) from the cytoplasmic Ca2+ store to the formation of Ca2+ transients, we examined mutants for the inositol triphosphate receptor gene (Itp-r83A05616/90B.0) (Venkatesh and Hasan, 1997) or the Ryanodine receptor gene (RyRK04913/16) (Casas-Tinto et al., 2011Gao et al., 2013). Both mutants showed Ca2+ transients with occurrence and amplitude that were not significantly different from those in the wild type (data not shown), showing that the role of CICR was negligible.