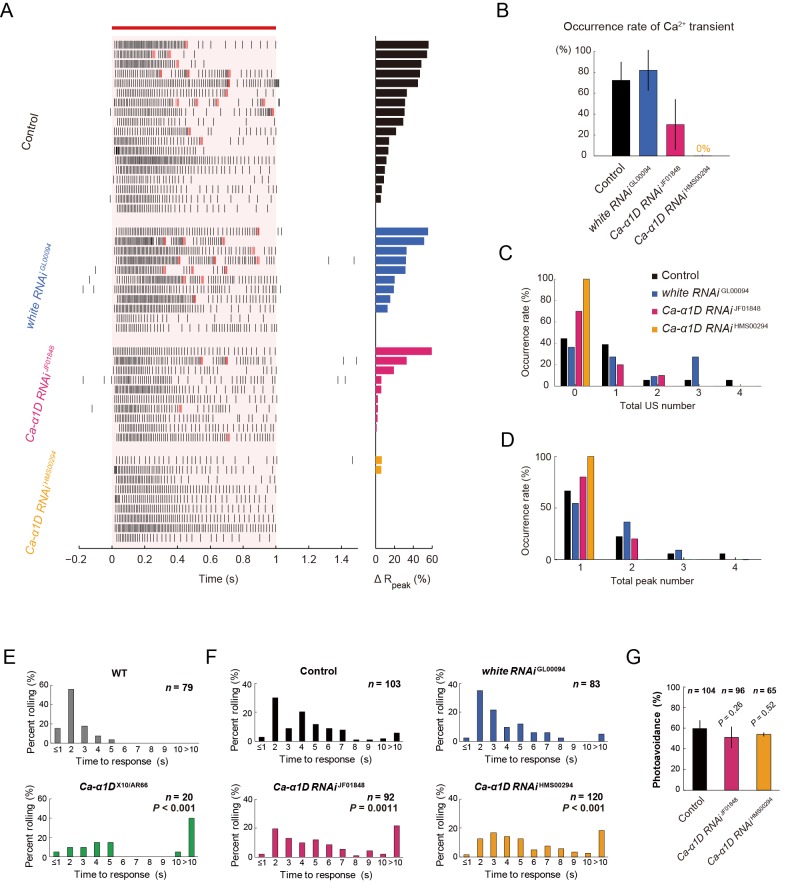
Figure 4. Responses of Class IV neurons with a knockdown of Ca-α1D and behavioral analysis of the knockdown larvae upon noxious thermal stimulation.
(A–D) Responses of control Class IV neurons (Control, n = 18 and white RNAi GL00094, n = 11) and Ca-α1D knockdown neurons (Ca-α1D RNAi JF01848, n = 10 and Ca-α1D RNAi HMS00294, n = 9) to 1 s irradiation of a 48-mW IR laser. (A) Raster plots of firing (left) and magnitudes of ΔRpeak corresponding to Ca2+ transients (right). Trials are sorted in a descending order of the magnitude of ΔRpeak (right bars). Red bar indicates the 1 s irradiation and red raster lines are US. (B) Occurrence rate of dendritic Ca2+ transients in each genotype([Control] 72.2 ± 17.6%, [white RNAi GL00094] 81.8 ± 19.4%, [Ca-α1D RNAi JF01848] 30.0 ± 24.2%, [Ca-α1D RNAi HMS00294] 0.0 ± 0.0%; mean ± 95% confidence interval [Clopper-Pearson method]). (C and D) Histograms of the total US number (C) or the total peak number (D) during the irradiation in the control and the knockdown neurons. The total peak number of firing rate fluctuation is defined as in the text. See also Figure 3A and its legend. (E and F) The distribution of nocifensive escape locomotion latency for wandering third-instar larvae of the wild type and the Ca-α1D mutant that were stimulated with a 47°C probe. The numbers of larvae tested are indicated and data are presented as percentage. (E) The distributions of the wild-type and Ca-α1D mutant larvae (mean latency: [w1118] 1.78 s, [Ca-α1D AR66/X10] 6.12 s; Wilcoxon rank-sum test). (F) The distributions of control larvae and larvae with Class IV neuron-specific white or Ca-α1D knockdown. The Ca-α1D mutant and the Ca-α1D knockdown larvae showed significant delayed nocifensive responses in comparison to the wild type (E) and the controls (Control and white RNAi GL00094) (F), respectively. p values in F are those of the test between white RNAi GL00094 and each of the Ca-α1D knockdowns (mean latency: [Control] 3.87 s, [white RNAi GL00094] 3.39 s, [Ca-α1D RNAi JF01848] 5.21 s, [Ca-α1D RNAi HMS00294] 5.25 s; Wilcoxon rank-sum test with Bonferroni correction). (G) Percentage of larvae avoiding blue light (457–487 nm; 0.72 mW/mm2; [Control] 59.6 ± 8.0%, [Ca-α1D RNAi JF01848] 53.9 ± 10.3%, [Ca-α1D RNAi HMS00294] 51.0 ± 8.5%; mean ± 95% confidence interval [Clopper-Pearson method]). We employed GMR-hid to ablate Bolwig’s organs in the photo-avoidance assay. p values are indicated (two-tailed Fisher’s exact test). Sixty-five to 104 larvae were tested for each condition.
DOI: http://dx.doi.org/10.7554/eLife.12959.018
Figure 4—figure supplement 1. Simultaneous recordings of firing responses and dendritic Ca2+ transients in fillet preparations of Ca-α1D knockdown larvae upon noxious thermal stimulation.


