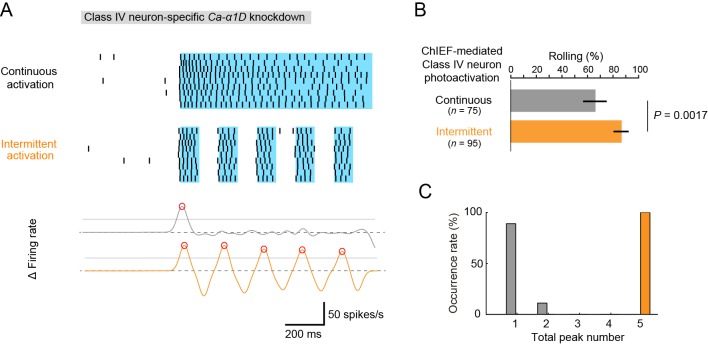
Figure 5. Optogenetic activation of Class IV neurons.
(A) Data obtained from fillet preparations of larvae where Ca-α1D gene was knocked down specifically in Class IV neurons. (Top) Raster plots of firing. A faster kinetic variant of ChR2, ChIEF, was expressed selectively in the neurons and activated with a blue LED continuously ('Continuous activation'; n = 9) or in a pulsatile fashion ('Intermittent activation'; n = 9). (Bottom) The time derivative of firing rates under the continuous activation (gray) or intermittent activation (orange). The peak of firing rate fluctuation is defined as in the text and marked with red circles. (B) Percentage of larvae rolling their bodies upon optogenetic activation ([Continuous] 65.9 ± 11.5%, n = 75; [Intermittent] 88.5 ± 7.6%, n = 95; mean ± 95% confidence interval [Clopper-Pearson method]). p-Value is indicated (two-tailed Fisher’s exact test). (C) A histogram of the total peak number during the continuous activation (gray) or intermittent activation (orange).

