

Abstract
The nucleolus serves as a principal site of ribosome biogenesis but is also implicated in various non-ribosomal functions, including negative regulation of the pro-apoptotic transcription factor p53. Although disruption of the nucleolus may trigger the p53-dependent neuronal death, neurotoxic consequences of a selective impairment of ribosome production are unclear. Here, we report that in rat forebrain neuronal maturation is associated with a remarkable expansion of ribosomes despite postnatal down-regulation of ribosomal biogenesis. In cultured rat hippocampal neurons, inhibition of the latter process by knockdowns of ribosomal proteins S6, S14, or L4 reduced ribosome content without disrupting nucleolar integrity, cell survival, and signaling responses to the neurotrophin brain-derived neurotrophic factor. Moreover, reduced general protein synthesis and/or formation of RNA stress granules suggested diminished ribosome recruitment to at least some mRNAs. Such a translational insufficiency was accompanied by impairment of brain-derived neurotrophic factor-mediated dendritic growth. Finally, RNA stress granules and smaller dendritic trees were also observed when ribosomal proteins were depleted from neurons with established dendrites. Thus, a robust ribosomal apparatus is required to carry out protein synthesis that supports dendritic growth and maintenance. Consequently, deficits of ribosomal biogenesis may disturb neurodevelopment by reducing neuronal connectivity. Finally, as stress granule formation and dendritic loss occur early in neurodegenerative diseases, disrupted homeostasis of ribosomes may initiate and/or amplify neurodegeneration-associated disconnection of neuronal circuitries.
Keywords: neurite outgrowth, neurodegeneration, neurodevelopment, neurotrophin, nucleolus, ribosome
Introduction
The ribosome is the principal component of the protein synthesis machinery. Most steps of ribosomal biogenesis occur in the nucleolus starting with the RNA-polymerase-1 (pol 1)2-mediated transcription of rRNA genes (1). In addition, pol 1 activity is required for the maintenance of the nucleolus. Therefore, inhibition of pol 1 not only blocks ribosomal biogenesis but also perturbs non-ribosomal functions of the nucleolus, including negative regulation of the pro-apoptotic transcription factor p53 (2). Although pol 1 initiates ribosome production, many additional steps are required for that process, including rRNA processing and binding to ribosomal proteins (RPs) (3). Consequently, depletion of various RPs, including S6 or S14, disrupts ribosomal biogenesis without interfering with nucleolar integrity (4).
Impaired ribosome production and/or ribosomal deficits are documented in various neurodegenerative diseases, including Alzheimer, Huntington, Parkinson, amyotrophic lateral sclerosis (ALS), and fronto-temporal lobe dementia (FTLD) (5–13). Reduced ribosomal biogenesis may also contribute to neurodevelopmental disorders. Thus, microcephaly and neurodevelopmental delays are present in Bowen-Conradi syndrome that is caused by deficiency of the ribosomal biogenesis factor EMG1 or in patients with a newly described RPL10 ribosomopathy (14, 15). In addition, nucleolar insufficiency has been documented in Rett, Prader-Willi, Roberts, and, Cornelia DeLange syndromes (16–18). Hence, determining neuronal consequences of disrupted ribosomal homeostasis may help to elucidate pathogenesis of several neurodegenerative and neurodevelopmental disorders.
Inhibition of pol 1-driven transcription is sufficient to induce neuronal death (7, 19–21). Such a response has been associated with nucleolar disruption and activation of p53. In addition, we have previously reported that pol 1 is necessary for neurite outgrowth in response to activation of the BDNF-ERK1/2 signaling cascade (22). Although such observations may suggest that ribosome biogenesis is critical for neuronal morphogenesis, they do not prove its role in this process. Indeed, disruption of proliferative growth following inactivation of a pol 1 co-factor Treacle has been shown to be a consequence of p53 activation rather than ribosomal depletion (23). Although the pol 1 requirement for neurite outgrowth was demonstrated with p53 being blocked to enhance survival of pol 1-inhibited neurons, it is conceivable that disruption of the p53-independent, non-ribosomal functions of the nucleolus may reduce morphogenesis (22). Examples of such functions include negative regulation of some branches of stress signaling or non-rRNA processing (24, 25).
This study was initiated to determine neuronal consequences of ribosomal depletion. First, activity of ribosomal biogenesis and cellular ribosome content were monitored during rat forebrain development. Then, in cultured rat hippocampal neurons, ribosome supply was disrupted to investigate its role in growth and maintenance of the dendritic tree.
Experimental Procedures
Animals
Sprague-Dawley pregnant female rats were purchased from Harlan (Indianapolis, IN). Timed pregnant animals were used for collecting cortical samples from embryonic brains. For postnatal development studies, two separate litters were used to collect samples from littermates of various ages. All animal experiments strictly followed the protocols that were approved by the Institutional Animal Care and Use Committee of the University of Louisville and the National Institutes of Health guidelines.
Materials
Human recombinant BDNF was obtained from Alomone (Israel). Oligonucleotides were purchased from IDT. All other reagents were obtained from Sigma, VWR, Invitrogen, or Qiagen unless stated otherwise.
Plasmids
The following plasmids were described previously: chicken β-actin promoter-driven EGFP (26) and RFP (27); tagged ribosomal protein vectors RPS6-EGFP, RPS14-Venus, and RPL4-EGFP (28); CRE-luciferase and EF1α-LacZ (EF1α promoter-driven β-galactosidase) (29); Kif5C560-dTomato (30); shTIF1A, shGFP, and DN-p53 (19); shLuc (22); and pSuper-TRE and ptTS (31).
Cell Culture
Cultures of hippocampal neurons were prepared from newborn Sprague-Dawley rats at postnatal day 0 (P0) as described previously (32). Cells were plated onto poly-d-lysine- and laminin-coated 12-mm diameter plastic coverslips that were produced in the lab from the electron microscopy-grade Mylar masks (Electron Microscopy Sciences, catalog no. 50425). Hippocampal neurons were grown in Neurobasal medium containing 2% B-27 supplement, 1 mm l-glutamine, 100 units/ml penicillin, and 0.1 mg/ml streptomycin unless indicated otherwise. Half of the medium was changed every other day. COS-7 cells were maintained in DMEM supplemented with 10% fetal bovine serum, 100 units/ml penicillin, and 0.1 mg/ml streptomycin. Neuronal transfections were performed using Lipofectamine 2000 as described previously (32). A standard Lipofectamine 2000 protocol was used to transfect COS-7 cells as recommended by the manufacturer.
BDNF Treatment
For cell stimulations, BDNF stock solution was prepared in 0.1% BSA/PBS at 5 μg/ml. For dendritic outgrowth studies, BDNF was added after replacement of half the culture media with neurobasal, 0.5% B27. For all other experiments, BDNF was added directly to the regular culture medium. Vehicle control treatments were performed using 0.1% BSA/PBS.
Quantitative Reverse Transcriptase-PCR
TRIzol-based RNA isolation, cDNA synthesis, and quantitative PCR were performed as described previously (19). The RNA levels were analyzed using ΔΔCt method; each sample was run in triplicate; 18S rRNA was used as a normalizer. The sequence of oligonucleotide primers is provided in Table 1.
TABLE 1.
Quantitative RT-PCR primers
| Gene name | Primer | Primer sequence (5′ → 3′) |
|---|---|---|
| Pre-rRNA (5′ETS) | Forward | tggggcagctttatgacaac |
| Reverse | tagcaccaaacgggaaaacc | |
| Pre-rRNA | Forward | tctcgctcttccctcgac |
| (ITS1) | Reverse | ccggagagatcacgtacca |
| 18S rRNA | Forward | gttggttttcggaactgaggc |
| Reverse | gtcggcatcgtttatggtcg | |
| Rpl7 | Forward | caagcgcctgaggaagaag |
| Reverse | tgcgggcacatagaagttg | |
| Rpl22 | Forward | gatgctgccaattttgagc |
| Reverse | cctcggaagtgacagtgatc | |
| N-Myc | Forward | aggatgcgtttggtctgg |
| Reverse | tgcagcttctcgttcactg | |
| Gapdh | Forward | aggtcggtgtgaacggatttg |
| Reverse | tgtagaccatgtagttgaggtca |
DNA and RNA Purification
DNA and RNA were purified using DNeasy Blood and Tissue kit (Qiagen, catalog no. 69504) and TRIzol, respectively. Concentrations of the nucleic acids were determined using a UV spectrophotometer (Nanodrop 2000, Thermo Scientific).
Ribosome Visualization
Animals were euthanized, and brains were fixed in 4% paraformaldehyde for 24 h, cryoprotected in 30% sucrose for at least 3 days at 4 °C, mounted in a Cryomount medium, and sectioned coronally on a cryostat to produce 25-μm-thick sections through the dorsal hippocampus. Mounted sections were used for stainings. For experiments with cultured neurons, a standard 20-min 4% formaldehyde fixation was used. Ribosomes were visualized with the NeuroTrace 500/525 Green Fluorescent Nissl Stain (Invitrogen, N21480, 1:500); DNA was counterstained with 2.5 μg/ml Hoechst-33258. To control for specificity of NeuroTrace staining, some brain sections or coverslips with attached cells were pre-treated with RNase A (0.13 units/μl in PBS, 1 h at 37 °C).
Protein Synthesis Assays
Protein synthesis was determined using puromycin labeling of nascent peptides that were then detected in cell culture homogenates or at the single cell level. For culture homogenate assay, SUrface SEnsing of Translation (SUnSET) technique was employed (33). Cells were treated with 20 μg/ml puromycin (Sigma, P7255) for 30 min. Western blotting with a mouse monoclonal anti-puromycin antibody (clone PMY-2A4, the Developmental Studies Hybridoma Bank at University of Iowa) was used to detect puromycinylated peptides by Western blotting. Five μg of total protein/sample was used for each analysis. To visualize protein synthesis in individual neurons, the O-propargyl-puromycin (OPP) labeling method was used followed by Click-iT chemistry detection of nascent peptides (34). A commercial kit was employed according to the manufacturer's recommendations (Click-iT Plus OPP Alexa Fluor 594 protein synthesis assay kit, Molecular Probes, C10457).
Immunostaining
Slide-mounted brain sections were prepared as for ribosome staining. Then they were incubated in 10 mm sodium citrate, 0.05% Tween 20, pH 6.0, at 90–95 °C for 20 min followed by standard immunostaining protocol with mouse monoclonal anti-nucleophosmin/B23 antibody (1:750, Sigma catalog no. B0556). Some sections were co-immunostained for the neuronal marker NeuN (rabbit polyclonal, 1:1000, Millipore catalog no. ABN78); Hoechst 33258 was used to counter-stain nuclei. All stainings of cultured neurons were performed following 20 min of fixation in 4% formaldehyde at room temperature; 4% formaldehyde in 4% sucrose was used for GFP immunostaining. The following primary antibodies were used as follows: rabbit anti-GFP (MBL, catalog no. 598; 1:1000); chicken anti-β-galactosidase (Abcam, ab9361, 1:1000); mouse anti-B23/Npm1 (Sigma, B0556, 1:750); rabbit anti-phospho-RPS6 (Ser(P)-235/236, Cell Signaling Technology, catalog no. 4856, 1:200), rabbit anti-phospho-Akt (Ser(P)-473, Cell Signaling Technology, catalog no. 9271, 1:200), mouse anti-phospho-p44/42 MAPK (ERK1/2, Thr-202/Tyr-204, Cell Signaling Technology, catalog no. 9106, 1:200), rabbit anti-NeuN (Millipore, catalog no. ABN78, 1:1000), rabbit anti-TIA-1/TIAR antibody (Santa Cruz Biotechnology, catalog no. 28237, 1:100). The following secondary antibodies were used: Alexa Fluor 488 anti-mouse IgG (Invitrogen, A11029, 1:300), Alexa Fluor 488 goat anti-rabbit IgG (Invitrogen, A11034, 1:300), Alexa Fluor 594 anti-mouse IgG (Invitrogen, A11005, 1:300), Alexa Fluor 594 anti-chicken IgG (Jackson ImmunoResearch, catalog no. 103-585-155, 1:300). In all cases, standard staining protocols were followed.
Quantification of the Fluorescence Intensity (FI)
Stained cells on plastic coverslips were visualized with Zeiss Observer.Z1 fluorescent microscope using a ×40 lens. Stained brain sections were visualized with a Nikon Eclipse Ti inverted microscope using a ×40 or a ×4 lens to image nucleophosmin immunostaining or ribosome staining, respectively. Digitalized pictures were captured using Zeiss AxioVision (Zeiss) or Elements software (Nikon Instruments) followed by conversion to grayscale TIFF files. Identical exposure times were used for all pictures that were used for comparative analyses. Quantification of the FI at the single cell level or across stained 25-μm-thick brain tissue was prepared by using “Integrated Density” parameter in the ImageJ software with background correction. Whenever territory of the nucleus or the nucleolus was measured, an “Area” parameter was used. A change of FI was expressed as a fold control that was defined by a ratio of an individual FI value to the average FI value of the control group as indicated for each set of experiments. Such calculations were performed for each independent experiment before pooling data for statistical analysis.
Western Blot Analysis
Western blotting was performed using standard procedures. The primary antibodies were as follows: anti-GFP (MBL, 1:1000), anti-β-galactosidase (MP Biomedicals, 1:1000), anti-puromycin (DSHB, PMY-2A4, 1:1000), and anti-GAPDH (Chemicon, 1:5000), and secondary antibodies were horseradish peroxidase-conjugated.
Generation of shRNA Expression Constructs
To generate shRNAs against RPs, each mRNA sequence was analyzed using shRNA design software (Ambion) and off-target prediction software (Sonnhammer). Comparison of human and rat mRNA sequences of S6 and S14 demonstrated conservation of the identified target regions. Oligonucleotides were designed as follows: S6-1, 5′gatccccgatgatgtccgccagtatgttcaagagacatactggcggacatcatcttttta3′; S6-2, 5′gatccccgattcagcgtcttgttactttcaagagaagtaacaagacgctgaatcttttta3′; S14-1, 5′gatccccggagagaatgtatttggtgttcaagagacaccaaatacattctctccttttta3′; L4-1, 5′gatccccctttgttcacaccaacttgttcaagagacaagttggtgtgaacaaagttttta3′; L4-2, 5′gatccccggccttcagaaacatccctttcaagagaagggatgtttctgaaggccttttta3′; L11-1, 5′gatccccggtgcgagagtacgaattattcaagagataattcgtactctcgcaccttttta-3′; L11-2, 5′gatcccccttctcagataccggcaacttcaagagagttgccggtatctgagaagttttta3′ together with their complementary counterparts, annealed, and subcloned into a pSuper vector (OligoEngine) digested with BglII and HindIII. After validation, an equimolar mix of shRNAs against S6 or L4 was used in all other experiments. The pSuper-TRE variant was used to prepare tetracycline-inducible shRNAs (31).
Quantification of Neuronal Survival
To visualize nuclear morphology, cells were stained with Hoechst-33258 followed by fluorescent microscopy (35). Cell with uniformly stained nuclei were scored as viable cells; cells with condensed and/or fragmented nuclei were scored as apoptotic cells. At least 150 cells were analyzed for each condition in each experiment.
Transcription Luciferase Assay
Activities of luciferase and β-gal were determined using a standard procedure (29). Luciferase activity was normalized against β-gal.
Quantification of the Stress Granule Response
TIA-1 immunostained cells (staining protocol as described in Ref. 36) were imaged using the Zeiss Observer.Z1 system equipped with a ×63 oil immersion lens. Formation of stress granules (SG) was identified by perikaryal appearance of at least four large TIA-1/TIAR-positive foci (diameter >0.5 μm) together with reduced intensity of the diffuse TIA-1/TIAR signal. Cells that showed occasional fine foci together with a bright diffuse signal throughout the soma were interpreted as SG-negative. The fraction of SG-positive cells was determined by scoring at least 220 cells for each experimental condition.
Morphometric Analysis of Neurites
Neurites of transfected neurons were visualized by GFP immunostaining. Images were captured as grayscale TIFF format files using a Zeiss Observer.Z1 fluorescent microscope with ×10 objective lens and AxioVision software. Unfragmented dendrites that were longer than 15 μm were traced manually with the NeuronStudio freeware (37). The resulting dendritic arbor skeletons were exported into MATLAB program (MathWorks). A custom MATLAB script was prepared to enable automatic analysis and to extract the key morphological parameters of the dendritic tree, including total length of dendrites, territory of the dendritic tree, number of primary dendrites, number of branches per primary dendrite, and Sholl analysis. The script is available to other researchers upon request.
Statistical Analysis
Unless indicated otherwise, data were analyzed using one- or two-way ANOVA that was followed by Fisher's LSD post hoc tests.
Results
Ribosome Biogenesis Is Down-regulated during Forebrain Development
To monitor activity of ribosomal biogenesis in the developing rat neocortex, relative levels of pre-rRNA were determined by quantitative RT-PCR. Two different regions of pre-rRNA (5′ external transcribed spacer or 5′ external transcribed spacer and internal transcribed spacer-1 or ITS1) were amplified for quantifications. As pre-rRNA is rapidly processed to mature rRNAs, its relative levels provide a good indicator of pol 1-driven transcription that initiates ribosomal biogenesis (19). On embryonic day 17, a 40% decline of 5′ external transcribed spacer was observed as compared with its embryonic day 12 levels (Fig. 1A). It was followed by a 90% decline at postnatal day 1 (P1). The relative expression of pre-rRNA remained at such low levels throughout the postnatal development. Identical trends were observed for the ITS1 amplicon of pre-rRNA (Fig. 1A). Moreover, expression of mRNAs for protein components of the ribosome, including Rpl7 and Rpl22, showed a similar expression pattern (Fig. 1B). Such a postnatal down-regulation of ribosomal biogenesis was associated with lower mRNA expression of N-Myc but not Gapdh (Fig. 1, C and D). N-Myc is a transcription factor that is known to drive cortical neurogenesis and regulate many ribosomal biogenesis genes (38, 39). Therefore, high activity of ribosomal biogenesis in the rat embryonic cortex may be related to ongoing proliferation of cortical neuroblasts (40).
FIGURE 1.
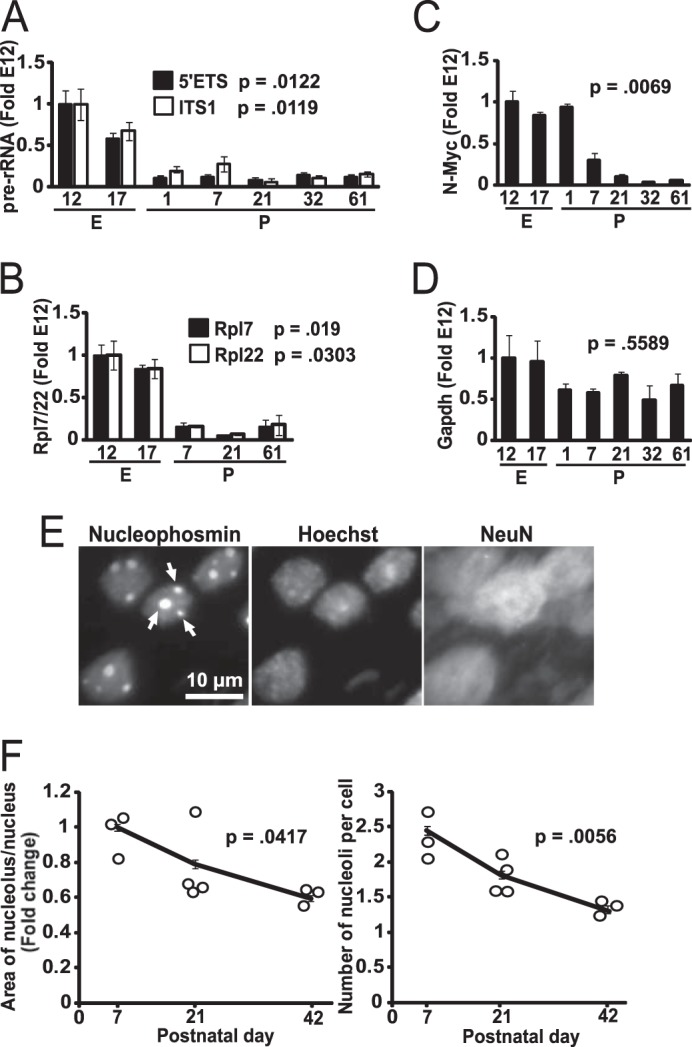
Down-regulation of ribosomal biogenesis during postnatal brain development. A–D, cerebral cortex was dissected from rat fetuses or pups at various ages as indicated by the number of days after conception (embryonic days, E) or birth (postnatal days, P). Relative RNA levels were determined using quantitative RT-PCR and presented as fold changes of embryonic day 12 values; 18S rRNA levels were used for normalization. Each data point represents averages from three individual animals ± S.E. After birth, cortical expression of pre-rRNA was sharply decreased as revealed by amplicons probing the 5′ external transcribed spacer or ITS1 region of pre-rRNA (A). Likewise, expression of Rpl7 and Rpl22 was reduced (B). These changes were coinciding with decreased expression of N-Myc that is a major transcriptional regulator of ribosomal biogenesis genes (C). In contrast, the widely expressed housekeeping gene Gapdh remained unchanged during the studied period (D). E and F, effects of brain cell maturation on morphology of the nucleolus. In brain sections that were cut through the dorsal hippocampus, nucleoli were visualized using immunofluorescence staining for the nucleolar marker nucleophosmin. Representative images of cells from layers 4–5 of the P7 retrosplenial cortex are shown in E. At that age, most of the cells in this region were neurons as revealed by positive immunostaining for the neuronal marker NeuN. Cell nuclei were counterstained with Hoechst-33258 (Hoechst). The nucleolar area and the number of nucleoli/nucleus decreased during postnatal maturation of the retrosplenial cortex (F). F, circles represent values from individual animals, and trend lines connect the means; error bars are S.E. At least 38 cells from two sections were analyzed for each individual animal. The p values for the effect of age are indicated (Kruskal-Wallis ANOVA).
As cellular activity of ribosomal biogenesis is often correlated with size and/or number of nucleoli in a given cell (41), these parameters were evaluated in neuron-like cells of the developing neocortex at P7, P21, and P42. Nucleoli were visualized by immunofluorescence staining with an antibody against the nucleolar protein nucleophosmin/B23 (Fig. 1E). The analysis focused on layers 4–5 of the retrosplenial cortex as this region could have been reproducibly identified throughout the developmental time points that were included in this study. In addition, most perikaryal profiles from this region showed positive staining for the neuronal marker NeuN and could be imaged in a non-overlapping manner enabling accurate morphometric analysis of a neuron-enriched cell population (Fig. 1E). Over the studied period, relative nucleolar size was declining as determined by the ratio of the nucleolar area to the total nuclear area (Fig. 1F). Likewise, a number of nucleoli per cell was also decreasing (Fig. 1F). Thus, ribosomal biogenesis is down-regulated during forebrain development with most dramatic changes occurring immediately after birth.
Ribosome Content Is Increasing during Forebrain Development
To determine whether cellular ribosome content changes during brain development, brain sections from P7, P21, and P42 rats were stained with a fluorescent dye NeuroTrace Green that labels cellular ribosomes (Fig. 2, A and B). For normalization, cellular DNA was counterstained with Hoechst-33258. Importantly, RNase pre-treatment abolished the NeuroTrace Green signal as expected for ribosomes (Fig. 2A). In the investigated period of cortical development, the NeuroTrace/Hoechst intensity ratio increased by more than 100% suggesting doubling of the average cellular ribosome content (Fig. 2B). Moreover, a steady increase of the ribosome content was detected during in vitro maturation of hippocampal neurons (Fig. 2, C and D). In this system, ribosome content doubled between DIV1 and DIV6 and then DIV6 and DIV18 (Fig. 2D). When culture medium was supplemented with BDNF, the expansion of the ribosome pool appeared to be slightly accelerated. Significant differences of about 10% were observed at DIV4, DIV8, and DIV12 but not at other time points, including the final DIV18. Therefore, at least in developing neurons, perikaryal ribosome content is only moderately affected by exogenous BDNF. As total RNA consists mostly of rRNA, neuronal maturation-associated accumulation of ribosomes is also supported by nearly 3-fold higher DNA-normalized RNA content at DIV7 as compared with DIV1 (Fig. 2E, p < 0.05, U test).
FIGURE 2.

Neuronal maturation-associated increase of the perikaryal ribosome pool. A and B, brain sections cut through the dorsal hippocampus were used for ribosome staining with NeuroTrace 500/525 Green. DNA was counterstained with Hoechst-33258. A, representative images of the retrosplenial cortex at P42; cortical layers are indicated by roman numerals; cc, corpus callosum. A′, representative images of layer five neurons from that region. As expected, ribosomal signal is present in perikarya and nucleoli (arrows); moderately stained proximal dendrites were also observed at higher exposure times (data not shown). Ribosomal nature of the NeuroTrace signal was further confirmed by its disappearance on sections that were pre-incubated with RNase A. B, fluorescence intensity (FI) of the ribosomal and the DNA signal was determined in layers 4–5 of the retrosplenial cortex. Equally exposed and non-saturated images were used; for each animal, three sections were analyzed; cortical architecture was revealed by the NeuroTrace staining, and the entire region of interest was marked for FI measurements. Fold change was calculated for each individual FIribosome/FIDNA ratio by normalization to the mean FIribosome/FIDNA ratio of the P7 group. Ribosome content increased during postnatal development of the retrosplenial cortex. On the graph, circles represent values from individual animals, and the vertical lines indicate the means ± S.E., p value for the effect of age is indicated (Kruskal-Wallis ANOVA). C and D, ribosome/DNA staining was performed on fixed rat hippocampal neurons that were isolated from newborn pups and maintained in dissociated culture for the indicated time. In addition, some cultures were maintained in the medium that was supplemented with BDNF (10 ng/ml added on DIV1 and then 5 ng/ml fresh BDNF added every other day with each media change). C, representative images reveal perikaryal and nucleolar presence of ribosomes (arrows). In addition, a weak signal was detected in some dendrites in the immediate proximity to perikarya (arrowheads). D, perikaryal ribosome content kept increasing with neuronal maturation under cell culture conditions. Although BDNF-stimulated neurons appeared to have more ribosomes at some time points, the overall effect of the neurotrophin was small albeit significant (two-way ANOVA, effect of BDNF, F1,788 = 13.363, p < 0.001). Data represent means ± S.E. of at least 76 cells from three independent experiments; *, p < 0.05 (post hoc tests). E, neuronal maturation-associated expansion of ribosomes is indicated by increasing total RNA content as rRNA represents most of total cellular RNA. RNA content was normalized against DNA; data represent means ± S.E. from three independent experiments; *, p < 0.05, U test.
The presented data suggest that the average daily growth rates of the perikaryal ribosome pool were 3.1 and 23.7% in the cortex and in cultured hippocampal neurons, respectively. The divergence of the rates may be due to many factors, including brain region differences and cell culture effects. In addition, the neuronal ribosome accumulation may have been underestimated in vivo due to analysis of a mixed population of cells with an increasing glial component during brain maturation. In conclusion, although ribosomal biogenesis was sharply down-regulated as neurons became post-mitotic, the perikaryal ribosome content kept increasing throughout further stages of neuronal maturation, including those that are associated with intense neurite outgrowth. Such observations raise the possibility that continuing production of ribosomes is needed to support neuronal morphogenesis by providing adequate machinery for protein synthesis.
Indeed, neuronal maturation-associated expansion of ribosomes was accompanied by increased global protein synthesis (Fig. 3). Thus, total content of newly synthesized proteins increased 1.85-fold between DIV1 and DIV7 as determined by puromycin labeling of nascent peptides followed by Western blotting (Fig. 3A). In addition, in situ detection of nascent peptides revealed a similar upward trend when analyzed at DIV2, DIV6, and DIV9 (Fig. 3, B and C). Therefore, in developing neurons, increasing the number of ribosomes may be needed to support a growing demand for new proteins to build expanding neurites and establish neuronal connectivity.
FIGURE 3.

Neuronal maturation-associated increase of protein synthesis. A, SUnSET Western blot protein synthesis assay. Cultured hippocampal neurons were treated with 20 μg/ml puromycin for 30 min, and nascent peptides were detected using anti-puromycin antibody. Five μg of total protein was used per lane. After normalization to total protein content, levels of puromycinylated peptides reflect relative activity of global protein synthesis during the 30-min labeling period. To provide additional control of total protein content, blots were re-probed with an antibody against GAPDH. Numbers below the blot indicate relative content of nascent peptide signal as determined by densitometry with normalization against the GAPDH signal. Consistent with data in Fig. 1D, expression of GAPDH did not appear to be affected by neuronal maturation when normalized to total protein; however, as expected for rapidly growing cells, total protein content was higher in DIV7 than DIV1 neurons when cell number normalization was applied (data not shown). B and C, neurons were treated with OPP whose incorporation into nascent peptides was visualized using fluorescent Click-iT chemistry. Cycloheximide was added 45 min before OPP. B, representative images of neurons that were identified by co-immunostaining for the neuronal marker NeuN (arrows). B′, translation inhibitor cycloheximide prevented OPP labeling of nascent peptides. Nuclei were visualized by counterstaining with the NuclearMask dye (Invitrogen). C, perikaryal accumulation of nascent peptides kept increasing with neuronal maturation (one-way ANOVA, effect of maturation, F2,335 = 204.32, p < 0.001). Data represent means ± S.E. of at least 111 cells from two independent experiments, ***, p < 0.001 (post hoc tests).
Knockdowns of Ribosomal Proteins Reduce Ribosomal Biogenesis
It has been well documented that in developing neurons and in proliferating cells, inhibition of pol 1 leads to nucleolar disruption (19, 42). However, in cell lines, knockdowns of RPs that are required for synthesis of the small ribosome subunit such as S6 or S14 result in ribosome biogenesis inhibition without nucleolar stress (4). Therefore, shRNA expression constructs were prepared to target these RPs (Fig. 4, A and B). As RPL4 is critical for biogenesis of the large ribosome subunit (43), shRNA against L4 was also prepared to test whether in neurons it may inhibit ribosome synthesis without nucleolar disruption (Fig. 4, A and B).
FIGURE 4.
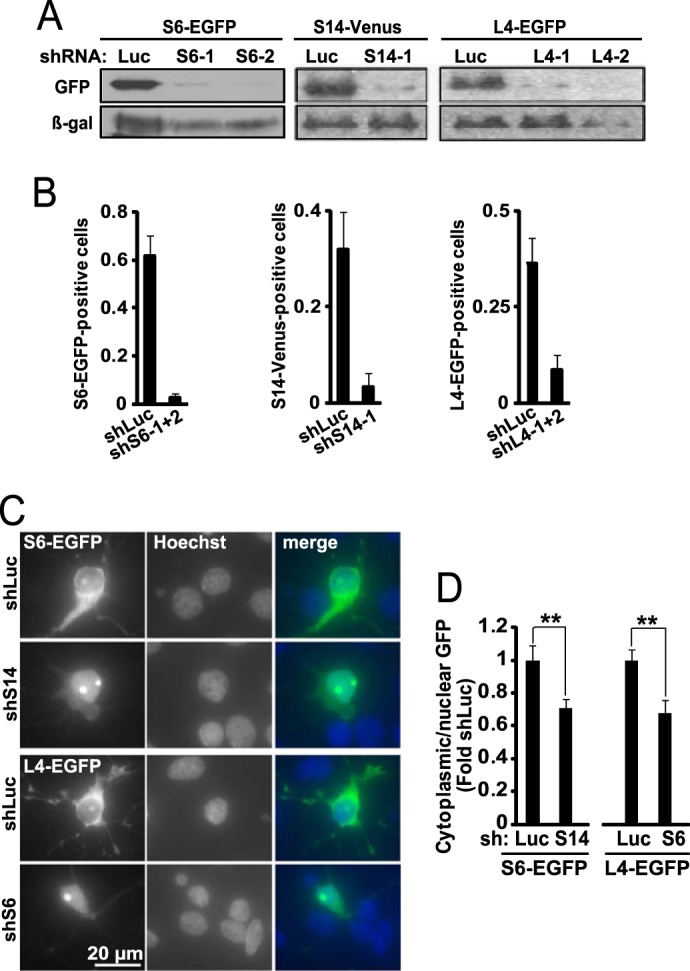
Knockdown of ribosomal proteins reduces ribosomal biogenesis depleting neuronal ribosomes. A, COS-7 cells were co-transfected with the anti-ribosomal shRNAs together with the expression vectors for their respective targets that were tagged with the GFP variants EGFP or Venus (2 + 2 μg of plasmid DNA/60-mm plate). Control shRNA was against Renilla luciferase (shLuc); to normalize for transfection efficiency, a β-galactosidase (β-gal) expression plasmid was also included (1 μg of plasmid DNAs/60-mm plate). Western blot for GFP revealed efficient knockdown of the targets 48 h post-transfection. B, DIV6, hippocampal neurons were co-transfected with the indicated shRNAs together with expression vectors for their tagged targets as well as β-gal (0.4 + 0.2 + 0.2 μg of plasmid DNAs/2 × 105 neurons, respectively). Equimolar mixes of individual shRNAs against S6 or L4 were used in these and all further experiments unless indicated otherwise. At DIV9, transfected cells were visualized by immunostaining for β-gal, and their EGFP- or Venus-positive fraction was determined. Note a decrease in EGFP-/Venus-positive cells after knockdowns of the respective RPs; means ± S.D. of four sister cultures from two independent experiments are depicted. C and D, effects of anti-ribosomal shRNAs on ribosome biogenesis. DIV6 hippocampal neurons were co-transfected with the shS14 and S6-EGFP or shS6 and L4-EGFP as indicated (0.4 + 0.15 μg of plasmid DNA/2·105 neurons, respectively). On DIV9 the cells were fixed, and ribosome distribution was monitored with GFP immunostaining; Hoechst 33258 was used to visualize nuclei. C, representative images of S6-EGFP- or L4-EGFP- expressing cells. In an shLuc-transfected neuron, RPs are present in the nucleolus, the perikaryal cytoplasm and proximal dendrites as expected for a ribosome marker (compare with Fig. 2C). The shS14 or shS6 increased nuclear retention of RP-EGFP fusion proteins. D, quantification of GFP fluorescence intensity in the nucleus and the perikaryal cytoplasm. Note reduced cytoplasmic/nuclear ratio of ribosomal markers after transfection of shS14 or shS6. Data represent means ± S.E. of at least 30 cells from two independent experiments; **, p < 0.01 (ANOVA, effects of shS14 or shS6, F1,99 = 7 or F1,58 = 10.4, respectively).
Next, tagged RPs, including S6-EGFP and L4-EGFP, were used to determine their nucleo-cytoplasmic partition following knockdowns of S14 and S6, respectively. Previous work has documented that free RPs accumulate in the nucleus/nucleolus, whereas their cytosolic location represents primarily the ribosome-bound pool (43). Therefore, the reduced cytosolic/nuclear ratio of transiently expressed RPs can be used as a sensitive indicator of disrupted ribosome synthesis (43). However, not all fluorescently tagged RPs assemble into ribosomal subunits when overexpressed at particular levels in a particular cell type (44). In such cases, reporter RPs remain mostly nuclear/nucleolar. Conversely, their ribosome incorporation is associated with the initial appearance of the reporter signal in the nuclei/nucleoli that is followed by its increasing intensity in perikarya (44). In neurons that were transfected with the control shRNA, S6-EGFP or L4-EGFP was observed in the nucleolus, throughout the perikaryon, and sometimes in proximal dendrites (Fig. 4C). Such a distribution pattern is reminiscent of ribosomes (Fig. 2C). In addition, when S6-EGFP expression was monitored in live neurons that were transfected at DIV0, EGFP appeared initially in the nucleus/nucleolus (DIV1–2) and then became predominantly present in the perikaryon and proximal dendrites (DIV5–7, data not shown). Hence, the reporter RPs that were used in these experiments appear to be incorporated in ribosomes.
When shRNA against S14 was combined with the S6-EGFP, the latter reporter was shifted to the nucleus confirming the critical role of S14 in biogenesis of the small ribosomal subunit (Fig. 4, C and D). Similar shift was observed with L4-EGFP when S6 was knocked down indicating that synthesis of the large ribosomal subunit may be impaired after S6 depletion (Fig. 4, C and D). These findings suggest that knocking down S6 or S14 perturbs ribosomal biogenesis in postmitotic neurons.
Neither Neuronal Survival nor Integrity of the Neuronal Nucleolus Is Affected by Moderate Ribosome Depletion
Previous work from proliferating cells suggested that RP knockdowns lead to activation of the pro-apoptotic transcription factor p53 even in the absence of the nucleolar stress (4). However, no major declines in cell survival were observed in RP-depleted hippocampal neurons (Fig. 5, A and B).
FIGURE 5.

In hippocampal neurons, inhibition of ribosomal biogenesis results in ribosome depletion without cell death or nucleolar disruption. DIV6 hippocampal neurons were co-transfected with shRNAs against RPs together with an expression vector for β-gal (A and B) or EGFP (C) or RFP (D and E) (0.4 + 0.2 μg of plasmid DNAs/2·105 neurons, respectively). Neuronal survival, nucleolar integrity, and perikaryal ribosome content were evaluated 3 days later. A and B, knockdowns of ribosomal proteins did not affect neuronal viability. Transfected cells were identified by β-gal immunostaining; nuclear morphology was visualized witch Hoechst-33258. A, transfected neurons with non-condensed nuclei were counted as live cells (arrows); presence of condensed and/or fragmented chromatin identified dead cells (arrowhead). B, quantitation of surviving fraction of transfected neurons. Data represent means ± S.E. of three independent experiments; NS, not significant; p > 0.05, U test. C, integrity of neuronal nucleoli after ribosomal protein knockdowns. Neuronal integrity was determined using nucleophosmin immunostaining; nuclei were counter-stained with Hoechst-33258. In neurons that received control shRNA (shLuc) or shRPs, the nucleophosmin signal was concentrated in the nucleoli (arrows). Conversely, when pol 1 activity was disrupted with shTIF1A, most nucleophosmin was nucleoplasmic (arrowhead); an adjacent untransfected neuron displayed nucleolar nucleophosmin (asterisk). D and E, reduced somatic ribosome content after inhibition of ribosomal biogenesis. On DIV7, 10 ng/ml BDNF was added to some cultures as indicated. D, representative images of ribosome staining in transfected neurons (e.g. RFP-positive; arrows). Note that pre-treatment with RNaseA abolished the ribosome signal (arrowhead). E, quantification of the perikaryal ribosome content. Data represent means ± S.E. of at least 45 individual cells from three independent experiments; two-way ANOVA, effect of shRNA, F3,556 = 39.543, p < 0.001; post hoc tests: ***, p < 0.001; NS, p > 0.05.
Nucleolar localization of nucleophosmin/B23 is highly sensitive to inhibition of pol 1 and serves as a convenient indicator of nucleolar integrity (19, 42). However, none of the anti-ribosomal shRNAs affected the nucleolar presence of nucleophosmin (Fig. 5C). Conversely, consistent with our previously published results from cortical neurons, knockdown of the pol 1 co-activator TIF1A resulted in nucleoplasmic dispersion of nucleophosmin (Fig. 5C) (19). Therefore, knockdowns of S6, S14, or L4 appear to have a selective effect on post-transcriptional steps of ribosomal biogenesis. Thus, at least in hippocampal neurons, knockdowns of these RPs allow us to study consequences of impaired ribosome biogenesis without interference by the nucleolar disruption and/or cell death.
After 3 days of expressing shS6, shS14, or shL4, the total perikaryal ribosome content was down by 22, 30, or 26%, respectively (Fig. 5, D and E). Addition of BDNF for the last 48 h of the experiment did not affect ribosome content in control neurons (Fig. 5, D and E). In addition, it did not rescue ribosomal deficits following RP knockdowns (Fig. 5E). Similar effects were observed with individual shRNAs targeting S6 or L4 as well as validated shRNAs against L11 (Table 2).3 In neurons that were transfected with the control shRNA, S6-EGFP or L4-EGFP was observed in the nucleolus, throughout the perikaryon, and sometimes in proximal dendrites (Fig. 4C). Hence, depletion of RPs reduces neuronal ribosome supply.
TABLE 2.
Effects of individual shRNAs on perikaryal ribosome content
| shRNA | Treatment |
|
|---|---|---|
| Vehicle | BDNF | |
| Luc | 1 ± 0.036a,b | 1.04 ± 0.038a,b |
| S6-1 | 0.522 ± 0.023c | 0.659 ± 0.033c |
| S6-2 | 0.617 ± 0.039c | 0.674 ± 0.029c |
| L4-1 | 0.611 ± 0.037c | 0.585 ± 0.029c |
| L4-2 | 0.724 ± 0.040a,b,c | 0.668 ± 0.032c |
| L11-1 | 0.651 ± 0.053c,d | 0.589 ± 0.046c |
| L11-2 | 0.605 ± 0.03c | 0.657 ± 0.026c |
a p < 0.001 as compared with shS6-1.
b p < 0.05 as compared with shS6-2.
c p < 0.001 as compared with shLuc.
d p < 0.05 as compared with shS6-1.
Signaling Responses to BDNF Are Maintained after Ribosome Depletion
It has been reported that independently of their protein synthesis functions, ribosomes provide an activation scaffold for the TORC2 branch of the mTOR pathway (45). In addition, at least in some neuronal populations, nucleolar stress was associated with inhibition of TORC1 signaling (21). Therefore, effects of BDNF on activation of several signaling kinases were examined in RP-depleted neurons. RP knockdowns reduced basal activities of TORC1 and TORC2 as evaluated by phosphorylation of S6 and Akt, respectively (Fig. 6, A–C). Conversely, they did not prevent BDNF-mediated activation of these pathways. For instance, in shLuc or shS14-transfected neurons, BDNF elevated pS6 levels 2.07- or 2.64-fold in unstimulated controls, respectively (p < 0.001, Fig. 6B). However, in RP-depleted neurons, the BDNF-mediated activation of TORC1 and TORC2 was reduced when normalized to basal pS6 and pAkt levels in shLuc-transfected neurons (Fig. 6, B and C). The shRPs did not interfere with BDNF-mediated activation of the ERK1/2 MAPK pathway except for a relatively minor reduction in the BDNF-induced increase of phospho-ERK1/2 levels after knockdown of S14 (Fig. 6, D and E). Moreover, in BDNF-stimulated neurons, activation of the CRE-driven transcription that is a well established pro-dendritic effector of the ERK1/2 pathway was unaffected by ribosomal depletion (Fig. 6F) (46, 47). Therefore, in cultured rat hippocampal neurons, at least moderate reduction of ribosome content does not prevent signaling responses to BDNF.
FIGURE 6.

Inhibition of ribosomal biogenesis does not prevent signaling responses to BDNF. A–E, neurons were transfected as for studies in Fig. 5, D and E. After 2 days, cells were stimulated with 50 ng/ml BDNF for 60 min (A–C) or 10 min (D and E) as indicated. A and B, S6 phosphorylation at residues Ser-235/236 (pS6) was monitored by immunofluorescence to determine activation of the PI3K-TORC1 pathway. A, representative images of transfected cells (arrows). B, analysis of perikaryal FI of the pS6 signal in transfected neurons revealed that RP knockdown did not prevent BDNF-mediated activation of TORC1. Conversely, the activation was abolished by the drug inhibitor of mTOR, KU0063794 (0.3 μm, KU006). However, BDNF effects on pS6 were reduced by shRPs. C, similar effects were also observed when TORC2 activity was monitored by immunofluorescence for the phosphorylated form of Akt at Ser-473. D and E, immunostaining for the phosphorylated ERK1/2 residues Thr-202/Tyr-204 (pERK1/2) revealed that RP knockdowns did not prevent the BDNF-mediated activation of the ERK1/2 pathway except its moderate reduction with shS14. The BDNF effect was abolished by the drug inhibitor of the ERK1/2 pathway, U0126 (50 μm). F, DIV4 neurons were transfected as for Fig. 5, A and B, except the CRE-luciferase reporter plasmid was added (0.4 μg of plasmid DNAs/2·105 neurons) and shRNA against GFP (shGFP) was used as a control. On DIV6, 10 ng/ml BDNF was added for 8 h as indicated. CRE-driven transcription was determined by measuring luciferase activity that was normalized against β-gal activity. BDNF-mediated activation of CRE-driven transcription was unaffected by inhibition of ribosomal biogenesis. B, C, and E, data represent means ± S.E. of fold controls as defined by dividing the FI value of a cell by the average FI value of control cells (shLuc-transfected, no BDNF stimulation); at least 60 (B and C) or 48 (E) randomly selected individual neurons from three independent experiments were analyzed; **, p < 0.01; ***, p < 0.001; NS (not significant), p > 0.05. F, fold controls were calculated as ratios of β-gal-normalized luciferase activity from each sister culture to the average of control cultures (shGFP-transfected, no BDNF stimulation); means ± S.D. of eight sister cultures from two independent experiments are depicted.
Protein Synthesis Deficiency in Ribosome-depleted Neurons
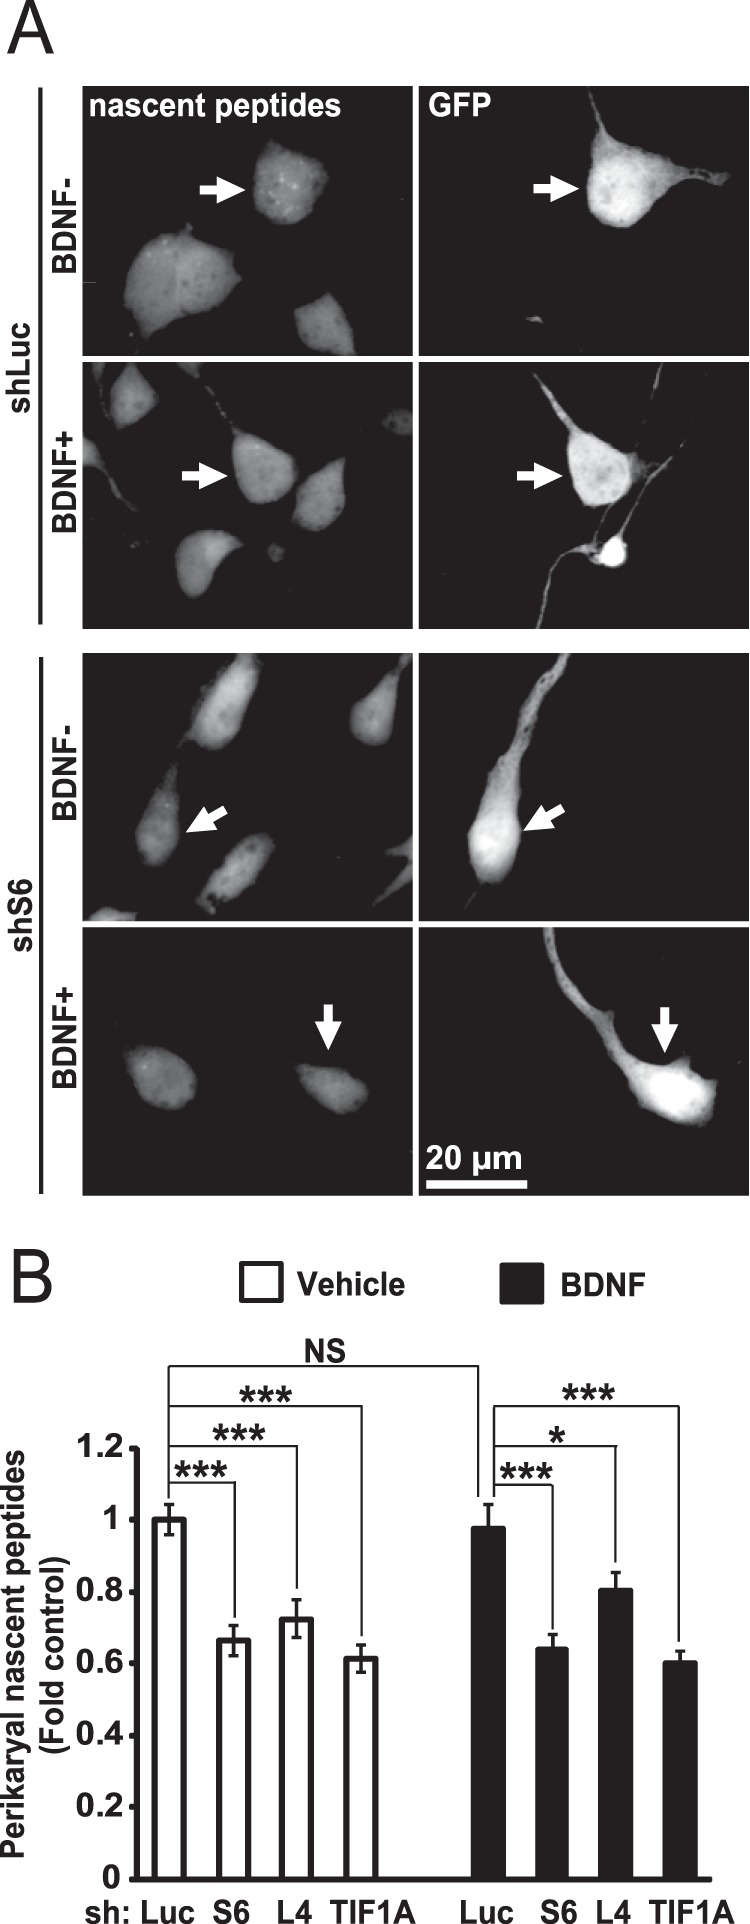
As in cultured rat forebrain neurons, 65% of ribosomes are engaged in polysomes, and one could expect that ribosome depletion will impair neuronal translation (48). Indeed, in neurons that were transfected with shRNAs against S6 or S14, average perikaryal density of the nascent peptide signal declined at least 30% as compared with control shRNA-receiving cells (Fig. 7, A and B). BDNF was unable to rescue such a protein synthesis deficiency (Fig. 7B). Surprisingly, depletion of L4 did not affect general protein synthesis. Similar differential effects were also visible when individual shRNAs against S6 or L4 were used (Table 3). In addition, depletion of L11 had relatively milder anti-translational effects as compared with S6 (Table 2). Therefore, supply of the large ribosomal subunits may be relatively less critical than that of the small ribosomal subunit for maintenance of general protein synthesis.
FIGURE 7.

Impairment of global protein synthesis after inhibition of ribosomal biogenesis. A and B, DIV6 hippocampal neurons were transfected as for Fig. 5C. After 3 days, cells were treated with 50 ng/ml BDNF. After 45 min, OPP was added followed by cell fixation 30 min later. The OPP-labeled nascent peptides were visualized with fluorescent Click-iT chemistry. A, representative images depicting nascent peptide accumulation in shLuc- and shS14-transfected neurons (arrows). B, nascent peptide accumulation in the perikarya was reduced by shS6 or shS14 but not shL4 (two-way ANOVA, effect of shRNA, F3,459 = 49.425, p < 0.01). Data represent means ± S.E. of at least 50 individual cells from three independent experiments; *, p < 0.05; ***, p < 0.001 (post hoc tests). C and D, DIV6 hippocampal neurons were transfected as for Fig. 5, D and E. After 2 days, 50 ng/ml BDNF was added for 24 h as indicated. SGs were visualized by TIA-1/TIAR immunostaining. C, representative images of shLuc and shS14-transfected neurons. In shLuc-transfected neurons TIA-1/TIAR signal is visible throughout the soma, including fine extra-nuclear granules (arrows). In shS14-transfected cells, the diffuse signal is reduced, and large granules appear in the perikaryal region and proximal dendrites (arrowheads) consistent with SG morphology. C′, well established inducer of SGs, sodium arsenite (0.5 mm), was added to neuronal cultures for 1 h. Note similarity of arsenite-induced SGs to those produced after depletion of S14 (arrowheads). D, fraction of SG-positive cells increased when ribosomal biogenesis was inhibited by knockdowns of RPs or TIF1A. Such a response was also present in BDNF-treated neurons. NS, not significant. Data represent means ± S.E. of three independent experiments; ***, p < 0.001, U test.
TABLE 3.
Effects of individual shRNAs on perikaryal nascent protein synthesis
| shRNA | Treatment |
|
|---|---|---|
| Vehicle | BDNF | |
| Luc | 1 ± 0.04a,b | 1.098 ± 0.04a,b |
| S6–1 | 0.567 ± 0.033c | 0.509 ± 0.029c |
| S6–2 | 0.587 ± 0.027c | 0.58 ± 0.026c |
| L4–1 | 0.883 ± 0.033a,b,d | 0.851 ± 0.039a,b,c |
| L4–2 | 0.923 ± 0.046a,b | 0.846 ± 0.043a,b,c |
| L11–1 | 0.949 ± 0.036a,b | 0.895 ± 0.035a,b,c |
| L11–2 | 0.81 ± 0.038a,b,c | 0.703 ± 0.052a,b,c |
a p < 0.001 as compared with shS6-1.
b p < 0.001 as compared with shS6-2.
c p < 0.001 as compared with shLuc.
d p < 0.05 as compared with shLuc.
In ribosome-depleted cells, translational inhibition could be caused by reduced recruitment of ribosomes to mRNAs. In such a case one could expect formation of RNA stress granules (SGs), which are large ribonucleoprotein complexes sequestering mRNAs away from the translation machinery (49–51). In fact, SGs were observed in ribosome biogenesis inhibited neurons as determined by immunostaining for the SG marker proteins T-cell intracellular antigen-1 and T-cell intracellular antigen-related (TIA-1/TIAR, Fig. 7, C and D). Both diffuse and fine granular TIA-1/TIAR signals were detected in the perikaryal cytosol of neurons that received control shRNA (Fig. 7C). In shS14-transfected cells, the diffuse signal was reduced, and large TIA-1/TIAR-positive granules formed in the cytosol consistent with the SG response (Fig. 7C). Indeed, the SGs in response to S14 depletion were similar to those observed after exposure to a well established SG inducer, sodium arsenite (Fig. 7C′). SGs were also observed in neurons whose ribosomal biogenesis was inhibited by shS6 or shTIF1A (Fig. 7D). Importantly, although shL4 did not affect general protein synthesis, it still induced the SG response, albeit in a smaller fraction of neurons as compared with shS6, shS14, or shTIF1A (Fig. 7D). Neither pharmacological inhibition of mTOR nor treatment with BDNF affected the SG formation in ribosome biogenesis-inhibited or control neurons (Fig. 7, C and D, and data not shown).
As the p53 pathway may be activated by impaired ribosomal biogenesis (4), one could consider the possibility that in ribosomal protein-depleted neurons, translational inhibition may be a consequence of p53 activation. However, overexpression of the dominant-negative mutant form of p53 affected neither translational inhibition nor SG formation in ribosome-depleted neurons (data not shown). In our hands, the dominant-negative p53 construct that was used for these studies potently blocked p53-dependent neuronal apoptosis, including that in response to nucleolar stress (19, 52). Therefore, in neurons, ribosome biogenesis defects result in impairment of protein synthesis that is likely due to insufficient ribosome supply and consequent reduction in ribosome recruitment to at least some mRNAs. Moreover, BDNF fails to rescue such a deficit despite its stimulatory effects on pro-translational signaling pathways, including mTOR and ERK1/2.
Inhibition of Ribosome Production Impairs BDNF-induced Enhancement of Dendritic Morphogenesis and Triggers Dendritic Degeneration
BDNF-stimulated development of dendrites was analyzed after RP knockdowns. Neurites of the shRNA-transfected cells were identified by expression of the co-transfected GFP. Dendrites were identified as neurites with decreasing width (Fig. 8, A and B). Axons were defined as very long and evenly wide processes that occurred once per cell (Fig. 8A). Accuracy of neurite type identification was confirmed using the overexpressed axonal marker Kif5C560-dTomato (data not shown). Dendrites were traced, and their total length, territory of the dendritic tree, number of primary dendrites, and dendritic branching were determined (Fig. 8, C–F). In addition, the overall complexity of the dendritic trees was evaluated using Sholl analysis (Fig. 8, G–J).
FIGURE 8.

Disruption of BDNF-stimulated dendritic outgrowth by inhibition of ribosomal biogenesis. DIV6 hippocampal neurons were co-transfected with expression plasmids for EGFP and shRNAs against RPs or a control shRNA (shLuc, 0.075 + 0.4 μg of plasmid DNAs/2·105 neurons, respectively). On DIV8, half of the cultures were treated with 50 ng/ml BDNF for 24 h. Transfected neurons were visualized by GFP immunostaining. A and B, representative images of transfected neurons. A, for morphometric analysis only neurites with dendritic characteristics were selected (e.g. decreasing diameter, typically more than one dendrite present per cell, arrows). Conversely, axon-like neurites were excluded (uniform diameter, a single axon present per cell, arrowheads). C–H, BDNF-stimulated dendritic growth was abolished or reduced by RP knockdowns, including total dendritic length (C, two-way ANOVA, effects of BDNF or shRNA or their interaction, F1,399 = 13.285 or 19.288 or 6.466, respectively; p < 0.001), dendritic territory (D, two-way ANOVA, effects of BDNF or shRNA or their interaction, F1,399 = 0.783/p > 0.05 or 8.267/p < 0.001 or 2.804/p < 0.05, respectively), and number of primary dendrites (E, two-way ANOVA, effects of BDNF or shRNA or their interaction, F1,399 = 4.305/p < 0.05 or 0.235/p > 0.05 or 2.811/p < 0.05, respectively), as well as overall complexity of the dendritic tree as revealed by Sholl analysis (G and H). Although branching was not significantly enhanced by BDNF, it was consistently reduced by shRPs (F, two-way ANOVA, effects of BDNF or shRNA, F1,399 = 0.033/p > 0.05/or 12.8/p < 0.05, respectively). I and J, reduced dendritic complexity after knocking down RPs using individual shRNAs. Data are means ± S.E. of at least 44 (C–H) or 30 (I and J) randomly selected individual neurons/condition from three (C–H) or two (I and J) independent experiments; *, p < 0.05; ***, p < 0.001; NS (not significant), p > 0.05 (post hoc tests); in G–J, p values for the shRP effects on number of crossings are indicated (repeated measure one-way ANOVA, shLuc versus shRP).
In the absence of BDNF, knocking down ribosomal proteins had relatively moderate and shRNA-specific effects on dendritic trees. For instance, significant reductions of the dendritic length were observed with shS6 and shS14 but not shL4; dendritic territory was reduced only by shS6; none of the shRPs affected branching (Fig. 8, D and F, and Table 4). Conversely, all shRPs simplified dendritic trees as revealed by Sholl analysis (number of crossings for shLuc versus shS6 or shS14 or shL4, p < 0.001, ANOVA, Fig. 8G).
TABLE 4.
Effects of shRNAs on BDNF-induced dendrite growth
The results of post hoc comparisons forexperimental data are from Fig. 8, C–H. The abbreviations used are as follows: TL, total dendrite length; DT, dendritic territory; PD, number of primary dendrites; DB, dendrite branching; NS, p > 0.05; *, p < 0.05; **, p < 0.01; ***, p < 0.001 (Fisher's LSD test).

Ribosome depletion had profound effects on BDNF-mediated enhancement of dendritic growth. In control shRNA-transfected neurons, BDNF stimulated dendritic growth as illustrated by increases in total dendritic length (908 versus 678 μm, p < 0.001), dendritic territory (51,760 versus 42,815 μm2, p < 0.05), and the number of primary dendrites (4.1 versus 3.4 dendrites/cell, p < 0.05, Fig. 8, C–E, Table 4). In addition, Sholl analysis revealed a highly significant increase in dendritic tree complexity (number of crossings in shLuc-transfected neurons, −BDNF versus +BDNF; p < 0.0001, ANOVA, Fig. 8, G and H). After knocking down RPs, all but one of these morphogenic responses to BDNF were blocked or reduced (Fig. 8 and Table 4). The single outlier was the increase in the number of primary dendrites in shS14-transfected neurons (Fig. 8E). Finally, in BDNF-stimulated neurons, dendritic branching was inhibited by RP knockdowns (Fig. 8F). Similar anti-morphogenic effects of RP depletion were also present when individual shRNAs against S6, L4, or L11 were used or when the p53 pathway was inhibited by co-transfection of the dominant-negative mutant form of p53 (Fig. 8, I and J, and data not shown). These findings indicate that during neuronal maturation ribosome depletion inhibits dendritic morphogenesis in response to BDNF.
To determine whether ongoing ribosome synthesis is required for dendritic maintenance, S6 or S14 was knocked down in mature neurons (e.g. DIV13–16). That time point of differentiation was chosen based on previous observations of relative morphological as well as molecular maturity of rat hippocampal cultures after 2 weeks in vitro (53, 54). Because in our hands neuronal transfections after DIV6–7 produced high toxicity, we bypassed this limitation by using tetracycline-inducible shRNAs (tshRNAs) that were transfected at DIV6. When neurons were co-transfected with expression plasmids for the FLAG-tagged S6, the tetracycline-regulated silencer tTS, and the tshS6 or tshLuc (control), the number of FLAG-positive cells was similar for either tshRNA as long as doxycycline was absent from culture media (Fig. 9A). Conversely, tshS6 but not tshLuc reduced the number of FLAG-positive neurons after doxycycline treatment (Fig. 9A). These data confirm the ability of tshRNAs to inducibly knock down neuronal expression of their target genes as demonstrated previously using a similar expression system (31).
FIGURE 9.

Inhibition of ribosomal biogenesis affects morphology of established dendritic trees. A, validation of the tetracycline-inducible variant of shS6 (tshS6). DIV6 neurons were transfected with expression plasmids for EGFP, S6-FLAG, and the tetracycline-regulated silencer tTS together with tshS6 or tshLuc (0.075 + 0.1 + 0.8 + 0.2 μg of plasmid DNAs/2·105 neurons, respectively). After 7 days, cells were treated with doxycycline as indicated for 72 h. Fraction of transfected (e.g. GFP-positive cells) that were also showing positive immunostaining for S6-FLAG was reduced by doxycycline. Similar trends were observed in two independent experiments. B–I, neurons were transfected as in A except omission of S6-FLAG; H and I, the EGFP expression vector was replaced with RFP. Doxycycline was added at DIV13 when dendrites are well established and dendritic growth is expected to be relatively slow. At DIV16, dendritic morphology or SG formation was evaluated in GFP-immunostained or RFP-positive neurons, respectively. B, representative images of transfected neurons that were immunostained for GFP. C–G, knockdowns of RPs reduced total dendritic length (C, one-way ANOVA, F2,202 = 10.1, p < 0.001), dendritic territory (D, one-way ANOVA, F2,202 = 9.05, p < 0.001), and overall complexity of the dendritic trees as revealed by Sholl analysis (G). Data are means ± S.E. of at least 44 randomly selected individual neurons/condition from three independent experiments; **, p < 0.01; ***, p < 0.001; NS (not significant), p > 0.05 (post hoc tests); G, p values for the shRP effects on number of crossings are indicated (repeated measure one-way ANOVA, shLuc versus shRP). H and I, presence of SGs after inducible inhibition of ribosomal biogenesis suggests translational deficits. H, representative images of transfected neurons that were immunostained for the SG marker TIA-1/TIAR (arrows). After inducible knockdown of S14, SGs were present in the perikaryon (arrowheads). I, quantification of the SG response. Data are averages ± S.E. from three independent experiments; *, p < 0.05, U test.
At DIV6, hippocampal neurons were transfected with the EGFP expression plasmid and tshRNAs. Then at DIV13 tetracycline was added to the media, and dendritic morphology was evaluated at DIV16 (Fig. 9, B–G). Total dendritic length and dendritic territory but not the number of primary dendrites were reduced after inducible knockdowns of S6 or S14 (Fig. 9, C–E). Decreased dendritic branching was observed with tshRPS6 but not tshS14 (Fig. 9F). Sholl analysis revealed diminished dendritic tree complexity with either tshRNA (Fig. 9G). Such anti-dendritic effects were associated with impaired translation as indicated by increased fraction of SG-positive neurons (Fig. 9, H and I). Although in DIV13–16 hippocampal neuron dendritic growth is still possible, it is slower than at DIV6–9 (53, 55). However, at DIV13–16, anti-dendritic effects were at least as strong as at DIV6–9 (Fig. 8 and Table 4). Therefore, compromised dendritic maintenance was a likely contributor to anti-dendritic effects of RP depletion in mature neurons.
Given the anti-dendritic effects of ribosomal protein depletion, one could expect that axonal growth and/or maintenance would be similarly reduced after inhibition of ribosomal biogenesis. However, in rat hippocampal neurons, at least early phases of axonal growth (i.e. between DIV1 and DIV4) were differentially affected by knockdowns of S6, L4, or TIF1A. Under basal conditions, shS6 but not other shRNAs reduced total axonal length (Fig. 10). Although in sLuc-transfected neurons no effects of BDNF were observed on axonal length, BDNF rescued the phenotype of shS6 and increased total length in shL4-transfected cells (Fig. 10, B–D). One can speculate that the appearance of such pro-axonal effects of BDNF may be related to enhanced activation of growth-promoting signaling pathways and/or greater neuronal responsiveness to such activations. Despite strong effects on dendritic development (22), shTIF1A had no significant effects on axonal length with or without BDNF (Fig. 10, F and G). Therefore, although individual RPs, including S6, may be required for axonal development, ribosomal biogenesis per se appears to be dispensable, at least, for the early stages of axonal growth.
FIGURE 10.
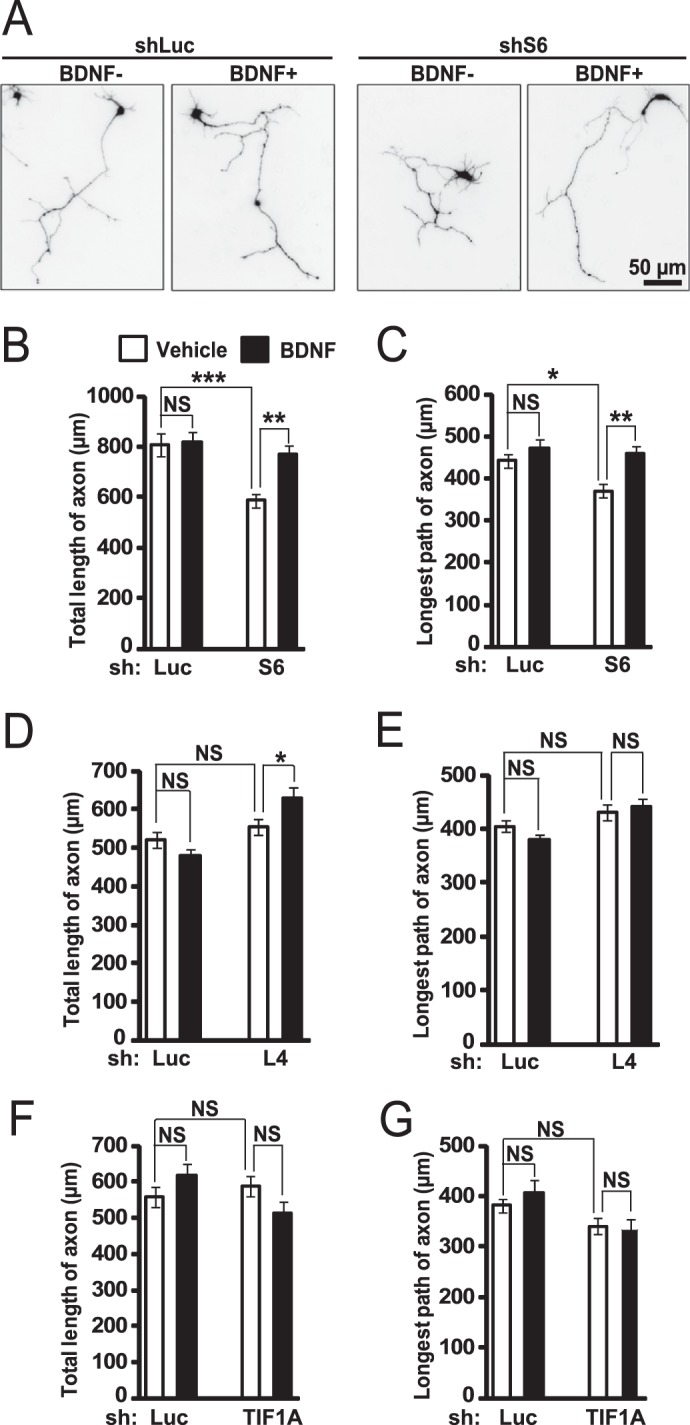
Inhibition of ribosomal biogenesis has moderate effects on initial stages of axonal growth. DIV1 hippocampal neurons that were seeded on poly-d-lysine-coated plastic coverslips (no laminin coating) were co-transfected with expression plasmids for EGFP and shRNAs against S6 (shS6), L4 (shL4), TIF1A (shTIF1A), or Renilla luciferase (shLuc; 0.075 + 0.4 μg of plasmid DNAs/2·105 neurons, respectively). On DIV2, 10 ng/ml BDNF was added for 24 h as indicated. Transfected neurons were visualized by GFP immunostaining. A, representative images of transfected neurons. B–G, depletion of S6 reduced total length of axon (B) and length of the longest axon (C, two-way ANOVA, effect of shS6, F1,154 = 13.357/p < 0.001 and 5.827/p < 0.05, respectively). However, BDNF rescued these defects (two-way ANOVA, effect of BDNF, F1,154 = 7.175/p < 0.01 and 12.342/p < 0.001, respectively). Depletion of L4 or TIF1A had no significant effects on axonal growth except increased total axonal length in shL4-transfected neurons that were stimulated with BDNF (D–G). In experiments with shTIF1A, nucleolar disruption was verified by immunostaining for nucleophosmin/B23 as shown in Fig. 5C. Only neurons with nucleolar disruption were selected for the morphometric analysis. The axonal morphogenesis experiments did not include shS14 due to its apparent toxicity when transfected at DIV1 (data nor shown). Data represent means ± S.E. of at least 30 individual cells from two independent experiments; ***, p < 0.001; **, p < 0.01; *, p < 0.05; NS (not significant), p > 0.05 (post hoc tests).
As dendritic morphogenesis was studied at DIV6–16, one can speculate that at early stages of neuronal differentiation, ribosome biogenesis is relatively unimportant for neurite outgrowth while gaining significance during neuronal maturation. Such a switch may be a reflection of a growing demand for ribosomes as neurons expand their size and scale up protein synthesis. However, anti-translational effects of ribosomal biogenesis inhibition were at least as strong at DIV4 as at DIV9 (Figs. 7B and 11). Interestingly, a notable difference was a significant anti-translational effect of shL4 at DIV4 but not DIV9 indicating that supply of the large ribosomal subunit may be a limiting factor for general protein synthesis at the early stages of neuronal maturation. Therefore, at least early axonal development appears to be more tolerant of partial deficiency in protein synthesis than dendritic morphogenesis.
FIGURE 11.
At DIV4, inhibition of ribosomal biogenesis affects global protein synthesis. A and B, DIV1 hippocampal neurons were transfected as described for Fig. 10. On DIV4, cells were treated with 50 ng/ml BDNF for 45 min as indicated. Then OPP was added for an additional 30 min followed by fixation and visualization of nascent peptides as in Fig. 7, A and B. A, representative images of transfected neurons (arrows). B, in shS6-, shL4-, or shTIF1A-transfected cells, nascent peptide accumulation was significantly decreased. BDNF was unable to rescue such a deficit. Data represent means ± S.E. of at least 49 individual cells from three independent experiments; two-way ANOVA, effect of shRNA, F3,415 = 26.752, p < 0.001; post hoc tests: ***, p < 0.001; *, p < 0.05; NS, p > 0.05.
Discussion
The presented data revealed that during the maturation phase of neuronal development, neuronal ribosome content kept increasing despite lower activity of ribosomal biogenesis. Interference with the ribosome supply lowered global protein synthesis and/or induced SGs suggesting defective recruitment of ribosomes to at least some mRNAs during their translation initiation. Such a translational deficiency was accompanied by disruption of dendritic morphogenesis in response to exogenous BDNF and diminished dendritic maintenance under basal conditions. Thus, one could propose that in maturing neurons, ribosomal biogenesis is necessary to provide a sufficient number of ribosomes to support translation of critical mediators of dendritic development (Fig. 12A). Conversely, when ribosomal biogenesis is inhibited, an insufficient supply of ribosomes decreases translation initiation resulting in SG formation, reduced synthesis of pro-dendritic proteins, impairment of dendritic growth, and dendritic degeneration (Fig. 12B).
FIGURE 12.

Hypothetical model of the role that ribosomal biogenesis plays in dendritic growth and maintenance. A, under normal conditions, neuronal maturation is associated with a relatively rapid expansion of ribosomes. Robust ribosome supply supports protein synthesis that is needed for the dendritic growth response to BDNF and dendritic maintenance. B, when ribosomal biogenesis is reduced, ribosome shortage impairs translation initiation resulting in formation of SGs and diminished protein synthesis. Such defects may be relatively selective for mRNAs whose translation requires optimal translation initiation rates to support synthesis of necessary pro-dendritic proteins. In consequence, dendritic growth and maintenance are impaired. Thus, ribosomal biogenesis is critical for maturation of post-mitotic neurons, and its impairment may contribute to disruption of neuronal connectivity in neurodevelopmental and/or neurodegenerative diseases that affect production of ribosomes (see text for more details).
The presented results reveal an apparent paradox that in maturing neurons intense expansion of ribosomes is accompanied by sharp down-regulation of ribosomal biogenesis. As high activity of ribosomal biogenesis is required for cell proliferation, it is likely that in the embryonic brain ribosome synthesis is up-regulated to support neurogenesis (1). However, because of cell divisions, average cellular ribosome content is not expected to change. After cell cycle exit, ribosome content may increase despite down-regulation of ribosome biogenesis as long as its rate exceeds that of ribosome turnover. Indeed, postmitotic neurons continue to produce ribosomes (56). In addition, in the brain, ribosome turnover rate is low with an estimated ribosome half-life time of 7 days (57, 58). Therefore, maturing neurons may accumulate a large number of ribosomes despite a slower rate of ribosomal synthesis.
In cultured hippocampal neurons, the average daily increase of ribosome content was estimated at 23%. However, the rate of ribosome expansion was uneven with only a 4.8% increase/day in a period between DIV6 and DIV10. In contrast, during that time RP depletion reduced ribosome content by 20–30%. Therefore, it is possible that the rate of ribosomal biogenesis and/or rate of ribosome turnover is modulated during neuronal maturation accounting for the changing dynamics of ribosome accumulation.
Why do maturing neurons need so many ribosomes? The most obvious answer to that question could be that a high number of ribosomes is required to support intense protein synthesis that is needed for neuritic morphogenesis. Indeed, our observations suggest that during maturation of the neuronal culture the expansion of the ribosome pool is accompanied by growing global protein synthesis. These observations are in agreement with results of polysome profiling as well as metabolic labeling studies suggesting that general protein synthesis keeps increasing during the postnatal period of rat brain development reaching a peak at weaning (59, 60). Our data also suggest that when ribosome supply is diminished the protein synthesis is impaired. Such findings fit well with a report that in cultured rat cortical neurons, 65, 25, and 10% of ribosomes are in the polysomes, the free ribosome pool, and the RNA granules, respectively (48). Therefore, during neuronal maturation, availability of free ribosomes may be a limiting factor for synthesis of pro-morphogenic proteins.
Reduced ribosomal biogenesis disrupted BDNF-induced dendritic growth. Gene expression, including protein synthesis, plays a well established role in neurotrophin-mediated neurite outgrowth (26, 46, 47, 61, 62). Moreover, inhibition of ribosomal biogenesis did not prevent activation of pro-dendritic signaling responses to BDNF but compromised translation regardless of the presence of BDNF. Hence, ongoing production of neuronal ribosomes may contribute to dendritic morphogenesis by supplying a sufficient number of ribosomes to execute the translational phase of the pro-dendritic gene expression program that is turned on by such stimuli as BDNF.
Translational deficiency may also have caused dendritic degeneration that was observed after inhibition of ribosomal biogenesis. Such a notion is supported by importance of protein synthesis for neuritic maintenance as well as correlations between reduced protein synthesis and dendritic degeneration in neurodegenerative diseases (63–66).
The presented data reveal that disruption of ribosome supply by knockdowns of various RPs produces similar anti-dendritic effects with variable impairment of general protein synthesis. Specifically, depleting RPs of the large ribosomal subunit (RPL) had lesser effects on general protein synthesis than depleting RPs of the small ribosomal subunit (RPS). In contrast, in both cases SG induction was observed suggesting that translation of at least some mRNAs is inhibited by RPL deficiency. Interestingly, mRNAs that are related to transcriptional regulation, neurite outgrowth, and synaptic transmission appear enriched in SGs (67). Hence, an intriguing possibility emerges that in maturing neurons an uninterrupted supply of ribosomes is of particular importance for translation of a subset of mRNAs that support dendritic morphogenesis.
Mechanistically, such selectivity could be a consequence of the rate-limiting role of ribosome recruitment for translation initiation of these mRNAs. Interestingly, in Diamond Blackfan anemia, which is caused by heterozygous loss of function mutations of several RPSs and RPLs, bone marrow failure has been proposed to be a consequence of a selective translational deficit of the pro-erythrocytic transcription factor GATA1 (68). In that case, a highly structured 5′UTR of GATA1 mRNA makes its translation uniquely sensitive to ribosome shortage. Hence, similar dependence on abundance of ribosomes may characterize translation of at least some proteins with critical contributions to dendritic morphogenesis. Finally, there is emerging evidence of ribosome specialization. For instance, specific subtypes of ribosomes play a critical role in translation of homeobox transcription factors during body pattern formation or internal ribosome entry site-driven translation in cancer (69). Therefore, one should consider the possibility that translation of pro-dendritic proteins is carried out by a specialized subtype(s) of ribosomes that are produced during neuronal maturation.
The presented findings suggest that the impairments of ribosome synthesis that were reported in neurodevelopmental diseases may be pathogenic by inducing translational deficits, diminishing dendritic morphogenesis, and/or inducing dendritic degeneration. In support of such a hypothesis, ribosomal deficits, translational defects, and impaired neuritic morphogenesis were reported in a human neuronal cell culture model of Rett syndrome (70). All these effects have been proposed as consequences of a general transcriptional failure. Hence, ribosome depletion would create a feed-forward mechanism enhancing defects in protein expression.
In Rett syndrome, general transcriptional inhibition is due to deficits in an abundant transcriptional activator, MeCP2 (70). Reduced brain growth and mental retardation are also found in Roberts and Cornelia DeLange syndromes that are caused by deficits in chromatin structure proteins that regulate sister chromatid cohesion (18). As in the case of MeCP2 deficiency, these mutations are proposed to disrupt transcription, including rRNA production (71, 72). Indeed, ribosomal deficits were reported in non-neuronal cell culture models of these conditions (71, 72). Therefore, the pathological sequel triggered by neuronal ribosome deficiency may underlie the neurological phenotype not only in Rett syndrome but also in cohesinopathies. Finally, the presented finding suggests that disruption of dendritic morphogenesis may contribute to the pathogenesis of ribosomopathies with neurological involvement, including Bowen-Conradi and RPL10 syndromes (14, 15). Future studies are needed to validate the novel concept that reduced ribosomal biogenesis and subsequent impairment of neurites play a role in the pathogenesis of these and other neurodevelopmental diseases.
Recently, the appearance of aberrant SGs at the early stages of ALS/FTLD and Alzheimer disease led to proposals that the SG-mediated disruption of mRNA metabolism and/or functional loss of SG-sequestered proteins may be key culprits triggering neuritic degeneration (73, 74). Although in some familiar cases of ALS/FTLD, SG formation is due to mutations in RNA-binding proteins, and it is unclear what are the alternative triggers and/or modulators of such pathology. Our findings suggest that ribosome depletion is a novel inducer of the SG response. Therefore, it is tempting to speculate that it may facilitate aberrant SG formation by mutant RNA-binding proteins such as TDP43 or FUS or EWS. In addition, ribosomal deficits could enhance and/or initiate SG formation in those cases of ALS/FTLD, in which the SG-regulating proteins are normal.
Taken together, during maturation of postmitotic neurons, the cellular ribosome content increases. Interference with ribosome supply triggers translational defects and disrupts dendritic growth and maintenance. Consequently, reduced ribosomal biogenesis may contribute to neurodevelopmental diseases by disturbing neuronal connectivity. Moreover, consequences of ribosome depletion overlap with key features of major neurodegenerative diseases suggesting that loss of ribosomal homeostasis plays a pathogenic role in at least some forms of neurodegeneration.
Author Contributions
L. P. S. and M. H. designed the study, analyzed the results, and wrote the paper; L. P. S., M. P., A. V., J. J., N. L., S. E., E. P., D. M., J. H., and B. E. M. performed experiments and analyzed the data. All authors reviewed the results and approved the final version of the manuscript.
Acknowledgments
We thank Jing-Juan Zheng for excellent technical assistance and Drs. Steven Ellis and Jacek Jaworski for critical reading of the manuscript.
This work was supported by National Institutes of Health Grants NS073584 and 8P30GM103507 (to M. H.), National Science Foundation Grant IOS1021860 (to M. H.), the Commonwealth of Kentucky Challenge for Excellence Fund (to M. H.), and the summer undergraduate research fellowships of the Kentucky Biomedical Research Infrastructure Network (to S. E., B. E. M., and D. M.). The authors declare that they have no conflicts of interest with the contents of this article. The content is solely the responsibility of the authors and does not necessarily represent the official views of the National Institutes of Health.
L. P. Slomnicki and M. Hetman, unpublished observations.
- pol 1
- RNA-polymerase 1
- ALS
- amyotrophic lateral sclerosis
- BDNF
- brain-derived neurotrophic factor
- DIV
- day in vitro
- E
- embryonic day
- FI
- fluorescence intensity
- FTLD
- fronto-temporal lobe dementia
- ITS1
- internal transcribed spacer-1
- OPP
- O-propargyl-puromycin
- P
- postnatal day
- RFP
- red fluorescent protein
- RP
- ribosomal protein
- SG
- stress granule
- TIA-1
- T-cell intracellular antigen-1
- TIAR
- T-cell intracellular antigen-related
- TIF1A
- transcription initiation factor 1A
- tshRNA
- tetracycline-inducible shRNA
- ANOVA
- analysis of variance
- EGFP
- enhanced GFP
- mTOR
- mechanistic target of rapamycin
- CRE
- cAMP-response element.
References
- 1. Drygin D., Rice W. G., and Grummt I. (2010) The RNA polymerase I transcription machinery: an emerging target for the treatment of cancer. Annu. Rev. Pharmacol. Toxicol. 50, 131–156 [DOI] [PubMed] [Google Scholar]
- 2. Boulon S., Westman B. J., Hutten S., Boisvert F. M., and Lamond A. I. (2010) The nucleolus under stress. Mol. Cell 40, 216–227 [DOI] [PMC free article] [PubMed] [Google Scholar]
- 3. Henras A. K., Soudet J., Gérus M., Lebaron S., Caizergues-Ferrer M., Mougin A., and Henry Y. (2008) The post-transcriptional steps of eukaryotic ribosome biogenesis. Cell. Mol. Life Sci. 65, 2334–2359 [DOI] [PMC free article] [PubMed] [Google Scholar]
- 4. Fumagalli S., Di Cara A., Neb-Gulati A., Natt F., Schwemberger S., Hall J., Babcock G. F., Bernardi R., Pandolfi P. P., and Thomas G. (2009) Absence of nucleolar disruption after impairment of 40S ribosome biogenesis reveals an rpL11-translation-dependent mechanism of p53 induction. Nat. Cell Biol. 11, 501–508 [DOI] [PMC free article] [PubMed] [Google Scholar]
- 5. Honda K., Smith M. A., Zhu X., Baus D., Merrick W. C., Tartakoff A. M., Hattier T., Harris P. L., Siedlak S. L., Fujioka H., Liu Q., Moreira P. I., Miller F. P., Nunomura A., Shimohama S., and Perry G. (2005) Ribosomal RNA in Alzheimer disease is oxidized by bound redox-active iron. J. Biol. Chem. 280, 20978–20986 [DOI] [PubMed] [Google Scholar]
- 6. Ding Q., Markesbery W. R., Chen Q., Li F., and Keller J. N. (2005) Ribosome dysfunction is an early event in Alzheimer's disease. J. Neurosci. 25, 9171–9175 [DOI] [PMC free article] [PubMed] [Google Scholar]
- 7. Rieker C., Engblom D., Kreiner G., Domanskyi A., Schober A., Stotz S., Neumann M., Yuan X., Grummt I., Schütz G., and Parlato R. (2011) Nucleolar disruption in dopaminergic neurons leads to oxidative damage and Parkinsonism through repression of mammalian target of rapamycin signaling. J. Neurosci. 31, 453–460 [DOI] [PMC free article] [PubMed] [Google Scholar]
- 8. Vilotti S., Codrich M., Dal Ferro M., Pinto M., Ferrer I., Collavin L., Gustincich S., and Zucchelli S. (2012) Parkinson's disease DJ-1 L166P alters rRNA biogenesis by exclusion of TTRAP from the nucleolus and sequestration into cytoplasmic aggregates via TRAF6. PLoS ONE 7, e35051. [DOI] [PMC free article] [PubMed] [Google Scholar]
- 9. Kang H., and Shin J. H. (2015) Repression of rRNA transcription by PARIS contributes to Parkinson's disease. Neurobiol. Dis. 73, 220–228 [DOI] [PubMed] [Google Scholar]
- 10. Lee J., Hwang Y. J., Boo J. H., Han D., Kwon O. K., Todorova K., Kowall N. W., Kim Y., and Ryu H. (2011) Dysregulation of upstream binding factor-1 acetylation at K352 is linked to impaired ribosomal DNA transcription in Huntington's disease. Cell Death Differ. 18, 1726–1735 [DOI] [PMC free article] [PubMed] [Google Scholar]
- 11. Tsoi H., and Chan H. Y. (2013) Expression of expanded CAG transcripts triggers nucleolar stress in Huntington's disease. Cerebellum 12, 310–312 [DOI] [PubMed] [Google Scholar]
- 12. Haeusler A. R., Donnelly C. J., Periz G., Simko E. A., Shaw P. G., Kim M. S., Maragakis N. J., Troncoso J. C., Pandey A., Sattler R., Rothstein J. D., and Wang J. (2014) C9orf72 nucleotide repeat structures initiate molecular cascades of disease. Nature 507, 195–200 [DOI] [PMC free article] [PubMed] [Google Scholar]
- 13. Kwon I., Xiang S., Kato M., Wu L., Theodoropoulos P., Wang T., Kim J., Yun J., Xie Y., and McKnight S. L. (2014) Poly-dipeptides encoded by the C9orf72 repeats bind nucleoli, impede RNA biogenesis, and kill cells. Science 345, 1139–1145 [DOI] [PMC free article] [PubMed] [Google Scholar]
- 14. Armistead J., Khatkar S., Meyer B., Mark B. L., Patel N., Coghlan G., Lamont R. E., Liu S., Wiechert J., Cattini P. A., Koetter P., Wrogemann K., Greenberg C. R., Entian K. D., Zelinski T., and Triggs-Raine B. (2009) Mutation of a gene essential for ribosome biogenesis, EMG1, causes Bowen-Conradi syndrome. Am. J. Hum. Genet. 84, 728–739 [DOI] [PMC free article] [PubMed] [Google Scholar]
- 15. Brooks S. S., Wall A. L., Golzio C., Reid D. W., Kondyles A., Willer J. R., Botti C., Nicchitta C. V., Katsanis N., and Davis E. E. (2014) A novel ribosomopathy caused by dysfunction of RPL10 disrupts neurodevelopment and causes X-linked microcephaly in humans. Genetics 198, 723–733 [DOI] [PMC free article] [PubMed] [Google Scholar]
- 16. Singleton M. K., Gonzales M. L., Leung K. N., Yasui D. H., Schroeder D. I., Dunaway K., and LaSalle J. M. (2011) MeCP2 is required for global heterochromatic and nucleolar changes during activity-dependent neuronal maturation. Neurobiol. Dis. 43, 190–200 [DOI] [PMC free article] [PubMed] [Google Scholar]
- 17. Leung K. N., Vallero R. O., DuBose A. J., Resnick J. L., and LaSalle J. M. (2009) Imprinting regulates mammalian snoRNA-encoding chromatin decondensation and neuronal nucleolar size. Hum. Mol. Gen. 18, 4227–4238 [DOI] [PMC free article] [PubMed] [Google Scholar]
- 18. Bose T., and Gerton J. L. (2010) Cohesinopathies, gene expression, and chromatin organization. J. Cell Biol. 189, 201–210 [DOI] [PMC free article] [PubMed] [Google Scholar]
- 19. Kalita K., Makonchuk D., Gomes C., Zheng J. J., and Hetman M. (2008) Inhibition of nucleolar transcription as a trigger for neuronal apoptosis. J. Neurochem. 105, 2286–2299 [DOI] [PMC free article] [PubMed] [Google Scholar]
- 20. Parlato R., Kreiner G., Erdmann G., Rieker C., Stotz S., Savenkova E., Berger S., Grummt I., and Schütz G. (2008) Activation of an endogenous suicide response after perturbation of rRNA synthesis leads to neurodegeneration in mice. J. Neurosci. 28, 12759–12764 [DOI] [PMC free article] [PubMed] [Google Scholar]
- 21. Kreiner G., Bierhoff H., Armentano M., Rodriguez-Parkitna J., Sowodniok K., Naranjo J. R., Bonfanti L., Liss B., Schütz G., Grummt I., and Parlato R. (2013) A neuroprotective phase precedes striatal degeneration upon nucleolar stress. Cell Death Differ. 20, 1455–1464 [DOI] [PMC free article] [PubMed] [Google Scholar]
- 22. Gomes C., Smith S. C., Youssef M. N., Zheng J. J., Hagg T., and Hetman M. (2011) RNA polymerase 1-driven transcription as a mediator of BDNF-induced neurite outgrowth. J. Biol. Chem. 286, 4357–4363 [DOI] [PMC free article] [PubMed] [Google Scholar]
- 23. Jones N. C., Lynn M. L., Gaudenz K., Sakai D., Aoto K., Rey J. P., Glynn E. F., Ellington L., Du C., Dixon J., Dixon M. J., and Trainor P. A. (2008) Prevention of the neurocristopathy Treacher Collins syndrome through inhibition of p53 function. Nat. Med. 14, 125–133 [DOI] [PMC free article] [PubMed] [Google Scholar]
- 24. James A., Wang Y., Raje H., Rosby R., and DiMario P. (2014) Nucleolar stress with and without p53. Nucleus 5, 402–426 [DOI] [PMC free article] [PubMed] [Google Scholar]
- 25. Lewis J. D., and Tollervey D. (2000) Like attracts like: getting RNA processing together in the nucleus. Science 288, 1385–1389 [DOI] [PubMed] [Google Scholar]
- 26. Jaworski J., Spangler S., Seeburg D. P., Hoogenraad C. C., and Sheng M. (2005) Control of dendritic arborization by the phosphoinositide-3′-kinase-Akt-mammalian target of rapamycin pathway. J. Neurosci. 25, 11300–11312 [DOI] [PMC free article] [PubMed] [Google Scholar]
- 27. Hoogenraad C. C., Feliu-Mojer M. I., Spangler S. A., Milstein A. D., Dunah A. W., Hung A. Y., and Sheng M. (2007) Liprinα1 degradation by calcium/calmodulin-dependent protein kinase II regulates LAR receptor tyrosine phosphatase distribution and dendrite development. Dev. Cell 12, 587–602 [DOI] [PubMed] [Google Scholar]
- 28. Krüger T., Zentgraf H., and Scheer U. (2007) Intranucleolar sites of ribosome biogenesis defined by the localization of early binding ribosomal proteins. J. Cell Biol. 177, 573–578 [DOI] [PMC free article] [PubMed] [Google Scholar]
- 29. Kalita K., Kharebava G., Zheng J. J., and Hetman M. (2006) Role of megakaryoblastic acute leukemia-1 in ERK1/2-dependent stimulation of serum response factor-driven transcription by BDNF or increased synaptic activity. J. Neurosci. 26, 10020–10032 [DOI] [PMC free article] [PubMed] [Google Scholar]
- 30. Jacobson C., Schnapp B., and Banker G. A. (2006) A change in the selective translocation of the kinesin-1 motor domain marks the initial specification of the axon. Neuron 49, 797–804 [DOI] [PubMed] [Google Scholar]
- 31. Hoogenraad C. C., Milstein A. D., Ethell I. M., Henkemeyer M., and Sheng M. (2005) GRIP1 controls dendrite morphogenesis by regulating EphB receptor trafficking. Nat. Neurosci. 8, 906–915 [DOI] [PubMed] [Google Scholar]
- 32. Habas A., Kharebava G., Szatmari E., and Hetman M. (2006) NMDA neuroprotection against a phosphatidylinositol-3 kinase inhibitor, LY294002, by NR2B-mediated suppression of glycogen synthase kinase-3β-induced apoptosis. J. Neurochem. 96, 335–348 [DOI] [PubMed] [Google Scholar]
- 33. Schmidt E. K., Clavarino G., Ceppi M., and Pierre P. (2009) SUnSET, a nonradioactive method to monitor protein synthesis. Nat. Methods 6, 275–277 [DOI] [PubMed] [Google Scholar]
- 34. Liu J., Xu Y., Stoleru D., and Salic A. (2012) Imaging protein synthesis in cells and tissues with an alkyne analog of puromycin. Proc. Natl. Acad. Sci. U.S.A. 109, 413–418 [DOI] [PMC free article] [PubMed] [Google Scholar]
- 35. Hetman M., Kanning K., Cavanaugh J. E., and Xia Z. (1999) Neuroprotection by brain-derived neurotrophic factor is mediated by extracellular-signal-regulated kinase and phosphatidylinositol 3-kinase. J. Biol. Chem. 274, 22569–22580 [DOI] [PubMed] [Google Scholar]
- 36. McDonald K. K., Aulas A., Destroismaisons L., Pickles S., Beleac E., Camu W., Rouleau G. A., and Vande Velde C. (2011) TAR DNA-binding protein 43 (TDP-43) regulates stress granule dynamics via differential regulation of G3BP and TIA-1. Hum. Mol. Genet. 20, 1400–1410 [DOI] [PubMed] [Google Scholar]
- 37. Wearne S. L., Rodriguez A., Ehlenberger D. B., Rocher A. B., Henderson S. C., and Hof P. R. (2005) New techniques for imaging, digitization and analysis of three-dimensional neural morphology on multiple scales. Neuroscience 136, 661–680 [DOI] [PubMed] [Google Scholar]
- 38. Knoepfler P. S., Cheng P. F., and Eisenman R. N. (2002) N-myc is essential during neurogenesis for the rapid expansion of progenitor cell populations and the inhibition of neuronal differentiation. Genes Dev. 16, 2699–2712 [DOI] [PMC free article] [PubMed] [Google Scholar]
- 39. Boon K., Caron H. N., van Asperen R., Valentijn L., Hermus M. C., van Sluis P., Roobeek I., Weis I., Voûte P. A., Schwab M., and Versteeg R. (2001) N-myc enhances the expression of a large set of genes functioning in ribosome biogenesis and protein synthesis. EMBO J. 20, 1383–1393 [DOI] [PMC free article] [PubMed] [Google Scholar]
- 40. Bayer S. A., and Altman J. (1987) Directions in neurogenetic gradients and patterns of anatomical connections in the telencephalon. Prog. Neurobiol. 29, 57–106 [DOI] [PubMed] [Google Scholar]
- 41. Neumüller R. A., Gross T., Samsonova A. A., Vinayagam A., Buckner M., Founk K., Hu Y., Sharifpoor S., Rosebrock A. P., Andrews B., Winston F., and Perrimon N. (2013) Conserved regulators of nucleolar size revealed by global phenotypic analyses. Sci. Signal. 6, ra70. [DOI] [PMC free article] [PubMed] [Google Scholar]
- 42. Rubbi C. P., and Milner J. (2003) Disruption of the nucleolus mediates stabilization of p53 in response to DNA damage and other stresses. EMBO J. 22, 6068–6077 [DOI] [PMC free article] [PubMed] [Google Scholar]
- 43. Wild T., Horvath P., Wyler E., Widmann B., Badertscher L., Zemp I., Kozak K., Csucs G., Lund E., and Kutay U. (2010) A protein inventory of human ribosome biogenesis reveals an essential function of exportin 5 in 60S subunit export. PLos Biol. 8, e1000522. [DOI] [PMC free article] [PubMed] [Google Scholar]
- 44. Thomas F., and Kutay U. (2003) Biogenesis and nuclear export of ribosomal subunits in higher eukaryotes depend on the CRM1 export pathway. J. Cell Sci. 116, 2409–2419 [DOI] [PubMed] [Google Scholar]
- 45. Zinzalla V., Stracka D., Oppliger W., and Hall M. N. (2011) Activation of mTORC2 by association with the ribosome. Cell 144, 757–768 [DOI] [PubMed] [Google Scholar]
- 46. Kwon M., Fernández J. R., Zegarek G. F., Lo S. B., and Firestein B. L. (2011) BDNF-promoted increases in proximal dendrites occur via CREB-dependent transcriptional regulation of cypin. J. Neurosci. 31, 9735–9745 [DOI] [PMC free article] [PubMed] [Google Scholar]
- 47. Lesiak A., Pelz C., Ando H., Zhu M., Davare M., Lambert T. J., Hansen K. F., Obrietan K., Appleyard S. M., Impey S., and Wayman G. A. (2013) A genome-wide screen of CREB occupancy identifies the RhoA inhibitors Par6C and Rnd3 as regulators of BDNF-induced synaptogenesis. PLoS ONE 8, e64658. [DOI] [PMC free article] [PubMed] [Google Scholar]
- 48. Krichevsky A. M., and Kosik K. S. (2001) Neuronal RNA granules: a link between RNA localization and stimulation-dependent translation. Neuron 32, 683–696 [DOI] [PubMed] [Google Scholar]
- 49. Anderson P., and Kedersha N. (2008) Stress granules: the Tao of RNA triage. Trends Biochem. Sci. 33, 141–150 [DOI] [PubMed] [Google Scholar]
- 50. Mazroui R., Sukarieh R., Bordeleau M. E., Kaufman R. J., Northcote P., Tanaka J., Gallouzi I., and Pelletier J. (2006) Inhibition of ribosome recruitment induces stress granule formation independently of eukaryotic initiation factor 2α phosphorylation. Mol. Biol. Cell 17, 4212–4219 [DOI] [PMC free article] [PubMed] [Google Scholar]
- 51. Mokas S., Mills J. R., Garreau C., Fournier M. J., Robert F., Arya P., Kaufman R. J., Pelletier J., and Mazroui R. (2009) Uncoupling stress granule assembly and translation initiation inhibition. Mol. Biol. Cell 20, 2673–2683 [DOI] [PMC free article] [PubMed] [Google Scholar]
- 52. Pietrzak M., Smith S. C., Geralds J. T., Hagg T., Gomes C., and Hetman M. (2011) Nucleolar disruption and apoptosis are distinct neuronal responses to etoposide-induced DNA damage. J. Neurochem. 117, 1033–1046 [DOI] [PMC free article] [PubMed] [Google Scholar]
- 53. Craig A. M., and Banker G. (1994) Neuronal polarity. Annu. Rev. Neurosci. 17, 267–310 [DOI] [PubMed] [Google Scholar]
- 54. Dabrowski M., Aerts S., Van Hummelen P., Craessaerts K., De Moor B., Annaert W., Moreau Y., and De Strooper B. (2003) Gene profiling of hippocampal neuronal culture. J. Neurochem. 85, 1279–1288 [DOI] [PubMed] [Google Scholar]
- 55. Withers G. S., Wallace C. S., Gibbs E. M., Emery I. R., and Applegate M. L. (2011) Synapses on demand require dendrites at the ready: how defining stages of dendritic development in vitro could inform studies of behaviorally driven information storage in the brain. Dev. Psychobiol. 53, 443–455 [DOI] [PubMed] [Google Scholar]
- 56. Stoykova A. S., Dabeva M. D., Dimova R. N., and Hadjiolov A. A. (1979) Ribosomal RNA precursors in neuronal and glial rat brain nuclei. J. Neurochem. 33, 931–937 [DOI] [PubMed] [Google Scholar]
- 57. Stoykova A. S., Dudov K. P., Dabeva M. D., and Hadjiolov A. A. (1983) Different rates of synthesis and turnover of ribosomal RNA in rat brain and liver. J. Neurochem. 41, 942–949 [DOI] [PubMed] [Google Scholar]
- 58. Price J. C., Guan S., Burlingame A., Prusiner S. B., and Ghaemmaghami S. (2010) Analysis of proteome dynamics in the mouse brain. Proc. Natl. Acad. Sci. U.S.A. 107, 14508–14513 [DOI] [PMC free article] [PubMed] [Google Scholar]
- 59. Yamagami S., and Mori K. (1970) Changes in polysomes of the developing rat brain. J. Neurochem. 17, 721–731 [DOI] [PubMed] [Google Scholar]
- 60. Goldspink D. F. (1988) Protein turnover and growth of the rat brain from the foetus to old age. J. Neurochem. 50, 1364–1368 [DOI] [PubMed] [Google Scholar]
- 61. Kumar V., Zhang M. X., Swank M. W., Kunz J., and Wu G. Y. (2005) Regulation of dendritic morphogenesis by Ras-PI3K-Akt-mTOR and Ras-MAPK signaling pathways. J. Neurosci. 25, 11288–11299 [DOI] [PMC free article] [PubMed] [Google Scholar]
- 62. De Rubeis S., Pasciuto E., Li K. W., Fernández E., Di Marino D., Buzzi A., Ostroff L. E., Klann E., Zwartkruis F. J., Komiyama N. H., Grant S. G., Poujol C., Choquet D., Achsel T., Posthuma D., Smit A. B., and Bagni C. (2013) CYFIP1 coordinates mRNA translation and cytoskeleton remodeling to ensure proper dendritic spine formation. Neuron 79, 1169–1182 [DOI] [PMC free article] [PubMed] [Google Scholar]
- 63. Deckwerth T. L., and Johnson E. M. Jr. (1994) Neurites can remain viable after destruction of the neuronal soma by programmed cell death (apoptosis). Dev. Biol. 165, 63–72 [DOI] [PubMed] [Google Scholar]
- 64. Shiina N., Yamaguchi K., and Tokunaga M. (2010) RNG105 deficiency impairs the dendritic localization of mRNAs for Na+/K+ ATPase subunit isoforms and leads to the degeneration of neuronal networks. J. Neurosci. 30, 12816–12830 [DOI] [PMC free article] [PubMed] [Google Scholar]
- 65. Jung H., Yoon B. C., and Holt C. E. (2012) Axonal mRNA localization and local protein synthesis in nervous system assembly, maintenance and repair. Nat. Rev. Neurosci. 13, 308–324 [DOI] [PMC free article] [PubMed] [Google Scholar]
- 66. Meyer-Luehmann M., Mielke M., Spires-Jones T. L., Stoothoff W., Jones P., Bacskai B. J., and Hyman B. T. (2009) A reporter of local dendritic translocation shows plaque- related loss of neural system function in APP-transgenic mice. J. Neurosci. 29, 12636–12640 [DOI] [PMC free article] [PubMed] [Google Scholar]
- 67. Han T. W., Kato M., Xie S., Wu L. C., Mirzaei H., Pei J., Chen M., Xie Y., Allen J., Xiao G., and McKnight S. L. (2012) Cell-free formation of RNA granules: bound RNAs identify features and components of cellular assemblies. Cell 149, 768–779 [DOI] [PubMed] [Google Scholar]
- 68. Ludwig L. S., Gazda H. T., Eng J. C., Eichhorn S. W., Thiru P., Ghazvinian R., George T. I., Gotlib J. R., Beggs A. H., Sieff C. A., Lodish H. F., Lander E. S., and Sankaran V. G. (2014) Altered translation of GATA1 in Diamond-Blackfan anemia. Nat. Med. 20, 748–753 [DOI] [PMC free article] [PubMed] [Google Scholar]
- 69. Barna M. (2013) Ribosomes take control. Proc. Natl. Acad. Sci. U.S.A. 110, 9–10 [DOI] [PMC free article] [PubMed] [Google Scholar]
- 70. Li Y., Wang H., Muffat J., Cheng A. W., Orlando D. A., Lovén J., Kwok S. M., Feldman D. A., Bateup H. S., Gao Q., Hockemeyer D., Mitalipova M., Lewis C. A., Vander Heiden M. G., Sur M., Young R. A., and Jaenisch R. (2013) Global transcriptional and translational repression in human-embryonic-stem-cell-derived Rett syndrome neurons. Cell Stem Cell 13, 446–458 [DOI] [PMC free article] [PubMed] [Google Scholar]
- 71. Xu B., Lee K. K., Zhang L., and Gerton J. L. (2013) Stimulation of mTORC1 with l-leucine rescues defects associated with Roberts syndrome. PLoS Genet. 9, e1003857. [DOI] [PMC free article] [PubMed] [Google Scholar]
- 72. Xu B., Sowa N., Cardenas M. E., and Gerton J. L. (2015) l-Leucine partially rescues translational and developmental defects associated with zebrafish models of Cornelia de Lange syndrome. Hum. Mol. Genet. 24, 1540–1555 [DOI] [PMC free article] [PubMed] [Google Scholar]
- 73. Bentmann E., Haass C., and Dormann D. (2013) Stress granules in neurodegeneration–lessons learnt from TAR DNA binding protein of 43 kDa and fused in sarcoma. FEBS J. 280, 4348–4370 [DOI] [PubMed] [Google Scholar]
- 74. Wolozin B. (2014) Physiological protein aggregation run amuck: stress granules and the genesis of neurodegenerative disease. Discov. Med. 17, 47–52 [PMC free article] [PubMed] [Google Scholar]