

Abstract
Contactin-associated protein-like 2 (CNTNAP2) encodes for CASPR2, a multidomain single transmembrane protein belonging to the neurexin superfamily that has been implicated in a broad range of human phenotypes including autism and language impairment. Using a combination of biophysical techniques, including small angle x-ray scattering, single particle electron microscopy, analytical ultracentrifugation, and bio-layer interferometry, we present novel structural and functional data that relate the architecture of the extracellular domain of CASPR2 to a previously unknown ligand, Contactin1 (CNTN1). Structurally, CASPR2 is highly glycosylated and has an overall compact architecture. Functionally, we show that CASPR2 associates with micromolar affinity with CNTN1 but, under the same conditions, it does not interact with any of the other members of the contactin family. Moreover, by using dissociated hippocampal neurons we show that microbeads loaded with CASPR2, but not with a deletion mutant, co-localize with transfected CNTN1, suggesting that CNTN1 is an endogenous ligand for CASPR2. These data provide novel insights into the structure and function of CASPR2, suggesting a complex role of CASPR2 in the nervous system.
Keywords: analytical ultracentrifugation, ligand-binding protein, molecular cell biology, protein structure, small-angle x-ray scattering (SAXS)
Introduction
Contactin-associated protein-like 2 (CASPR2)6 is a neuronal cell adhesion molecule known in rodents to be necessary for the clustering of the Kv1 potassium channels at juxtaparanodes (1). In myelinated nerves, CASPR2 is confined to the juxtaparanodal region of the axon where it appears to associate with the immunoglobulin domains of TAG-1 (transient axonal glycoprotein-1) to form a scaffold, which clusters the potassium channels Kv1.1 and Kv1.2 (2–4).
CASPR2 is predicted to be a type I transmembrane protein of 1331 amino acids with the extracellular domain followed by a single transmembrane domain and a short (48 residues) intracellular domain that terminates with a class II PDZ recognition motif. Computational predictions suggest that CASPR2 has 12 putative N-linked glycosylation sites and 36 Cys residues likely making 18 disulfide bonds, forming 8 independently folded domains: four laminin, neurexin, sex hormone-binding globulin domains (LNS), two epidermal growth factor (EGF) domains, one discoidin domain, and one fibrinogen-like domain (Fig. 1A). CASPR2 shares an overall domain organization with α-neurexin-1 despite a relatively low amino acid identity (∼23% identity, ∼39% similarity). However, distinctive features such as a discoidin domain in place of the first LNS domain and a fibrinogen-like domain in place of the 4th LNS domain suggest a different overall structural architecture. No information about the three-dimensional structure of CASPR2, other than that inferred from sequence homology, is currently available. Functionally, only TAG-1 (contactin 2 or CNTN2) has been thus far identified as the extracellular ligand for CASPR2 (2–4).
FIGURE 1.

Diagram of the CASPR2 constructs and hydrodynamic characterization of the purified extracellular domain of CASPR2–1261. A, top, domain organization of the full-length protein. N and C, N and C termini of the wild type, full-length protein; L, leader peptide; Disc, discoidin domain; LNS1 to 4, laminin, neurexin, sex-hormone-binding globulin domains; E1 and E2, epidermal growth factor domains; F, fibrinogen-like domain. The intracellular domain (ICD) is on the right side of the cell membrane. For CASPR2–1261, 1–8 are the domain numbers used throughout the manuscript; Fc, Fc domain of human IgG. B, size exclusion chromatography trace of purified CASPR2–1261. Top margin shows column calibration: 1, thyroglobulin (670 kDa); 2, γ-globulin (158 kDa); 3, ovalbumin (44 kDa); 4, myoglobin (17 kDa); 5, vitamin B12 (1.35 kDa). Inset, Coomassie Blue staining of a CASPR2–1261 sample composed of the main peak with the relative molecular masses. C, G(s) distribution plots from the enhanced van Holde-Weischet analysis of sedimentation velocity experiments of four concentrations of CASPR2–1261 over 10-fold dilution (10.68 to 1.24 μm).
Individuals in a cohort of Amish children, homozygous for a frameshift mutation (single-base G deletion at nucleotide 3709 in exon 22) involving the CNTNAP2 gene, present focal seizures and autistic regression after the onset of the seizures (5, 6). In these patients, surgical biopsy revealed severe cortical dysplasia in all children and periventricular leukomalacia in one girl, suggesting that CNS myelination was affected. The frameshift mutation introduces a premature stop codon at position 1253 (CASPR2–1253*), resulting in a protein that is devoid of its transmembrane and intracellular domains. In vitro, we show that CASPR2–1253* folds properly, but it is secreted in the extracellular space, thus becoming non-functional due to the fact that the protein is no longer tethered to the cell membrane (7). In humans, postmortem studies revealed that the juxtaparanodes were disrupted in multiple sclerosis lesions. In particular, the localization and expression levels of CASPR2 and TAG-1 were reduced around the lesions and absent in lesion areas (8) although it remains unclear whether nodal disruption represents a cause or a consequence of the disease.
Another cell adhesion molecule member of the CNTN family, Contactin-1 (CNTN1), has been shown to be essential for the organization of paranodal regions in myelinated axons. CNTN1 is composed by six Ig domains followed by four FNIII domains and a glycosylphosphatidylinositol anchor. At the amino acid level, the extracellular domain of human CNTN1 is ∼48.6% identical (∼74% similar) to the extracellular domain of human TAG-1. CNTN1 is required for the cell surface localization of CASPR1 where they form a complex during the myelination process (9–11). CNTN1 has also been implicated in hippocampal neurogenesis and cell proliferation as well as in synaptic plasticity and memory in the adult mouse (12). Expression of CNTN1 in both neurons and oligodendrocytes suggests a role in myelination, which has been confirmed by low levels of myelin basic protein in the CNTN1 KO mouse and by its interaction with other molecules involved in myelination (13–16).
Here, we present data on the overall architecture of the extracellular domain of CASPR2 and report the identification of a new endogenous ligand, CNTN1. Intriguingly, although CASPR2 and CNTN1 expression overlaps at the paranodes during early development (17) suggesting a functional relationship, the association between the two proteins has never been reported. We used small angle x-ray scattering, analytical ultracentrifugation, and single particle negative stain electron microscopy to build a structural model of the extracellular domain of CASPR2. We also show that CNTN1 directly binds to CASPR2 with micromolar affinity through specific domains. Remarkably, under the same experimental conditions, we could not detect CASPR2 association with TAG-1, its putative ligand (2–4). Moreover, by using dissociated hippocampal neurons we show that microbeads loaded with CASPR2 co-localize with the transfected CNTN1, whereas beads loaded with a deletion mutant do not, suggesting that CNTN1 is an endogenous ligand for CASPR2. Taken together these data provide novel insights into the structure of CASPR2 and the function of both CASPR2 and the new extracellular ligand, CNTN1.
Experimental Procedures
Cloning of the Proteins
The full-length CASPR2, TAG-1, and CNTN1 cDNAs were acquired from Open Biosystem (Thermo Fisher Scientific Inc., Pittsburgh, PA). The entire coding sequence of the proteins were fully sequenced and inserted into a pcDNA3.1 vector with either the FLAG or HA epitopes cloned after the leader peptide. The entire extracellular domains of CASPR2, TAG-1, CNTN1, and CNTN5 were cloned into a pCMV6-XL4 expression vector (18). This vector has a 3C protease cleavage site (LEVLFQ/GP) after the protein sequence and the beginning of the human Fc sequence. All CASPR2 and CNTN1 deletion constructs were cloned into pCMV6-XL4 vector by insertion of NotI before the first domain of interest and by XbaI after the last domain of interest (Table 1). The XbaI site in the vector was placed at the beginning of the 3C protease sequence. The plasmids encoding for CNTN3, -4, and -6 were kindly provided by Dr. Woj Wojtowicz, University of California, Berkeley.
TABLE 1.
| Construct | Protein boundaries (amino acid numbers) |
|---|---|
| CASPR2 D1 | 28–184 |
| CASPR2 D1–6 | 28–962 |
| CASPR2 D3–6 | 376–962 |
| CASPR2 D6–8 | 789–1218 |
| CASPR2 D2–3 | 187–557 |
| CNTN1 Ig1-Ig6 | 21–612 |
| CNTN1 Fn1-Fn4 | 603–996 |
| CNTN1 Ig5-Fn2 | 396–808 |
| CNTN1 Ig5-Fn1 | 396–704 |
| CNTN1 Ig6-Fn1 | 507–704 |
Cell Culture and Transfection
Human embryonic kidney 293 cells lacking N-acetylglucosaminyltransferase I (GnTI) activity (HEK293 GnTI−) were obtained from American Type Culture Collection (ATCC, Manassas, VA). With these cells glycosylation remains restricted to a 7-residue homogeneous oligosaccharide (19). Cells were grown in Dulbecco's modified Eagle's medium (DMEM) supplemented with 2 mm glutamine, 10% (v/v) fetal bovine serum (FBS), maintained in a humidified incubator at 5% (v/v) CO2 and 95% (v/v) air, and periodically tested to ensure the absence of mycoplasma contamination. Stable cell lines were made for each mutant following the calcium phosphate protocol and kept in DMEM, 10% FBS supplemented with 500 μg/ml of G418 (Geneticin) (Sigma).
Expression and Purification of Proteins
Constructs encoding the entire extracellular domain of CASPR2, CNTN1, or TAG-1 fused to Fc were transfected into HEK293 GnTI− cells and selected by growth in the antibiotic G418 (20). For protein expression, cells were maintained at 37 °C and 5% (v/v) CO2 in Dulbecco's modified Eagle's medium containing up to 2% (v/v) FBS. Proteins were affinity purified using Protein A-CaptivATM PriMAB (RepliGen, Waltham, MA) in 150 mm NaCl, 20 mm Tris, pH 8.0, and subsequently cleaved with 3C protease to remove the Fc fragment. To ensure homogeneity of the preparation by absence of degradation or aggregation products, affinity purified proteins were re-purified and buffer exchanged by gel filtration using a Superdex 200–10/300 DE column (GE Healthcare) in 150 mm NaCl, 10 mm Hepes, pH 7.4. Fractions corresponding to CASPR2 were collected and concentrated up to ∼9.6 mg/ml. Aliquots of the purified proteins were separated by SDS-PAGE to check for purity and integrity. Lysozyme, for use as a scattering standard, was solubilized in 150 mm NaCl, 40 mm sodium acetate, pH 3.8, and dialyzed against the same buffer with the final dialysate used for solvent blank measurements. Protein concentrations were determined at 280 nm using extinction coefficients expressed as E0.1% for CASPR2 (1.516 liter/g) calculated using Protparam (21).
N-terminal Sequencing and Mass Spectrometry Determinations
Edman degradation was performed by the Molecular Structure Facility core at the University of California, Davis. Mass spectrometry determination of CASPR2–1261 mass was determined on a PE Biosystems Voyager DE-STR instrument (Framingham, MA) at the Biomolecular Mass Spectrometry Facility, University of California, San Diego.
Analytical Ultracentrifugation
All samples were measured in a Beckman Optima XLI at the Center for Analytical Ultracentrifugation of Macromolecular Assemblies (CAUMA) at The University of Texas Health Science Center at San Antonio (UTHSCSA). All samples were measured in a single experiment at 40,000 rpm in an AN60Ti rotor and at 20 °C, using standard epon 2-channel centerpieces in 10 mm Hepes buffer, pH 7.4, and 150 mm NaCl. Protein concentrations were 1.24, 2.51, 4.19, and 10.68 μm, corresponding to 0.31, 0.63, 1.05, and 2.68 absorbance units at 280 nm (6.37 fringes), respectively. The three lowest concentrations were measured using absorbance optics in intensity mode at 280 nm, whereas the highest concentration was measured with interference optics (see Ref. 22 for details on intensity measurements, which allow up to two samples to be measured per cell). All data were analyzed using UltraScan-III, revision 2029 (23). Time and radially invariant noise was removed during analysis with the two-dimensional spectrum analysis (24), and diffusion-corrected sedimentation coefficient distributions were calculated with the enhanced van Holde-Weischet method (25). Parsimonious regularization of the two-dimensional spectrum analysis results and molecular weight determinations were performed with the genetic algorithm analysis (26, 27). The genetic algorithm solution is then analyzed by Monte Carlo analysis to determine confidence limits for the determined parameters (28). All calculations were performed on the Lonestar cluster at the Texas Advanced Computing Center at the University of Texas at Austin, and on the Jacinto cluster at the Bioinformatics Core Facility at UTHSCSA (29). Partial specific volume was calculated based on amino acid composition using UltraScan based on the method by Durchschlag (30) accounting for total carbohydrate, and were found to be 0.7217 cm/g.
Small Angle X-ray Scattering Data Analysis of CASPR2
SAXS data recorded as I(q) versus q, where q = 4πsinθ/λ (2θ is the scattering angle and λ the x-ray wavelength, 1.54 Å, CuKα) were collected from protein samples and matched solvent blanks (ultrafiltrate buffers for CASPR2 and last step dialysate for lysozyme) at 20 °C using an Anton Paar SAXSess line collimation instrument at the University of Utah. Scattering intensities were detected on two-dimensional position-sensitive image plates (10 mm slit and integration width) and data reduction was performed using SAXSQuant1D (Anton Paar proprietary software) as described in Ref. 31. The final one-dimensional scattering profiles for each protein in solution were determined by subtracting the matched solvent scattering contributions from the respective sample scattering and applying a geometry correction (10-mm slit and integration width) to take into account smearing effects caused by the slit collimation of the x-ray source. A concentration series for CASPR2 was measured between 1.0 and 9.6 mg/ml in 10 mm Hepes, pH 7.4, and 150 mm NaCl.
Guinier plots (ln(I(q)) versus q2) were initially evaluated using the program SAXSQuant1D. The Rg and I(0) for CASPR2 and the lysozyme standard were determined from the geometry-corrected SAXS data using linear regression and extrapolation of ln(I(q)) versus q2 in the very low angle region of the plot (qRg ≤1.3). The probable inter-atomic distance distribution of vector lengths for each of the proteins, or pair distance distribution function, p(r), were calculated using the indirect Fourier transform method of Svergun as implemented in the program GNOM (32). This method also incorporates a geometric correction factor that takes into account the slit geometry of the instrument to produce a real-space atom pair distance distribution. Structural parameters derived from the p(r), including I(0), Rg, and Dmax were determined for the CASPR2 proteins and lysozyme standards at various protein concentrations.
The determination of I(0) from the protein samples was used to evaluate sample monodispersity against a lysozyme standard. Dilute monodisperse proteins of the same x-ray scattering (electron) density in solution adheres to the relationship,
 |
where MW is the calculated (expected) molecular mass of the scattering protein (kDa), c is the protein concentration (mg/ml), and K is a constant. Lysozyme is known to be monomeric and monodisperse under the conditions measured (33). Thus the K value derived from the lysozyme I(0) data can be used as a standard to evaluate the molecular mass of CASPR2 provided that protein concentrations are known within ∼5%. When the K value of the lysozyme data is normalized to 1, it is found that the resulting K for the CASPR2 constructs spanning the concentrations series is 1.16, i.e. the molecular mass of the CASPR2 proteins are 16% higher than the calculated molecular mass of the peptide chain. However, this molecular mass was within ∼5% of the molecular mass calculated by MS.
Ab Initio and Rigid Body Modeling
DAMMIN (34) ab initio bead modeling was performed against CASPR2 SAXS data using the ATSAS online server. Ten individual modeling runs were performed. The spatial alignment and averaging/bead occupancy corrections were calculated using DAMAVER and DAMFILT.
Rigid body modeling using CORAL was set up using the SWISS-model derived homology models for each domain of CASPR2 with the addition of bound glycans. The glycan moiety corresponding to Man5GlcNAc2,
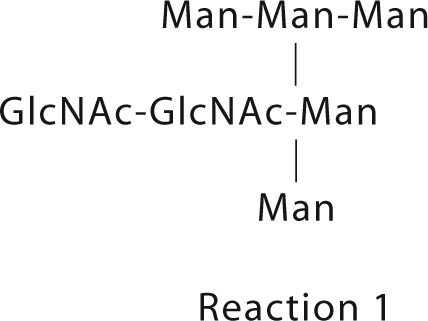 |
were added to Asn residues using the program GLYCOSYLATION that is part of the new ATSAS 2.7.1 software release.7 The Asn amino acids modified have a combined glycan mass of ≈15 kDa and are reported below. We have used the program GLYCOSYLATION to model each heptasaccharide at each N-linked attachment site (Table 2) as a rigid body during Coral refinement. GLYCOSYLATION draws from database of glycan structures typically found on glycosylated proteins.
TABLE 2.
CASPR2 homology model domain boundaries
N-linked glycosylation sites are indicated in yellow. Fragments not included in homology models are underlined.

CORAL modeling was performed using the glycan-modified CASPR2 domains as rigid bodies, with 15–20 Å distance constraints imposed between the C and N termini during refinement. Refinement was performed against the desmeared (i.e. geometry-corrected) SAXS data across the concentration series data for CASPR2. Twenty individual CORAL modeling runs were performed. The final fits against the SAXS data of the Casper models were assessed using CRYSOL, with a background constant correction enabled. In all instances (ab initio and CORAL modeling) discrepancies between the final models and data were evaluated using the traditional reduced χ2 test and the probability of similarity obtained from variance/covariance correlation map assessments (35). The SAXS data and resulting models have been deposited to the SASBDB database (36) with accession code SASDBR2.
Homology Modeling of CASPR2
Swiss Model Server was used to obtain structural templates for all of CASPR2 domains. A total of eight sequences (ranging between 2 and 60 residues) linking various LNS and epidermal growth factor domains did not have a suitable three-dimensional template (Table 2).
Negative-stain Single Particle Electron Microscopy (EM) Epitope Tagging
Purified CASPR2 (0.05–0.1 mg/ml) in 10 mm Hepes, pH 7.4, and 150 mm NaCl solution was applied to glow-discharged carbon-coated grids and negatively stained with 0.75% uranyl formate as described (37). EM images for class averages were collected using a Jeol 1200 operated at 80 kV on Kodak film camera at a magnification of ×60,000. The range of defocus values was 0.5 to 1.1 μm under focus. Approximately 4,000 particles were analyzed using multivariate statistics, image classification, and averaging. Particles were selected interactively using the WEB display program. A second pass selection of properly centered particles was done interactively, and particles were aligned and classified by reference-based alignment and the K means classification (51 classes) using the SPIDER suite (38).
Biolayer Interferometry (BLI) Analysis
BLI binding experiments were conducted using a BLItz instrument (ForteBio, Menlo Park, CA) at room temperature. Anti-human Fc capture Biosensors were pre-wetted for 10 min in 300 μl of 10 mm Hepes, pH 7.4, 150 mm NaCl, 10 mm CaCl2, 10 mm MgCl2, and 5% (w/v) BSA buffer prior to use. Subsequently, the sensor tips were incubated with conditioned medium of transiently transfected CASPR2 or CNTNs for 10 min to capture the expressed protein. The binding reaction occurred in a 4 μl drop containing various concentrations of purified proteins under agitation. Both association and dissociation were allowed to occur for 90 s. Nonspecific binding and instrument noise were subtracted by using a sensor tip saturated with Fc fragment alone.
Cell-based Binding Assay
HEK293 cells were transfected with HA_CASPR2 or FLAG_CNTN1 FL following calcium phosphate protocol in a 60 mm plate. After overnight incubation, cells were transferred to 24-well plates on poly-d-lysine-coated glass coverslips (12 mm diameter) at a density of 3.5 × 10⁴ cells/well. After ∼6 h of incubation at 37 °C, 1–5 μm purified CASPR2 or CNTN1 were added to the cells in media (DMEM, 0.1% (w/v) bovine serum albumin (BSA), 20 mm Hepes, pH 7.4) and the cells were incubated at 4 °C for 16 h. After two washes with cold DMEM and one with PBS, cells were fixed with cold 4% paraformaldehyde for 15 min at 4 °C. Cells were washed 3 times with PBS and incubated with anti-human IgG (1:1000, Santa Cruz Biotechnology, Dallas, TX) in blocking solution (2% (w/v) normal donkey serum, 2% (w/v) BSA in PBS) for 1.5 h at room temperature. After three washes with PBS, anti-HA (1:1000, Roche, Basel, Switzerland) or anti-FLAG (1:5000, Sigma) was added to the cells in blocking buffer solution and incubated for 2 h followed by three washes with PBS and incubation of secondary antibodies conjugated to Alexa Fluor-488 and Cy3 (1:500, Jackson ImmunoResearch, West Grove, PA) for 1 h. Coverslips were then mounted onto glass microscope slides using Fluoromount G (Southern Biotechnology, Birmingham, AL) and analyzed with a Zeiss LSM 700 confocal microscope with a Cooke SensiCam charge-coupled device (CCD) cooled camera fluorescence imaging system.
Neuronal Cultures and Transfection
Mouse hippocampi prepared from C57BL/6 at postnatal day 0 (P0) were collected in Ca2+,Mg2+-free Hanks' balanced salt solution containing 0.01% (w/v) Hepes and incubated with 0.6 mg/ml of papain (Worthington, Lakewood, NJ) for 20 min at 37 °C. After incubation with 1 mg/ml of DNase for 5 min, hippocampi were washed with plating medium (basal medium Eagle containing 0.45% glucose, 1 mm sodium pyruvate, 2 mm l-glutamine, 10% (w/v) FBS, 100 units/ml of penicillin, and 100 μg/ml of streptomycin). Neurons were dissociated by trituration and plated on 24-well plates on poly-d-lysine-coated glass coverslips (12 mm diameter) at a density of 10 × 104 cells/well. Hippocampal neurons were cultured in Neurobasal medium supplemented with 2% (v/v) B-27 (Invitrogen), 1% (v/v) Glutamax, 100 units/ml of penicillin, and 100 μg/ml of streptomycin in a humidified atmosphere containing 5% (v/v) CO2 and 37 °C. Neurons were transfected with the appropriate plasmid using Lipofectamine 2000 following the manufacturer's protocol (Invitrogen).
Bead Adherence Experiments
Non-fluorescent streptavidin-labeled 1-μm magnetic beads (Thermo Scientific, aqueous suspension at 10 mg/ml, Waltham, MA) were washed in PBS containing 100 μg/ml of BSA (PBS/BSA) and incubated with biotin-conjugated anti-human IgG-Fc (Jackson ImmunoResearch, West Grove, PA) at 1.2 μg of antibody per μl of beads in PBS/BSA at 4 °C for 2 h. The beads were then rinsed with PBS/BSA and further incubated in each of the soluble CASPR2-Fc constructs in conditioned DMEM at 4 °C overnight. After an additional wash in PBS/BSA, the beads were sprinkled onto hippocampal neuron cultures (1 μl of beads/coverslip) and left for 24 h in the CO2 incubator, and subsequently fixed.
Immunocytochemistry
Neurons at variable days in vitro (ranging from days in vitro 7 to 12) were fixed in 4% (v/v) paraformaldehyde in PBS for 15 min. Cells were then incubated in blocking solution (PBS containing 0.1% (v/v) Triton X-100, 2% (v/v) normal sheep serum, and 0.02% (w/v) sodium azide) for 1 h. All antibodies used were diluted in blocking solution. Primary antibodies used were: anti-FLAG (1:5000, Sigma) and anti-microtubule-associated protein-2 (1:5000, Abcam, Toronto, ON). Cells were incubated in primary antibody-containing solution at 4 °C overnight, then washed with PBS three times. Secondary antibodies conjugated to Alexa Fluor-488, Cy-3, and 647 were generated in donkey toward the appropriate species (1:500, Jackson ImmunoResearch, West Grove, PA). Coverslips were then mounted onto glass microscope slides using Fluoromount G (Southern Biotechnology, Birmingham, AL). Labeled cells and magnetic beads were visualized by immunofluorescence on a Zeiss LSM 700 confocal microscope with a Cooke SensiCam charge-coupled device cooled camera fluorescence imaging system. The conditions for capturing images and the settings for thresholds were kept identical throughout each series of experiments.
Results
Biochemical Characterization of the Purified Extracellular Domain of CASPR2
The construct generating the secreted extracellular domain of CASPR2 (Fig. 1A) extends from the first methionine of the leader peptide to residue Ser-1261 (CASPR2–1261) located immediately before the transmembrane domain. As the secreted CASPR2 protein is expressed using the native leader peptide, we wanted to determine the N-terminal sequence of the mature protein. Five cycles of Edman degradation unambiguously showed that CASPR2 starts at Ala-28, consistent with predictions using bioinformatics tools. Because CASPR2 is highly glycosylated, to simplify structural analyses, we expressed it using glycosylation deficient HEK293 GnTI− cells, which only adds a Man5GlcNAc2 (mass = 1234 Da) to each N-linked glycosylation site. CASPR2–1261 was subjected to accurate mass determination by MALDI-TOF. Whereas the peptide mass of the expressed protein is calculated to be 138,481 Da, mass spectrometry of CASPR2 revealed a molecular mass of 153,229 Da. The difference of 14,748 Da between the two values is explained by the glycosylation of the protein. The occupancy of the potential N-linked sites was therefore estimated to be 11.9 units per molecule on average, a value consistent with 12 potential N-linked glycosylation sites. Therefore, these data allowed us to estimate the overall oligosaccharide occupancy of the mature, expressed protein. To ensure sample monodispersity for subsequent experiments, the purified CASPR2–1261 was analyzed by size exclusion chromatography (SEC), yielding a single peak eluting at 12.6 ml, corresponding to an apparent molecular mass of ∼140 kDa, consistent with the determined molecular mass of 153 kDa (Fig. 1B).
Analytical Ultracentrifugation Indicated That CASPR2 Is a Monomer in Solution
To further characterize oligomerization behavior, mass, and shape distributions of CASPR2–1261, we performed sedimentation velocity experiments over four loading concentrations from 1.24 to 10.68 μm. The typical half-parabola shape seen for reversible monomer-dimer equilibria, and an increase in sedimentation coefficients with an increase in concentration expected for a dimerization are absent (39). Analysis of the sedimentation velocity experiment by the van Holde-Weischet method (25) revealed identical sedimentation coefficient distributions for all concentrations, with >90% of the sample displaying a homogeneous species with a sedimentation coefficient consistent with the monomeric molecular weight, and, in these samples, a small amount (<10%) of aggregate. A small concentration dependent non-ideality effect was evident, which reduced the S value slightly at higher concentrations (7.76S for 1.24 μm, 7.76S for 2.51 μm, 7.62S for 4.19 μm, and 7.04S for 10.68 μm). Such an effect is not unexpected, especially for glycosylated proteins, where sugar moieties can contribute to crowding and interaction effects. The results for the van Holde-Weischet analysis are summarized in Fig. 1C. To further confirm the molecular weight of the major species we performed a global genetic algorithm, Monte Carlo analysis (27, 28), on the three lower concentration samples. This analysis revealed a molecular mass of 150.1 kDa for the major species (95% confidence intervals: 142.8 and 157.4 kDa), which is in excellent agreement with the monomer molecular weight determined by MALDI-TOF, and a frictional ratio of 1.39 (95% confidence intervals: 1.35 and 1.43), indicating a mostly globular conformation. Taken together, these observations strongly indicate that the extracellular domain of CASPR2 is monomeric in solution and well folded.
Small Angle X-ray Scattering
SAXS data were measured from samples consisting of the entire extracellular domain of CASPR2 (CASPR2–1261) (Fig. 1 and Table 3). Guinier plots of the SAXS data are linear (40) (Fig. 2A, inset) and there is no significant concentration dependence to the radius of gyration (Rg, ∼45 Å) or normalized forward scattering intensity at zero angle, I(0) (Fig. 2, B and C). Furthermore, there is good agreement between Rg values determined by Guinier and P(r) analysis.
TABLE 3.
SAXS parameters and statistics
| Data collection parameters | CASPR2–1261 |
|---|---|
| Instrument | SAXSess (Anton Paar) |
| Beam geometry | 10 mm slit |
| Wavelength (Å) | 1.5418 |
| q range (Å−1) | 0.01297–0.35140 |
| Exposure time (minutes) | 30 |
| Concentration range (mg ml−1) | 9.570–1.0 |
| Temperature (celsius) | 20 |
| Structural parameters | |
| Protein concentration (mg/ml) | 9.570 |
| I(0) (cm−1) [from P(r)] | 1.188 + 0.0060 |
| Rg (Å) [from P(r)] | 46.11 + 0.226 |
| I(0) (cm−1) [from Guinier] | 1.199 ± 0.007 |
| Rg (Å) (from Guinier) | 44.809 ± 1.633 |
| Dmax (Å) | 145 |
| Porod volume estimate (Å3) | 298,433 |
| Dry volume estimated from sequence (Å3) | 167,557 |
| Molecular mass determination | |
| Partial specific volume (cm3 g−1) | 0.7156 |
| Molecular mass, kDa (from I(0) compared with lysozyme) | 160 |
| Calculated monomeric mass from sequence (Da) | 138,551/153,229 (MS) |
| N-Linked glycosylation sites (potential) | 12 |
| Software employed | |
| Primary data reduction | Saxquant 1d |
| Data processing | Gnom |
| Ab initio analyses | Gasbor |
| Validation and averaging | Damaver |
| Rigid body modeling | Coral |
| Computation of model intensity | Crysol |
| Three-dimensional graphic representation | PyMol |
FIGURE 2.

Basic scattering parameters and modeling of the extracellular domain of CASPR2–1261. A, desmeared scattering profile of the highest concentrations of CASPR2–1261. Red line shows the fit of one of the models shown in E (model 4) overlaid with the raw data, showing excellent agreement between the two curves. Inset: Guinier analyses where the solid red line represents the linear fit through the Guinier region. B, CASPR2–1261 Rg versus concentration of the sample. C, CASPR2–1261 concentration dependent of the normalized forward scattering intensity at zero angle, I(0). Both parameters remain linear as expected by optimal protein preparation with virtually no non-ideal effects. D, the P(r) functions of CASPR2–1261, indicates the distribution of all interatomic distances and the maximum dimension of the particle in Å. Statistical quality of the data can be assessed by the standard error bars; some estimated errors are smaller than the symbols. See also Table 3 for a complete report of other SAXS parameters. E, overlay of six distinct DAMMIN models obtained by ab initio reconstructions (white bead representation) with six models obtained with rigid body modeling (ribbon representation) to highlight the similarity between the model pairs. N and C, N- and C-termini of the protein.
P(r) analysis also indicates that the maximum linear dimension (dmax) value of CASPR2–1261 is 140 Å (Fig. 2D), and the slightly extended asymmetry to the right side of the peak is consistent with a relatively compact multidomain protein. Using lysozyme as a standard (33) and relative I(0) values, the molecular mass of CASPR2 in solution was estimated to be 160 kDa, consistent with the monomeric form of the protein measured by mass spectrometry (153.2 kDa). The slightly higher than the expected (<5%) molecular mass is likely due to the influence of N-linked glycans. Taken together, these solution scattering measurements demonstrate that these protein preparations are free of nonspecific aggregation and inter-particle interference effects and thus suitable for more detailed structural analysis.
Ab Initio Modeling
To obtain an initial assessment of the three-dimensional shape of the extracellular domain of CASPR2, we used an established ab initio bead-modeling approach implemented in the DAMMIN software package version 5.3 (41). With this procedure, we derived an ensemble of molecular shapes that best describe the scattering data. All of the models for CASPR2–1261 had an excellent fit to the data (χ2: ∼0.76–0.77: correlation map p > 0.01) (35) and the normalized spatial discrepancy values of 0.77–0.90 (42) indicated reasonable correspondence between each shape reconstruction in that they share an overall compact shape, but with differences in the detailed shape boundaries. Analyses of the individual bead models (Fig. 2E) revealed structural features in common with models derived from rigid body modeling procedures and from single particle EM (see below) showing that CASPR2–1261 maintained a compact overall architecture.
Rigid body Modeling
At present, no high resolution structure of any CASPR2 domain is available. Therefore, using the SWISS MODEL server, homology models were built for each domain, with ∼90% overall coverage of the extracellular domain (1107 over 1234 amino acids) (Table 2). To obtain an atomistic structural model of CASPR2 that best fits the SAXS data the program CORAL (41) was used. This program simultaneously refines the relative orientation and positioning of individual homology modeled domains as rigid bodies against the SAXS data, while accounting for amino acids not present in the coordinate files, by modeling them as self-avoiding polyglycine inter-domain linkers. The resulting CORAL models (χ2: 0.42–1.24: correlation map p > 0.01) (Fig. 2E, ribbon representation) spatially superimpose with individual ab initio bead models and show a similarly compact architecture. Several models were obtained that fit the SAXS data equally well, had a dmax of ∼140 Å, and shared the common features of being overall compact, with a three-clover leaf at one end and two domains at the other end. However, probably due to its overall more compact architecture compared with α-neurexin, SAXS data did not allow us to model the N- or C-terminal ends of the protein always in the same position with respect to the other domains (Fig. 2E).
Although the model of the central fibrinogen-like domain is missing eight amino acid residues, its N- and C- terminal ends are spatially proximal, likely forcing the proximal and distal domains of CASPR2 into a compact overall architecture. This is in contrast with the extended shape of α-neurexin that contains a central LNS domain in place of the fibrinogen-like domain (43). Finally, to best approximate the molecular volume/mass contributions of the highly hydrated sugar moieties, N-linked glycan moieties were added to all the Nx(S/T) sequons available in the homology modeled domains during rigid body modeling (Fig. 3). This model highlights the volume of the Man5GlcNAc2 carbohydrate occupancy of this molecule and suggests that when native glycosylation is added in the Golgi apparatus, an even larger volume occupied by the sugar moieties can affect the overall flexibility of the protein and the interaction with its ligand(s).
FIGURE 3.

SAXS rigid body model of CASPR2. Single rigid body model (model 4 of Fig. 2E) in white ribbon representation. The model is shown in two orientations to highlight the carbohydrate contribution (blue spheres, Ref. 50) to the total mass of the protein and the few residues missing in the modeling procedures (orange spheres). Red numbers refer to the individual domains as described in the legend to Fig. 1A. N and C, N and C termini of the protein.
Single Particle Negative Staining EM
SAXS provides a time and ensemble average representation of the conformation of macromolecule in solution, whereas single particle EM can directly provide information regarding individual structures. To evaluate potential structural variability in the extracellular domain of CASPR2, the purified protein was fractionated by size exclusion chromatography and the fraction corresponding to the center of the peak was imaged using a transmission EM (Fig. 1B). CASPR2 particles were monodisperse and homogeneous in size and all shared a compact overall architecture, in good agreement with all other experiments presented thus far. Raw single particle EM imaging of the entire extracellular domain of CASPR2 showed that individual particles adopted an assortment of conformations illustrated by a variety of shapes (Fig. 4, A and B). After aligning and averaging ∼4,000 particles and classifying them into 51 classes, the majority clearly showed the presence of five distinguishable modules, which, judging from their size (∼40 Å diameter), corresponded to the discoidin and the four LNS domains (Fig. 4, B and E).
FIGURE 4.

Single particle EM of the extracellular domain of CASPR2. A, raw image of the CASPR2–1261 particles before alignment. Scale bar, 50 nm. B, selection of representative class averages, which show five visibly distinct domains. Scale bar, 15 nm. The size of each box of the class averages is 32 × 32 nm. C and D, overlay of one EM class average to ab initio reconstruction (C) or one of the rigid body models obtained with Coral (D) to show the high similarity of shapes and models obtained with these independent procedures. In this panel, we have labeled the domains resulting from the rigid body modeling. Scale bar is 7.5 nm. E, additional 51 single particle EM classes show the breadth of the conformational variability and orientation of the protein on the grid of the extracellular domain of CASPR2.
The central domain between residues ∼592 and ∼798 that contains a small fibrinogen-like sequence of unknown structure could not be identified. As for the two epidermal growth factor domains (∼35 amino acids each) their small size did not allow us to specifically identify them with this technique, as shown in similar experiments used to determine the α-neurexin structure (43). Although these images do not allow us to readily distinguish between conformational diversity and different positioning of the protein on the grid, numerous class average images of the extracellular domain of CASPR2 clearly showed features similar to the ab initio and rigid body modeling (Fig. 4, C and D). In particular, we could distinguish the clover leaf arrangement at one end and two domains at the other end, suggesting that the three domains constitute the N-terminal region of the protein, whereas the two-domain region likely represents the third and fourth LNS domains. In these experiments, the maximum dimension of the particles remains highly consistent with the SAXS measurements (∼145 Å). Taken together, all biophysical experiments shown here, including SEC, analytical ultracentrifugation, SAXS, and single particle EM illustrated that the extracellular domain of CASPR2 has an overall compact architecture. As all these data come from independent biophysical techniques, they strongly suggest that the observed three-dimensional organization is relevant in vivo.
CNTN1 Is a Novel Ligand for CASPR2
Testing the binding of CASPR2 to the contactin family of proteins (which includes the putative ligand TAG-1 of CASPR2), we found that contactin 1 (CNTN1) specifically associates with the extracellular domain of CASPR2. Using BLI we immobilized CNTN1–993-Fc on an anti-human Fc sensor and used the purified extracellular domain of CASPR2–1261 to directly test the association (Fig. 5A). The binding between the extracellular domains of CASPR2 and CNTN1 displayed fast association and dissociation rates, with a calculated dissociation rate constant, KD, of ∼14 μm. When the phases were reversed by immobilizing CASPR2-Fc to the sensor tip and using purified CNTN1–993 (Fig. 5B), similar results were obtained.
FIGURE 5.

CASPR2 and CNTN1 association experiments. A, BLI experiment of the association between the extracellular domain of CNTN1–993 and the purified CASPR2–1261. Five concentrations of CASPR2 (75 to 4.7 μm in 2-fold dilution) were used to determine the affinity of the association, calculated in the inset. The global association and dissociation rate constants obtained from these curves are: ka = 1.461 × 10⁴ m−1 s−1 and kd = 3.29 × 10⁻¹ s−1. B, SEC profile of purified CNTN1 used for BLI experiments. The elution volume of this protein indicates that, similarly to TAG-1, CNTN1 is likely a dimer in solution. C, cell based binding assay between the HA-CASPR2 full-length transfected in HEK293 cells and the purified CNTN1–993 added at 3 μm. Fc- and HA-CASPR2 was used as a negative control, whereas NLGN1/β-NRXN1 were used as a positive control. Hoechst stain was used to visualize all cells. Scale bar = 10 μm.
To further investigate their association and determine whether CNTN1 is able to bind CASPR2 directly on the cell surface of live cells we performed a cell-based binding assay. HEK293 cells expressing the full-length CASPR2 HA-tagged were incubated with up to 5 μm purified CNTN1–993-Fc and we found that the extracellular domain of CNTN1 bound to CASPR2 expressed on the cell surface. As a positive control, we incubated HEK293 cells expressing Neuroligin 1 with 1 μm of purified β-neurexin-Fc (20, 44) or 5 μm of the Fc portion alone as a negative control (Fig. 5C).
CASPR2 Interacts with Multiple Domains of CNTN1
Having confirmed the association of CASPR2 and CNTN1 by two independent techniques, and measured the apparent affinity, we sought to determine which domain of either protein is responsible for the interaction. We engineered various deletion constructs for both CASPR2 and CNTN1 (see Table 1 for construct boundaries), expressed them in HEK293 cells, and used BLI to ascertain whether they retained their binding properties. Using this strategy we narrowed down the associating domains for CNTN1 as the central Ig5/FN1 construct (Fig. 6, A, C, and D). The shorter construct Ig6/FN1 did not show measurable association, as well as either half (the six Ig domains or the four FN3 domains) of the protein (Fig. 6, A and C). Interestingly, for CASPR2, the construct encoding D1–6 was the shortest construct that showed CNTN1 association. Although we tested smaller fragments such as D1, D2–3, D3–6, and D6–8, the lack of binding of these fragments suggests that the minimal binding domain of CASPR2 is composed by the first six domains together (Fig. 6, B–D).
FIGURE 6.

Determination of the associating domains between CASPR2 and CNTN1. A, BLI curves of purified CASPR2 (30 μm) bound to CNTN1–993 or shorter constructs immobilized on a sensor tip, highlighting the associating constructs. B, BLI curves of purified CNTN1–993 (30 μm) with immobilized various fragments of CASPR2–1261 or shorter constructs highlighting the associating constructs. C, diagram of the various CASPR2 and CNTN1 deletion constructs that were tested by BLI and their binding result. Dotted lines, no detectable binding; solid lines, associating fragments. D, Western blot (anti-human Fc) of the deletion constructs used to determine the minimal binding cassette by BLI. E, cell-based binding assay between the transfected HA-CASPR2 full-length or FLAG-CNTN1 full-length with the purified fragments at 3 μm that still retain binding by BLI. The Fc fragment alone was used as negative control. Hoechst stain was used to visualize all cells. Scale bar = 10 μm.
To confirm these results, we resorted again to the cell-based binding assay using WT CASPR2 expressed on the surface of HEK293 cells and soluble CNTN1-Ig5/Fn1. We also reversed the experiment and used WT CNTN1 and soluble CASPR2-D1–6. In both cases association was confirmed and the Fc alone was used as a negative control (Fig. 6E).
CNTN1 Is an Endogenous Receptor for CASPR2 in Hippocampal Neurons
We next wanted to determine whether CNTN1 is a receptor for CASPR2 in cultured primary neurons. CASPR2–1261-Fc fragments were loaded onto microbeads through the Fc portion (or the Fc alone as a control) and subsequently incubated with hippocampal neurons after 14 days in vitro. After washing and fixing the plated neurons, only the CASPR2 fragments that interacted with a ligand exposed on the surface of the neurons remained bound and could be visualized. Microtubule associated protein-2 was used as a marker for the neurons (Fig. 7A). In the absence of a ligand (e.g. beads loaded with the Fc control), beads were removed with the washes (Fig. 7B). To ascertain whether CNTN1 was a ligand when expressed on the surface of neurons and glial cells, we transfected WT CNTN1 in hippocampal neurons and repeated the binding experiments using CASPR2–1261 or the deletion constructs CASPR2-D3–6 as a negative control (Fig. 7, C and D). Under these conditions, beads loaded with CASPR2–1261 were clearly co-localizing with the transfected CNTN1 neurons, whereas beads loaded with CASPR2-D3–6 were removed with the washes similarly to the Fc alone control condition. Because only the domains positive for the CNTN1 association in vitro were bound to the neurons in culture, this experiment suggests that CNTN1 is one endogenous ligand for CASPR2.
FIGURE 7.

Hippocampal neurons in culture experiment suggesting an interaction between CASPR2 and endogenous CNTN1. A, 1-μm magnetic beads were loaded with CASPR2–1261 and incubated with hippocampal neurons before being fixed and stained. Note that the beads remain attached on the neuronal branches. B, Fc alone beads used as control were incubated with neurons in identical wells. Because of the lack of association, most of the beads have been lost through the washes. C, when neurons are transfected with FLAG-CNTN1, CASPR2–1261-loaded beads bind strongly to the cultured neuron. D, similarly to control beads, beads loaded with the non-interacting deletion construct CASPR2-D3–6 did not bind to the neurons transfected with CNTN1. Scale bar = 10 μm. Microtubule-associated protein (MAP2) was used to outline the neurons.
Binding of CASPR2 with the Other CNTNs
To test whether CASPR2 binds to other members of the CNTN family, we expressed and tested the binding of the extracellular domain of CASPR2 with CNTN1 through CNTN6 using BLI. Despite a 40–49% amino acid identity among the CNTN isoforms, we did not detect any association with any other CNTN family member, including its putative ligand TAG-1 (CNTN2) (Fig. 8, A and B) (2–4). Although the binding experiments with TAG-1 were replicated in various buffer conditions (e.g. with or without Ca2+ and Mg2+ and with different batches of proteins), we never detected any interaction.
FIGURE 8.

CASPR2 does not associate with any other CNTN family member. A, BLI curves of CASPR2 and all six CNTNs, showing that only CNTN1 binds to 30 μm CASPR2 in these conditions. B, Western blot of all six CNTNs showing their relative expression and molecular mass. CNTN4 migrates faster than all other CNTNs because our construct is missing the first Ig domain.
Discussion
Because of the importance of CASPR2 in human brain development (45) and to complement our previous biochemical work (7) we sought to understand the structure of CASPR2 and the molecular aspects of the interaction of CASPR2 with its new ligand CNTN1. Using a combination of independent biophysical and biochemical techniques we report here major new findings on the overall architecture of the extracellular domain of CASPR2 and its association with CNTN1. We describe here the first, to our knowledge, structural models of the extracellular domain of CASPR2: despite similarities in its domain composition and organization with αNRXN, our data indicate that the two proteins have distinct tertiary structures, as the extracellular domain of CASPR2 is compact with a likely dominant three-domain clover leaf feature with two domains somewhat extended. In contrast, the extracellular domain of αNRXN displays a significantly more elongated, “L-shaped” conformation (43, 46, 47). Second, our single particle EM data suggests that within an overall compact architecture the extracellular domain of CASPR2 may adopt a variety of tertiary arrangements, although a major proportion of the images processed are consistent with the arrangement that best fits the solution scattering data. Third, by expressing the proteins in HEK293 GnTI− cells and by using mass spectrometry and SAXS, we were able to model most of the glycan structures present on the extracellular domain of CASPR2, and demonstrate that they constitute a significant portion of the protein. Fourth, we show here for the first time that CNTN1 is an endogenous ligand that binds CASPR2 with micromolar affinity. Surprisingly, under the same experimental conditions none of the other members of the CNTN family, including the putative ligand TAG-1, directly interact with CASPR2.
Structural Characterization
Despite the sequence similarity with αNRXN, we present analytical ultracentrifugation, single-particle EM, and SAXS data that unambiguously reveal that the extracellular domain of CASPR2 is monomeric and more compact in shape than αNRXN with a maximum dimension of ∼140 Å (versus ∼170 Å for αNRXN), as consistently showed by SAXS rigid body modeling. In particular, because the central fibrinogen-like subdomain is unique to CASPR2, we speculate that this subdomain may be in part responsible for the compact three-dimensional shape of the extracellular domain of CASPR2. Although the identity of the subdomains cannot be determined by SAXS, EM class-averaged images show a group of two subdomains likely composed of the last two LNS subdomains and a group of three subdomains, likely composed by the discoidin and the first two LNS subdomains. The fact that the data from independent solution scattering, analytical ultracentrifugation, and single particle EM techniques agree strongly and overlay well, indicates that these conformations are native, and likely drive the biological function of CASPR2. Finally this study directly confirms the monomeric nature of the autism mutation CASPR2–1253* (5, 6) that we recently described (7). In this published work, comparative SEC analysis of CASPR2–1253* and CASPR2–1261 truncation constructs showed that these two proteins had virtually identical elution volumes, thus indicating equivalent overall shape and oligomerization state.
Single particle EM suggests that the extracellular domain of CASPR2 may exhibit some polymorphism in the arrangement of the individual subdomains. Such flexibility is common to many proteins with a modular architecture, and may well be functionally important as it allows the various domains to sample the three-dimensional volume and structurally adapt to the engagement with multiple binding partners and possibly to signal through the cell membrane. As discussed in more detail below, the flexibility of the extracellular domain of CASPR2 may be relevant to the micromolar affinity measured for CNTN1.
Unlike protein crystallography, where extensive glycosylation usually constitutes a barrier for crystallogenesis due to its hydration and flexibility, SAXS experiments are not restricted by the glycosylation degree of protein samples and the contribution of carbohydrate moieties to their overall structure can be modeled. In this work, both ab initio and rigid body modeling procedures take into account the structural and volumetric contribution of the N-linked glycosylation in the definition of the final structures (Figs. 2 and 3). In the analysis of these structural models we highlight the total amount of glycans because they constitute a large fraction of the mass of the protein and they likely influence the expression, folding, and solubility of CASPR2. In our models, we added to our subdomains Man5GlcNAc2 moieties because the protein used for structural determinations was produced by GnTI− cells. However, neurons probably add larger and more complex types of glycans and therefore the relative mass contributed by the native N-linked glycosylation is actually much larger than the one shown in this study. Larger glycosylation will also have an important impact on the architecture (e.g. flexibility) and ligand recognition of CASPR2.
CNTN1 Is a Novel Ligand for CASPR2
In testing the binding affinity of CASPR2 for the CNTN family, which includes the putative ligand TAG-1 (CNTN2), we found that only CNTN1 binds to the extracellular domain of CASPR2, and it does so with low affinity (dissociation constant in the micromolar range). This type of affinity is typical of the extracellular interactome (48), whereas nanomolar affinities are less common in this class of molecules. The fact that for CNTN1 we could not measure any association using the six Ig or the four Fn3 domains alone (CNTN1-Ig1–6 or CNTN1-Fn1–4) suggests that the minimal binding domain requires a combination of Ig and FN3 domains. Using several deletion constructs of both CASPR2 and CNTN1 enabled us to identify CNTN1 Ig-5/Fn1 and CASPR2 D1–6 as minimal binding cassette. However, the requirement for multiple domains is not unusual, especially for proteins containing Ig and FN3 domains (49). Our data indicate that the recombinant, purified extracellular domains of CASPR2, CNTN1, and TAG-1 are correctly folded because they appear non-aggregating (monodisperse) and without degradation in SEC experiments and SDS-PAGE, and that their expression levels were comparable with well folded proteins with which we have worked in the past (18, 43). Whereas we cannot exclude that CASPR2 specifically binds to other receptors in neurons, the use of deletion constructs in the neuronal experiments suggest that CNTN1 is an important endogenous ligand for CASPR2. Moreover, because of the positive binding, these experiments show that CASPR2 constructs are well folded. Remarkably, under the same experimental conditions TAG-1 (CNTN2) does not seem to associate with CASPR2. Because the affinity of the CASPR2/TAG-1 pair is currently unknown, as the binding was detected with non-quantitative techniques (e.g. immunoprecipitation) (2–4), one possibility is that the TAG-1/CASPR2 interaction is significantly weaker than the interaction with CNTN1, and therefore we are not able to detect it by BLI. Another possibility is that the complex associates through the interaction with a third protein that is currently unknown.
Although many open questions on the in vivo functions of CASPR2 remain, our structural models, the observed interaction with CNTN1, the extensive glycosylation, and the conformational heterogeneity, offer new insights into the structure-function relationship of these two neuronal proteins. Moreover, because CNTN1 is expressed by both neurons and glial cells, the discovery of CNTN1 as a new CASPR2 ligand suggests a complex role of CASPR2 in the nervous system.
Author Contributions
D. C. and J. T. designed the research; E. N. R-M., G. V., I. P., F. M. R., S. v. D., and B. D. performed the experiments; M. H., B. D., and J. T. contributed analytic tools; C. M. J., T. R. S., B. D., G. P., and D. C. analyzed data; D. C., J. T., A. D. J., and C. M. J. wrote the manuscript.
Acknowledgments
We acknowledge the superb support provided by the staff at the Texas Advanced Computing Center at the University of Texas at Austin. We thank Dr. Woj Wojtowicz, University of California, Berkeley, for generously providing the CNTN 3, 4, and 6 clones. Electron microscopy employed the facilities of the National Center for Imaging and Microscopy (NCMIR) at UCSD supported by National Institutes of Health P41 RR004050 and P41GM103412 (to M. H. E.). The development of the UltraScan software is supported by National Science Foundation Grant ACI-1339649 (to B. D.). Supercomputer time allocations were provided by National Science Foundation Grant TG-MCB070039N (to B. D.).
This work was supported, in whole or in part, by National Institutes of Health Grant RO1 MH092906, National Science Foundation Grant MCB-1450895 (to D. C.), and Robert Wood Johnson Foundation Grant 67038 support of the Child Health Institute of New Jersey. The authors declare that they have no conflicts of interest with the contents of this article.
M. Franklin and M. Petoukhov, unpublished data.
- CASPR2
- contactin-associated protein-like 2
- LNS
- laminin, neurexin, sex hormone-binding globulin domains
- SAXS
- small angle x-ray scattering
- SEC
- size exclusion chromatography
- EM
- electron microscopy
- BLI
- bio-layer interferometry
- TAG-1
- transient axonal glycoprotein-1.
References
- 1. Poliak S., Gollan L., Martinez R., Custer A., Einheber S., Salzer J. L., Trimmer J. S., Shrager P., and Peles E. (1999) Caspr2, a new member of the neurexin superfamily, is localized at the juxtaparanodes of myelinated axons and associates with K+ channels. Neuron 24, 1037–1047 [DOI] [PubMed] [Google Scholar]
- 2. Poliak S., Salomon D., Elhanany H., Sabanay H., Kiernan B., Pevny L., Stewart C. L., Xu X., Chiu S. Y., Shrager P., Furley A. J., and Peles E. (2003) Juxtaparanodal clustering of Shaker-like K+ channels in myelinated axons depends on Caspr2 and TAG-1. J. Cell Biol. 162, 1149–1160 [DOI] [PMC free article] [PubMed] [Google Scholar]
- 3. Traka M., Goutebroze L., Denisenko N., Bessa M., Nifli A., Havaki S., Iwakura Y., Fukamauchi F., Watanabe K., Soliven B., Girault J. A., and Karagogeos D. (2003) Association of TAG-1 with Caspr2 is essential for the molecular organization of juxtaparanodal regions of myelinated fibers. J. Cell Biol. 162, 1161–1172 [DOI] [PMC free article] [PubMed] [Google Scholar]
- 4. Tzimourakas A., Giasemi S., Mouratidou M., and Karagogeos D. (2007) Structure-function analysis of protein complexes involved in the molecular architecture of juxtaparanodal regions of myelinated fibers. Biotechnol. J. 2, 577–583 [DOI] [PubMed] [Google Scholar]
- 5. Strauss K. A., Puffenberger E. G., Huentelman M. J., Gottlieb S., Dobrin S. E., Parod J. M., Stephan D. A., and Morton D. H. (2006) Recessive symptomatic focal epilepsy and mutant contactin-associated protein-like 2. New Engl. J. Med. 354, 1370–1377 [DOI] [PubMed] [Google Scholar]
- 6. Jackman C., Horn N. D., Molleston J. P., and Sokol D. K. (2009) Gene associated with seizures, autism, and hepatomegaly in an Amish girl. Pediatr. Neurol. 40, 310–313 [DOI] [PubMed] [Google Scholar]
- 7. Falivelli G., De Jaco A., Favaloro F. L., Kim H., Wilson J., Dubi N., Ellisman M. H., Abrahams B. S., Taylor P., and Comoletti D. (2012) Inherited genetic variants in autism-related CNTNAP2 show perturbed trafficking and ATF6 activation. Hum. Mol. Genet. 21, 4761–4773 [DOI] [PMC free article] [PubMed] [Google Scholar]
- 8. Kastriti M. E., Sargiannidou I., Kleopa K. A., and Karagogeos D. (2015) Differential modulation of the juxtaparanodal complex in multiple sclerosis. Mol. Cell. Neurosci. 67, 93–103 [DOI] [PubMed] [Google Scholar]
- 9. Ranscht B. (1988) Sequence of contactin, a 130-kDa glycoprotein concentrated in areas of interneuronal contact, defines a new member of the immunoglobulin supergene family in the nervous system. J. Cell Biol. 107, 1561–1573 [DOI] [PMC free article] [PubMed] [Google Scholar]
- 10. Faivre-Sarrailh C., Gauthier F., Denisenko-Nehrbass N., Le Bivic A., Rougon G., and Girault J. A. (2000) The glycosylphosphatidyl inositol-anchored adhesion molecule F3/contactin is required for surface transport of paranodin/contactin-associated protein (caspr). J. Cell Biol. 149, 491–502 [DOI] [PMC free article] [PubMed] [Google Scholar]
- 11. Rios J. C., Melendez-Vasquez C. V., Einheber S., Lustig M., Grumet M., Hemperly J., Peles E., and Salzer J. L. (2000) Contactin-associated protein (Caspr) and contactin form a complex that is targeted to the paranodal junctions during myelination. J. Neurosci. 20, 8354–8364 [DOI] [PMC free article] [PubMed] [Google Scholar]
- 12. Puzzo D., Bizzoca A., Privitera L., Furnari D., Giunta S., Girolamo F., Pinto M., Gennarini G., and Palmeri A. (2013) F3/Contactin promotes hippocampal neurogenesis, synaptic plasticity, and memory in adult mice. Hippocampus 23, 1367–1382 [DOI] [PubMed] [Google Scholar]
- 13. Koch T., Brugger T., Bach A., Gennarini G., and Trotter J. (1997) Expression of the immunoglobulin superfamily cell adhesion molecule F3 by oligodendrocyte-lineage cells. Glia 19, 199–212 [DOI] [PubMed] [Google Scholar]
- 14. Parent A. S., Mungenast A. E., Lomniczi A., Sandau U. S., Peles E., Bosch M. A., Rønnekleiv O. K., and Ojeda S. R. (2007) A contactin-receptor-like protein tyrosine phosphatase β complex mediates adhesive communication between astroglial cells and gonadotrophin-releasing hormone neurones. J. Neuroendocrinol. 19, 847–859 [DOI] [PubMed] [Google Scholar]
- 15. Çolakoǧlu G., Bergstrom-Tyrberg U., Berglund E. O., and Ranscht B. (2014) Contactin-1 regulates myelination and nodal/paranodal domain organization in the central nervous system. Proc. Natl. Acad. Sci. U.S.A. 111, E394–403 [DOI] [PMC free article] [PubMed] [Google Scholar]
- 16. Lamprianou S., Chatzopoulou E., Thomas J. L., Bouyain S., and Harroch S. (2011) A complex between contactin-1 and the protein tyrosine phosphatase PTPRZ controls the development of oligodendrocyte precursor cells. Proc. Natl. Acad. Sci. U.S.A. 108, 17498–17503 [DOI] [PMC free article] [PubMed] [Google Scholar]
- 17. Poliak S., Gollan L., Salomon D., Berglund E. O., Ohara R., Ranscht B., and Peles E. (2001) Localization of Caspr2 in myelinated nerves depends on axon-glia interactions and the generation of barriers along the axon. J. Neurosci. 21, 7568–7575 [DOI] [PMC free article] [PubMed] [Google Scholar]
- 18. Comoletti D., Grishaev A., Whitten A. E., Tsigelny I., Taylor P., and Trewhella J. (2007) Synaptic arrangement of the neuroligin/β-neurexin complex revealed by x-ray and neutron scattering. Structure 15, 693–705 [DOI] [PMC free article] [PubMed] [Google Scholar]
- 19. Reeves P. J., Callewaert N., Contreras R., and Khorana H. G. (2002) Structure and function in rhodopsin: high-level expression of rhodopsin with restricted and homogeneous N-glycosylation by a tetracycline-inducible N-acetylglucosaminyltransferase I-negative HEK293S stable mammalian cell line. Proc. Natl. Acad. Sci. U.S.A. 99, 13419–13424 [DOI] [PMC free article] [PubMed] [Google Scholar]
- 20. Comoletti D., Flynn R. E., Boucard A. A., Demeler B., Schirf V., Shi J., Jennings L. L., Newlin H. R., Südhof T. C., and Taylor P. (2006) Gene selection, alternative splicing, and post-translational processing regulate neuroligin selectivity for β-neurexins. Biochemistry 45, 12816–12827 [DOI] [PubMed] [Google Scholar]
- 21. Gasteiger E., Hoogland C., Gattiker A., Duvaud S., Wilkins M. R., Appel R. D., and Bairoch A. (2005) The Proteomics Protocols Handbook (Walker J. M., ed) pp. 571–607, Humana Press, New York [Google Scholar]
- 22. Demeler B. (2010) Methods for the design and analysis of sedimentation velocity and sedimentation equilibrium experiments with proteins. Curr. Protoc. Protein Sci. Chapter 7, Unit 7.13 [DOI] [PMC free article] [PubMed] [Google Scholar]
- 23. Demeler B., and Gorbet G. (2016) Analytical Ultracentrifugation Data Analysis with UltraScan-III. Analytical Ultracentrifugation: Instrumentation, Software, and Applications, Springer, New York, in press [Google Scholar]
- 24. Brookes E., Cao W., and Demeler B. (2010) A two-dimensional spectrum analysis for sedimentation velocity experiments of mixtures with heterogeneity in molecular weight and shape. Eur. Biophys. J. 39, 405–414 [DOI] [PMC free article] [PubMed] [Google Scholar]
- 25. Demeler B., and van Holde K. E. (2004) Sedimentation velocity analysis of highly heterogeneous systems. Anal. Biochem. 335, 279–288 [DOI] [PubMed] [Google Scholar]
- 26. Brookes E., and Demeler B. (2006) Genetic algorithm optimization for obtaining accurate molecular weight distributions from Sedimentation velocity experiments. Analytical Ultracentrifugation VIII in Progress in Colloid Polymer Science (Wandrey C., and Cölfen H., eds) Vol. 131, pp. 78–82, Springer-Verlag, New York [Google Scholar]
- 27. Brookes E., and Demeler B. (2007) Parsimonious regularization using genetic algorithms applied to the analysis of analytical ultracentrifugation experiments. In GECCO '07 Proceedings of the 9th Annual Conference on Genetic and Evolutionary Computation, pp. 361–368, ACM, New York [Google Scholar]
- 28. Demeler B., and Brookes E. (2008) Monte Carlo analysis of sedimentation experiments. Colloid Polym. Sci. 286, 129–137 [Google Scholar]
- 29. Brookes E., and Demeler B. (2008) Parallel computational techniques for the analysis of sedimentation velocity experiments in UltraScan. Colloid Polym. Sci. 286, 138–148 [Google Scholar]
- 30. Durchschlag H. (1986) Thermodynamic data for biochemistry and biotechnology (Hinz H. J., ed) pp. 45–128, Springer-Verlag, New York [Google Scholar]
- 31. Jeffries C. M., Whitten A. E., Harris S. P., and Trewhella J. (2008) Small-angle x-ray scattering reveals the N-terminal domain organization of cardiac myosin binding protein C. J. Mol. Biol. 377, 1186–1199 [DOI] [PubMed] [Google Scholar]
- 32. Svergun D. I. (1992) Determination of the regularization parameter in indirect-transform methods using perceptual criteria. J. Appl. Crystallogr. 25, 495–503 [Google Scholar]
- 33. Krigbaum W. R., and Kügler F. R. (1970) Molecular conformation of egg-white lysozyme and bovine α-lactalbumin in solution. Biochemistry 9, 1216–1223 [DOI] [PubMed] [Google Scholar]
- 34. Svergun D. I. (1999) Restoring low resolution structure of biological macromolecules from solution scattering using simulated annealing. Biophys. J. 76, 2879–2886 [DOI] [PMC free article] [PubMed] [Google Scholar]
- 35. Franke D., Jeffries C. M., and Svergun D. I. (2015) Correlation map, a goodness-of-fit test for one-dimensional x-ray scattering spectra. Nat. Methods 12, 419–422 [DOI] [PubMed] [Google Scholar]
- 36. Valentini E., Kikhney A. G., Previtali G., Jeffries C. M., and Svergun D. I. (2015) SASBDB, a repository for biological small-angle scattering data. Nucleic Acids Res. 43, D357–D363 [DOI] [PMC free article] [PubMed] [Google Scholar]
- 37. Ohi M., Li Y., Cheng Y., and Walz T. (2004) Negative staining and image classification: powerful tools in modern electron microscopy. Biol. Proced. Online 6, 23–34 [DOI] [PMC free article] [PubMed] [Google Scholar]
- 38. Frank J., Radermacher M., Penczek P., Zhu J., Li Y., Ladjadj M., and Leith A. (1996) SPIDER and WEB: processing and visualization of images in 3D electron microscopy and related fields. J. Struct. Biol. 116, 190–199 [DOI] [PubMed] [Google Scholar]
- 39. Demeler B., Brookes E., Wang R., Schirf V., and Kim C. A. (2010) Characterization of reversible associations by sedimentation velocity with UltraScan. Macromol. Biosci. 10, 775–782 [DOI] [PMC free article] [PubMed] [Google Scholar]
- 40. Guinier A. (1939) La diffraction des rayons X aux tres petits angles; application a l'etude de phenomenes ultramicroscopiques. Ann. Phys. Paris 12, 161–237 [Google Scholar]
- 41. Petoukhov M. V., Franke D., Shkumatov A. V., Tria G., Kikhney A. G., Gajda M., Gorba C., Mertens H. D., Konarev P. V., and Svergun D. I. (2012) New developments in the program package for small-angle scattering data analysis. J. Appl. Crystallogr. 45, 342–350 [DOI] [PMC free article] [PubMed] [Google Scholar]
- 42. Volkov V. V., and Svergun D. I. (2003) Uniqueness of ab initio shape determination in small-angle scattering. J. Appl. Crystallogr. 36, 860–864 [DOI] [PMC free article] [PubMed] [Google Scholar]
- 43. Comoletti D., Miller M. T., Jeffries C. M., Wilson J., Demeler B., Taylor P., Trewhella J., and Nakagawa T. (2010) The macromolecular architecture of extracellular domain of alphaNRXN1: domain organization, flexibility, and insights into trans-synaptic disposition. Structure 18, 1044–1053 [DOI] [PMC free article] [PubMed] [Google Scholar]
- 44. Boucard A. A., Chubykin A. A., Comoletti D., Taylor P., and Südhof T. C. (2005) A splice code for trans-synaptic cell adhesion mediated by binding of neuroligin 1 to α- and β-neurexins. Neuron 48, 229–236 [DOI] [PubMed] [Google Scholar]
- 45. Abrahams B. S., Tentler D., Perederiy J. V., Oldham M. C., Coppola G., and Geschwind D. H. (2007) Genome-wide analyses of human perisylvian cerebral cortical patterning. Proc. Natl. Acad. Sci. U.S.A. 104, 17849–17854 [DOI] [PMC free article] [PubMed] [Google Scholar]
- 46. Miller M. T., Mileni M., Comoletti D., Stevens R. C., Harel M., and Taylor P. (2011) The crystal structure of the α-neurexin-1 extracellular region reveals a hinge point for mediating synaptic adhesion and function. Structure 19, 767–778 [DOI] [PMC free article] [PubMed] [Google Scholar]
- 47. Chen F., Venugopal V., Murray B., and Rudenko G. (2011) The structure of neurexin 1α reveals features promoting a role as synaptic organizer. Structure 19, 779–789 [DOI] [PMC free article] [PubMed] [Google Scholar]
- 48. van der Merwe P. A., and Barclay A. N. (1994) Transient intercellular adhesion: the importance of weak protein-protein interactions. Trends Biochem. Sci. 19, 354–358 [DOI] [PubMed] [Google Scholar]
- 49. Finci L. I., Krüger N., Sun X., Zhang J., Chegkazi M., Wu Y., Schenk G., Mertens H. D., Svergun D. I., Zhang Y., Wang J. H., and Meijers R. (2014) The crystal structure of netrin-1 in complex with DCC reveals the bifunctionality of netrin-1 as a guidance cue. Neuron 83, 839–849 [DOI] [PMC free article] [PubMed] [Google Scholar]
- 50. Bohne A., Lang E., and von der Lieth C. W. (1999) SWEET: WWW-based rapid 3D construction of oligo- and polysaccharides. Bioinformatics 15, 767–768 [DOI] [PubMed] [Google Scholar]