

Abstract
In this work, we demonstrate the viability of using our recently developed data analysis procedures for spherical nanoindentation in conjunction with Raman spectroscopy for studying lamellar-level correlations between the local composition and local mechanical properties in mouse bone. Our methodologies allow us to convert the raw load-displacement datasets to much more meaningful indentation stress–strain curves that accurately capture the loading and unloading elastic moduli, the indentation yield points, as well as the post-yield characteristics in the tested samples. Using samples of two different inbred mouse strains, A/J and C57BL/6J (B6), we successfully demonstrate the correlations between the mechanical information obtained from spherical nanoindentation measurements to the local composition measured using Raman spectroscopy. In particular, we observe that a higher mineral-to-matrix ratio correlated well with a higher local modulus and yield strength in all samples. Thus, new bone regions exhibited lower moduli and yield strengths compared to more mature bone. The B6 mice were also found to exhibit lower modulus and yield strength values compared to the more mineralized A/J strain.
Keywords: Bone, Nanoindentation, Raman spectroscopy
1. Introduction
Nanoindentation (Tabor, 1951; Fischer-Cripps, 2004) has proven to be a powerful technique for characterizing the local mechanical properties from small material volumes in a broad range of materials systems, including the study of micrometer and sub-micrometer sized domains in biological materials. The technique has been frequently used to characterize bone at the lamellar level (Ebenstein and Pruitt, 2006), allowing researchers to correlate local material properties with compositional information from similar length scales. Given that bone is a composite material whose mechanical performance is strongly dependent on the complex details of its internal hierarchical structure (Currey, 2003), it is a particularly challenging material to characterize, and many of the assumptions and limitations inherent in current methodologies have limited the potential of the technique for elucidating structure–property relationships in bone (Fan et al., 2002). In this paper we outline a new methodology for studying the lamellar level mechanical behavior of bone using spherical nanoindentation and novel indentation data analysis protocols. We validate the use of our methods by correlating the local mechanical data from indentation to the local composition information obtained from Raman spectroscopy in two genetically distinct inbred mouse strains.
Nanoindentation has been utilized extensively to study tissue level variation in mechanical properties of bone relative to animal age (Burket et al., 2011), tissue age and composition (Roschger et al., 2008; Donnelly et al., 2010; Zebaze et al., 2011), genetic background (Jiao et al., 2007; Miller et al., 2007; Bi et al., 2011) or even to assess the effects of specific diseases (Fan et al., 2007) or treatment conditions (Bala et al., 2011). These studies have shown mixed results, with some showing support for relationships between local properties and variables affecting tissue composition (e.g. (Gourion-Arsiquaud et al., 2009; Burket et al., 2011)), and others not (Zebaze et al., 2011). To some extent, the potential of nanoindentation to elucidate such structure–property relationships in bone has been hampered by methodological limitations. Most of these studies have utilized sharp indenters such as Berkovich and cube corner tips for acquiring indentation data (Rho et al., 1998; Rho et al., 1999; Fan et al., 2002; Hengsberger et al., 2003; Oyen, 2006), though a minority, e.g. (Ferguson et al., 2003; Paietta et al., 2011) have utilized spherical tips. These sharper indenter tip geometries generally have a very small initial elastic regime, and estimations of modulus and hardness from these tests are thus typically based on the unloading segments of load-displacement curves (after some amount of elastic-plastic loading) under the assumption that the unloading segments are predominantly elastic (Oliver and Pharr, 1992,2004). Unfortunately, in many materials including bone, the indentation itself imposes additional local plastic deformation which alters the local microstructure and its properties. Thus property estimates from the unloading segment in these materials often reflect values which have been changed by the experiment itself. Moreover, these traditional analysis methodologies also limit interpretations of bone properties only to its (unloading) elastic realm, and do not provide information about the initial elastic limit (i.e. yield) or post-elastic behavior.
We follow a fundamentally different approach in our current study. Here we utilize our newly developed data analysis procedures for spherical nanoindentation that transform the entire load-displacement dataset, including both the loading and the unloading segments, into much more meaningful indentation stress–strain curves (Kalidindi and Pathak, 2008; Pathak et al., 2009b). The use of these indentation stress–strain curves makes it possible to analyze the initial loading segments of spherical indentation, thereby allowing us to obtain measures of elastic modulus and indentation yield strength of the material prior to the damage induced by the indentation itself. The ability to produce indentation stress–strain curves has generally been more successful with spherical indenters (Field and Swain, 1993; Angker and Swain, 2006; Basu et al., 2006), where their relatively smoother stress fields and larger initial elastic segments (compared to sharper indenters) allow one to follow the evolution of the mechanical response in the material, from initial elasticity to the initiation of plasticity to post-yield behavior at finite plastic strains. These new procedures have successfully captured a wealth of information about the material including the elastic moduli measured in loading and unloading segments (Kalidindi and Pathak, 2008; Pathak et al., 2008a,2009b), the elastic limit (which can be identified as yielding in metallic samples (Pathak et al., 2009d,2011b) or buckling in a high aspect ratio material like vertically aligned carbon nanotube forests (Pathak et al., 2009a)), and aspects of the post-elastic behavior (Pathak et al., 2009d,2011b). In this paper, we apply these methods to indentations in bone and demonstrate their potential in correlating the changes in bone's local mechanical properties to its underlying structure.
The primary objectives of this study are to (1) demonstrate the applicability of our analysis procedures to the study of bone's mechanical properties at the micron to sub-micron length scales and to (2) demonstrate the viability of these procedures for characterizing complex relationships between mineral/matrix variation and tissue-level mechanical properties in bone. To achieve these objectives, we utilized cortical bone samples obtained from two genetically inbred mouse strains with known intra-strain variability (Jepsen et al., 2001) and whole bone biomechanical properties (Jepsen et al., 2003). These animal models represent an important tool for studying the local mechanical properties of bone (Rosen et al., 2001; Beamer et al., 2002). In particular, the two strains chosen for this work, A/J and C57BL/6J (B6), have been shown to significantly differ in their matrix mineralization and whole bone brittleness, and exhibited the strongest differences in their composition and tissue-level responses in preliminary studies (Jepsen et al., 2001,2003; Price et al., 2005; Tommasini et al., 2005). Aided by a detailed knowledge of the growth patterns in these mouse strains (Price et al., 2005), which allow us to readily select specific areas of the bone cortex representing regions of older and newer bone deposition, we aim to study the relationship to bone's local mechanical properties obtained from nanoindentation to its local compositional information given by Raman spectroscopy. The use of these combined techniques enable us to examine the correlations between mineral to matrix ratio and local mechanical properties in order to demonstrate what the variations in local mechanical properties of bone reflect in terms of tissue composition at a similar (micron to sub-micron) length scale.
2. Experimental
2.1. Sample preparation
Samples of femora were obtained from A/J and C57BL/6J (B6) inbred mouse strains at 16 weeks of age. Following the procedure detailed in (Jepsen et al., 2001), A/J and B6 mice were purchased from Jackson Laboratory (Bar Harbor, ME, USA) at 4–6 weeks of age. The mice were fed a standard mouse chow (Teklad 8664; Harlan, Indianapolis, IN, USA) ad libitum, kept on a 12-h light/dark cycle, and housed with 5 mice per cage at the Department of Orthopedics in Mount Sinai School of Medicine (MSSM), NY. All mice were sacrificed at 16 weeks of age at a time when the long bones are at peak bone mass with minimal rate of bone growth (Price et al., 2005). Two femur samples from the A/J strain (numbered A/J-3 and A/J-5) and three from the B6 strain (B6-4, B6-5 and B6-10) were chosen for testing.
Femoral samples were immediately harvested and manually cleaned of soft tissue, then fixed in 70% ethanol, dehydrated in ascending grades of ethanol and embedded in polymethyl-methacrylate (PMMA). Tissue blocks were obtained by sectioning the bones transversely beginning immediately distal to the third trochanter. The superior surface of each block was prepared for nanoindentation testing by grinding with increasingly fine sandpapers up to 1200 grit, and polishing by means of a series of napped cloth impregnated with diamond pastes, finishing with a grain size of 0.05 μm. The samples were cleansed in a distilled water ultrasonic bath after each successive step. The above preparation procedure is summarized schematically in Fig. 1.
Fig. 1.
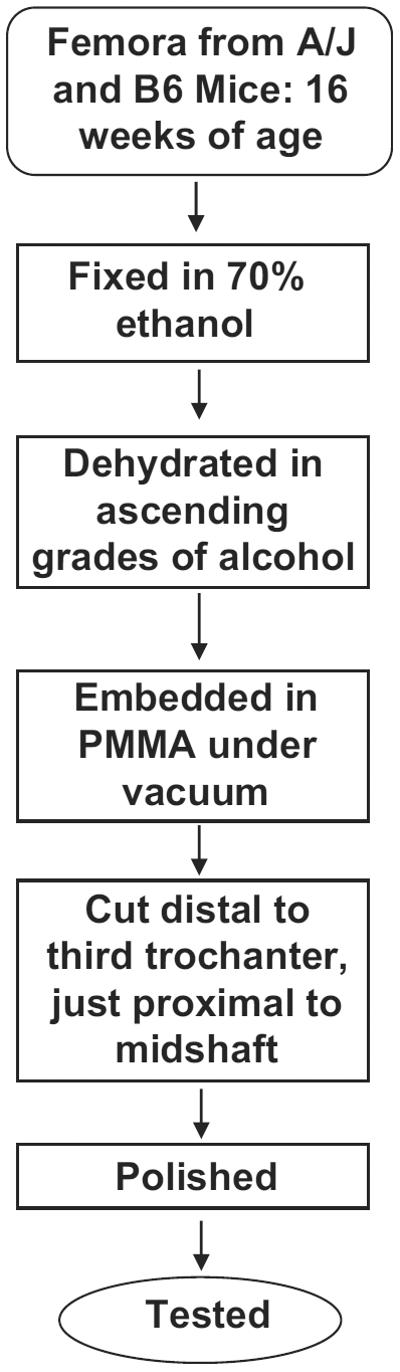
Flow diagram for the procedure for preparation of `dry'/dehydrated-embedded mouse bone samples for indentation and Raman testing.
Each polished, embedded block was imaged using a Leica TCS SP2 Laser Scanning Spectral Confocal Microscope (Leica Microsystems Inc., Bannockburn, IL), then carbon coated and imaged using backscattered electron microscopy (BSEM) (following the methods of Goldman et al. (2003)) with an Amray 1845 field emission scanning electron microscope (FE-SEM) with 4pi digital interface (SEMTech, North Billerica, MA). Quantitative data from these images are not reported in this paper—rather the images are used here for illustrative purposes only.
2.2. Areas of interest
One of the main reasons for choosing the two particular strains of mice (A/J and B6) is that their bone growth patterns are well studied and understood (Price et al., 2005). At 16 weeks of age, these mouse femora are still in the state of being actively modeled (Beamer et al., 1996; Price et al., 2005) with new bone being deposited along its inner (endosteal) and outer (periosteal) surfaces. Mineralization data indicates that inter-strain differences have clearly been established by this time (Price et al., 2005). Specifically, these mice experience a particular pattern of cortical drift (as illustrated in Fig. 2) in which they tend to add new bone endosteally along their antero-medial (AM) cortex and periosteally along their postero-lateral (PL) cortex. Previous studies have demonstrated that the growing mice mineralize their bone quickly, though the intrinsic stiffness of the bone lags behind (Miller et al., 2007). Owing to this growth pattern, the chemical composition, and hence the mechanical properties, are expected to differ between regions of newly formed bone at the surface relative to the older bone matrix intracortically in these particular cortices. We chose one of these sites (the AM cortex) for our study. Here the newest bone is present closest to the endosteal surface, while the bone is more mature as we proceed away from this surface (see Fig. 2).
Fig. 2.

For indentation testing the mouse femura were sectioned transversely, distal to the third trochanter. During postnatal growth, bone is deposited (double arrows) and resorbed (single arrows) at different sites around these regions of the femoral cortex resulting in a net cortical drift (large arrow). Spherical nanoindents (shown as blue dots in the SEM image) at the antero-medial (AM) cortex thus probe newer bone closer to the endosteal edge while the bone is more mature away from this surface. Three rows of indentations were performed on each sample. The region surrounding the indents was then mapped by Raman Spectroscopy (shown by the red grid around the indented region). (For interpretation of the references to color in this figure legend, the reader is referred to the web version of this article.)
2.3. Spherical nanoindentation
Nanoindentations were carried out using a nanoindenter (MTS XP® System equipped with the CSM attachment) with a 1 and 13.5 μm radius spherical diamond tip to a nominal depth of 300 nm and then unloaded after a 10 s hold at the maximum load. Starting at the edge of the endosteal surface of the AM cortex and proceeding radially outwards, three rows of indentations, with 15 indents in each row, were performed on each sample as shown in Fig. 2. The spacing between two successive indents was maintained at 10 μm. This distance is around 5 times the maximum indentation radius in our tests, thus minimizing any proximity effects. Indents that landed on any pores, cracks etc. on the sample surface were not included in the data analysis. The region surrounding the indents was mapped by Raman spectroscopy (shown by the red grid around the indented region in Fig. 2), as detailed in the next section. Indentation stress–strain curves were produced for all the indents using the methods described below.
A variety of different techniques exist for extracting indentation stress–strain curves using both analytical (Field and Swain, 1993; Basu et al., 2006) and finite element (Taljat et al., 1998; Stauss et al., 2003; Beghini et al., 2006; Pelletier, 2006) methods, with recent reports suggesting their successful applications on biomaterials (dental hard tissue samples (Angker and Swain, 2006)) as well. In this work we followed the two-step approach outlined in Kalidindi and Pathak (2008) for generating indentation stress–strain curves from the measured nanoindentation load-displacement data. The first step in this process involves an accurate estimation of the point of effective initial contact in the given data set, i.e. a clear identification of a zero-point that makes the measurements in the initial elastic loading segment consistent with the predictions of Hertz's theory (Hertz, 1896; Love, 1939). The expected relationship between the measured load signal, , the measured displacement signal, , and the continuous stiffness measurement, S, in the initial elastic loading segment in the spherical indentation of a flat isotropic sample surface is expressed as (Kalidindi and Pathak, 2008)
| (1) |
where P* and h* denote the values of the load and displacement signals at the point of effective initial contact. A linear regression analysis was used to establish the point of effective initial contact (P* and h*) in the indentation experiment.
The procedure described above is illustrated in Fig. 3(a) for a sample of A/J mouse bone indented with a 13.5 μm radius spherical indenter. In this figure, the portion of the initial loading data segment found to be in excellent agreement with Eq. (1) is clearly marked (in blue). The segment before this is probably influenced by various surface artifacts (such as surface roughness, non-ideal indenter shape etc.), while the segment following this segment (not shown in the figure) deviates substantially from the linear relationship shown in the figure, as it is likely influenced by inelastic deformation in the sample. The values of P* and h* were determined from a linear regression analysis of this highlighted segment and is shown in Fig. 3(b). We also utilize the excellent agreement of this data segment to Hertz' theory (later in Eq. (2)) in order to calculate the indentation modulus of the sample during loading.
Fig. 3.

(a) Identification of the effective zero-point following the linear regression analysis method described in Kalidindi and Pathak (2008) for A/J mouse femur sample indented with a 13.5 μm radius spherical indenter. The measured (b) load-displacement curve and the extracted (c) indentation stress–strain curves for bone using two different estimates of the zero-point. The inset in (b) shows the two different estimates of the zero-point: C1—zero point given by the machine and C2—effective zero point determined using Kalidindi and Pathak (2008). (c) The use of the zero-point established by the default procedure in the machine (C1) results in considerable noise in the initial elastic loading portion of the curve. When the effective zero point (C2) is determined using Kalidindi and Pathak (2008), much better indentation stress–strain curves are obtained. (d) Schematic of a spherical indentation showing the primary zone of indentation (described in detail in Kalidindi and Pathak (2008)). (For interpretation of the references to color in this figure legend, the reader is referred to the web version of this article.)
A major advantage of Eq. (1) is that this approach identifies an `effective' or virtual point of initial contact, and not necessarily the actual point of initial contact. The concept of an effective point of initial contact allows us to de-emphasize any artifacts created at the actual initial contact by the unavoidable surface conditions (e.g. surface roughness) and imperfections in indenter shape. This is specially advantageous in the case of the mechanically polished bone samples used in this study which tend to have a higher degree of surface roughness, as compared to the electro-polished metal surfaces shown in our previous works (Kalidindi and Pathak, 2008; Pathak et al., 2009c,2009d). Thus larger corrections were needed for the displacement signal during indentation in bone (h* =10–15 nm) than the corresponding ones in well-prepared (i.e. electro-polished where h* ~5 nm) metal samples.
Fig. 3(b) shows the point of initial contact as identified by the default procedure in the MTS software (C1) and by the procedure described above (C2). In the default procedure, C1 is generally determined as the point at which the S signal first reaches or exceeds 200 N/m (the value for S is generally negative before indenter is in contact with the specimen). Thus, to arrive at C2, the load signal in Fig. 3(b) needed to be moved by about P*=0.094 mN and the displacement signal by about h*=13.2 nm with respect to C1.
In the second step, Hertz's theory (Hertz, 1896; Love, 1939) is recast in the following set of equations for frictionless, elastic, spherical indentation in order to generate indentation stress–strain curves (see also (Kalidindi and Pathak, 2008; Pathak et al., 2008a))
| (2) |
where σind and εind are the indentation stress and the indentation strain, a is the radius of the contact boundary at the indentation load P, he is the elastic indentation depth, S is the elastic stiffness described earlier, Reff and Eeff are the effective radius and the effective stiffness of the indenter and the specimen system, ν and E are Poisson's ratio and Young's modulus, and the subscripts s and i refer to the specimen and the indenter, respectively. Expressing Hertz's theory in this form allows us to extract more reliable and meaningful indentation stress–strain curves, compared to any of the other analysis procedures being used in current literature. In general, the data analysis methods of extracting indentation stress–strain curves have been more successful with spherical indenters compared to sharper indenters (Pathak et al., 2008b), which might be attributed to their relatively smoother stress fields. Fig. 3(c) shows the indentation stress–strain curve derived from the load-displacement data in Fig. 3(b) using the protocol outlined above and compares it to the plot using the machine generated zero point (C1). Note that the initial elastic and yield sections are much better resolved when the zero point is determined using the procedure described above (instead of using the default procedure in the MTS software). The value of the indentation stress at 0.2% offset strain was recorded as the indentation yield strength, Yind, in this work as shown in Fig. 3(c). A Poisson's ratio of νs=0.3 was used for bone.
We emphasize here that the indentation strain definition used in Eq. (2) is substantially different from the a/Reff definition used in many prior studies (Field and Swain, 1993; Swain, 1998; Barsoum et al., 2003; Basu et al., 2006). Our recent study provides the rationale for this new definition of indentation strain (Kalidindi and Pathak, 2008). Briefly, it is pointed out here that a/Reff, or the more commonly used a/Ri, lacks any reasonable physical interpretation as a strain measure (traditionally defined as the ratio of change in length over the initial length of a selected line segment in a region of interest in the sample). The new definition of indentation strain presented in Eq. (2) is tantamount to idealizing the primary zone of indentation deformation as being equivalent (in an average sense) to compressing by he (same as the total indentation depth, ht, for elastic indentation) a cylindrical region of radius a and height 2.4a (see Fig. 3(d)). For the more general case of elastic-plastic indentations (Kalidindi and Pathak, 2008; Pathak et al., 2008a), we suggest the use of (ht)/(2:4a) as the definition of indentation strain.
We also note that the nanoindentation data analysis techniques described above are limited by the inherent assumptions of Hertz theory, which assumes an isotropic elastic material behavior. Bone, on the other hand, demonstrates considerable anisotropy due to the hierarchical design of its microstructure (Swadener et al., 2001). Therefore the measurements of indentation moduli and indentation yield strength reported in this paper should instead be treated as their equivalent isotropic values.
Conventional hardness values during indentation were calculated from the unloading sections of the load-displacement data. Spherical indentation hardness in this case is defined as the contact stress before unloading, i.e. , where Pmax is the maximum load before unloading, and aunload is the contact radius calculated from the unloading portion of the curve (Oliver and Pharr, 1992).
2.4. Raman micro-spectroscopy
A Renishaw 1000 Raman micro spectrometer using a semiconductor diode excitation laser operating at 785 nm was employed in this study. The near-IR, 785 nm wavelength `red' laser was used in order to eliminate the auto-fluorescence of bone proteins (Carden and Morris, 2000). The 50× objective lens (NA=0.75) provided a laser spot size of approximately 2 μm. A Renishaw silicon piece was used for x-calibration of the wavenumbers of the Raman spectra with a sensitivity of less than 1 cm−1. Raman mapping was conducted over a 70 μm×70 μm area (instrument limit) using the spherical indents as markers. As seen in Figs. 2 and 5 the Raman grid had a finer spacing (5 μm) between adjacent mapping points (as compared to the 10 μm spacing between indents), and completely overlapped the spherical indents. Care was taken to ensure that no laser spot was focused directly on top of an indent, in order to avoid loss of focus and to avoid scanning bone damaged by indentation stresses. Spectra were taken point by point in extended mode from 750 to 1800 cm−1 using a grating of 1200 I/mm with a 60 s detector interrogation time for each scan.
Fig. 5.

Representative BSEM images (top images) and 2D surface maps of the mineral-to-matrix ratios (defined as the phosphate to CH2 wag peak intensity ratio, bottom images) across a 40 μm×70 μm region close to the endosteal edge of the AM cortex in two representative (a) A/J and (b) B6 samples. The white circles denote the approximate size and location of the indentation tests in relation to the Raman maps.
Data analysis for Raman was performed using the Wire 2.0 Software. The spectra were divided into different sub regions for analysis based on methods used by Timlin et al. (1999). The first region was from 750–1150 cm−1 which contains bands arising from vibrations of the mineral component of bone, and the second region from 1170–1800 cm−1 which contains mostly bands of bone matrix. This pre-processing step reduced background effects and focused on the regions of the spectra where the signal is due to mineral or matrix. After separation into the two sub regions, mineral and matrix, the data was further analyzed to subtract the background fluorescence using a baseline curve fit.
Compositional characteristics of bone can be obtained from peak intensities of the recorded spectrum (Akkus et al., 2004). Peak intensity of the phosphate, carbonate, monohydrogen phosphate, Amide I and CH2 wag bands were analyzed (see Fig. 4). Phosphate to monohydrogen phosphate and phosphate to carbonate peak intensity ratios were assessed to investigate differences in impurities between strains. The mineral to matrix ratio, which relates to bone mineralization (Boskey et al., 1992), was determined using the phosphate to CH2 wag peak intensity ratio. Note that both the phosphate to CH2 wag peak intensity ratio and the phosphate to Amide I band intensity ratio can be used to quantify the mineral to matrix ratio. The CH2 wag was preferred over the Amide I band for two reasons: (i) the CH2 wag band was more distinguishable in the Raman spectra (ii) ethanol fixation methods have been known to alter the Amide I band intensity, while the CH2 wag intensity band is minimally affected by ethanol fixation (Yeni et al., 2006). However, PMMA bands do overlap the CH2 wag band (Fig. 4). The PMMA contributions were considered minimal since the strongest peak of PMMA at ~820 cm−1 is minimally observed in the bone spectra; the peak intensity ratio of the peak of interest in bone to PMMA was about 0.05. Therefore, it is reasonable to assume that the effects of the PMMA band on the CH2 band peak intensity are negligible. No extra processing steps were taken to eliminate the minor effects of PMMA on the spectra.
Fig. 4.

Comparison of typical Raman spectra obtained from bone embedded in PMMA vs. the spectra obtained only from PMMA.
3. Results
Representative BSEM images of the A/J and B6 femur sections at 16 weeks of age are shown in Fig. 5(a) and (b) respectively. These images summarize two important morphological differences between the femora of the two mouse strains (Jepsen et al., 2001; Price et al., 2005): the A/J femora have a smaller diameter and a correspondingly smaller moment of inertia (i.e. bone tissue is distributed closer to the center of the bone) as compared to the B6, while the B6 have a smaller cortical thickness with respect to A/J. Prior work by Jepsen et al. (Jepsen et al., 2001; Price et al., 2005) has also reported that A/J and B6 femora do not differ significantly in terms of their cortical areas. This would indicate that the same amount of bone tissue is distributed differently in these two strains. The images also demonstrate our region of interest (near the endosteal edge of the AM cortex) for obtaining Raman and indentation maps. Illustrative examples of the Raman area maps of the mineral-to-matrix ratios for two samples of each strain (numbered A/J-3, A/J-5 and B6-4, B6-5 respectively) are shown below the BSEM images.
Two important trends are evident from the Raman measurements shown in Fig. 5. First, both mouse strains show smaller values of the mineral-to-matrix ratio close to the endosteal edge, with the values increasing progressively away from the edge. Second, at a similar distance from the endosteal edge, the A/J mice demonstrate higher values of the mineral-to-matrix ratio than the B6 mice, a trend that suggests a larger degree of mineralization in the A/J femur than in the B6 at a similar distance into the cortex.
Fig. 6 shows representative indentation load displacement (Fig. 6a) and indentation stress–strain curves (Fig. 6b) for the two mouse strains. Tests from two indent locations in each strain are shown as examples of the material behavior close to (at a distance of around 12 μm) and far (around 42 μm) from the endosteal edge. These representative indents help demonstrate a similar trend to that of the Raman measurements; thus the bone tissue close to the endosteal edge shows lower sample modulus (Es) and indentation yield (Yind) values, while both these values increase as the indenter probes more intracortical regions. The A/J mice also demonstrate larger values of Es and Yind than the B6 at similar locations. As detailed earlier in Fig. 3, Es in these figures is calculated from the initial loading segment of the indentation experiment while Yind is calculated using a 0.2% offset strain. Note that these differences are better captured by the indentation stress–strain curves in Fig. 6(b) than they are by the raw load-displacement data in Fig. 6(a). The A/J mouse bone also appears to show a higher hardening tendency in their post-yield region than the B6.
Fig. 6.

Representative (a) load-displacement and (b) indentation stress–strain curves from A/J and B6 femur samples showing the differences in mechanical response between regions near and far from the endosteal edge of the respective AM cortices, (b) also shows our procedure for calculating Yind at 0.2% offset strain from the indentation stress–strain curves.
The trends shown in the Raman and the spherical nanoindentation measurements are illustrated further in Fig. 7, where the mineral-to-matrix ratios across a representative row of indents (the top rows) in A/J-5 and B6-5 are plotted along with the associated sample indentation modulus Es and the indentation yield Yind values. These data suggest that both the local chemical composition (in terms of the mineral-to-matrix ratio) and the local mechanical behavior (Es and Yind) of bone follow a similar pattern as a function of distance from the endosteal edge. Thus a lower mineral to matrix ratio close to the edge results in a lower indentation modulus and yield behavior at similar locations, while all three increase with increasing distances from the edge before stabilizing at their higher values. Concurrently, at a similar distance from the endosteal edge the A/J mouse is seen to exhibit a slightly higher response for all three parameters as compared to B6.
Fig. 7.

Variations of the mineral-to-matrix ratios across a representative row of indents (the top rows shown in Fig. 5) in (a) A/J sample #5 and (b) B6, sample #5 mouse femora as a function of their associated sample indentation modulus (Es, from the loading segment) and the indentation yield (Yind) values.
Both Figs. 5 and 7 also demonstrate another prominent difference between the two mouse strains: not only does the A/J mouse appear to reach a higher mineral-to-matrix ratio (and correspondingly higher Es and Yind) than B6, this increase happens over a much shorter distance from the endosteal edge in A/J than it does in B6. For example, Fig. 5 shows that the two A/J samples (A/J-3 and A/J-5) both reach a relatively high mineral to matrix ratio of P/CH2=10 within a short distance of 10 μm from the endosteal edge, whereas the corresponding distance for the two B6 samples (B6-4 and B6-5) shows a much wider spread and is much longer (around 10–40 μm).
Fig. 8 summarizes all the indentation results shown previously in Fig. 5, along with their associated Raman measurements. In addition Fig. 8 also contains data from two rows of indents on a third B6 sample (B6-10, shown using green symbols in Fig. 8), which is described in the next section. Fig. 8(a) shows a scatter plot of the elastic modulus, measured from the initial loading segment of the indentation stress–strain curves (shown earlier in Figs. 3 and 6), as a function of the mineral-to-matrix ratio measured by Raman spectroscopy. The variables in this figure show a strong, approximately linear, relationship, although some outliers do exist at the lower values. Since the A/J samples show a much more rapid increase in their mineral-to-matrix ratio (seen before in Figs. 5 and 7), there are far fewer data points for A/J in the mid-section of the scatter plot, as compared to B6. The A/J mouse samples also show the highest values of both the modulus and the mineral-to-matrix ratio.
Fig. 8.

Scatter plots of (a) the elastic modulus Es measured from the initial loading segment of the indentation stress–strain curves, (b) Es calculated from the unloading portion of the load-displacement data, (c) indentation yield strength (Yind) and (d) indentation hardness at max load, all as functions of the mineral-to-matrix ratio measured by Raman spectroscopy across two A/J and three B6 samples. The data for the B6 #10 sample (marked in green) was taken from Fig. 9. The table in (e) shows the coefficient of determination (R2) values using both linear and exponential fits of the measured data. (For interpretation of the references to color in this figure legend, the reader is referred to the web version of this article.)
Fig. 8(b) illustrates the modulus data, this time calculated from the unloading portion of the load-displacement plot using the Oliver–Pharr technique (Oliver and Pharr, 1992), as a function of the mineral-to-matrix ratio. When contrasted with Fig. 8(a), the data in Fig. 8(b) shows a much weaker relationship between the two variables. In addition, modulus values from the unloading segments tend to be lower than the values from the loading segments.
Figs. 8(c) and (d) compare aspects of the post-elastic behavior of bone tissue under indentation to their local composition. Fig. 8(c) shows Yind, calculated at 0.2% offset strain, as a function of the mineral-to-matrix ratio across the two mouse strains. The figure shows a clear positive linear relationship between Yind and the mineral-to-matrix ratio, although the correlation is slightly weaker than that of the modulus measured from the loading segments. As in the case of the modulus data from Fig. 8(a), the values from the B6 sample are lower and they also show a wider range than A/J. In comparison, Fig. 8(d) shows the conventional hardness values as a function of the mineral-to-matrix ratio across the two mouse strains. As in the case of the modulus values, the hardness values also show a much weaker correlation compared to the Yind values calculated from the initial loading segment of the test.
The table in Fig. 8(e) explores the correlations, in terms of the coefficient of determination (R2) values, between the Raman and the indentation measurements (structure vs. property) made in this work on bone using both linear and exponential fits of the measured data. Our results demonstrate that data measured using the initial loading portions of the indentation tests (both Es from loading and Yind) show a much higher correlation with mineral to matrix ratio than those measured using the unloading curves (namely Es from unloading and the hardness). This is true for both linear and exponential fits to the data.
4. Discussion
4.1. Application of indentation stress–strain curves in bone
The use of spherical nanoindentation along with the indentation data analysis protocols described earlier (Eqs. (1) and (2)) allow for a reliable analysis of the lamellar level mechanical properties of bone. Our approach is fundamentally different from numerous other indentation studies on bone reported in literature for at least two reasons: (i) the values of the properties are extracted from the initial loading segment, and (ii) the calibrated area functions (Oliver and Pharr, 1992,2004) that are typically assumed to be universally applicable to all materials are not employed in our data analysis protocols. Since the values of the local indentation modulus (Es) and the local indentation yield strength (Yind) are extracted from the initial loading segment, it is expected that these values reflect accurately the properties of the intact material at the indentation site. When the indentation properties are extracted from the unloading segments (as typically done in most reported studies) they reflect the properties of the material subjected to additional plastic strain induced by the indentation itself. The distinct differences between calculating these values from the loading vs. the unloading segments are shown in Fig. 8. As shown in this figure, the values of indentation modulus and yield (Yind) calculated from the loading segments (Fig. 8(a) and (c)) show a higher correlation to bone's local composition than the values calculated from the unloading segments (Fig. 8(b) and (d)). It is important to recognize that the unloading is no longer from a flat sample surface, and thus the calculations of the contact area during unloading using calibrated area functions are affected by various inherent approximations (see (Kalidindi and Pathak, 2008) for a detailed review of the two analysis processes). The higher correlation between the local composition and the local mechanical properties extracted from the loading segments, as shown in the table in Fig. 8(e), further validate the data analysis techniques used in this work.
4.2. Relating bone's local composition to its local properties
At 16 weeks of age the A/J and B6 femora have reached their peak bone mass, and their rate of bone growth is minimal. It has been shown that the growth of the femora in these mouse strains up until this time is characterized by a pattern of cortical drift as illustrated in Fig. 2 (Beamer et al., 1996; Price et al., 2005). As seen in this figure, instead of a uniform expansion of the cortex around the periosteal or endosteal surfaces, bone formation and resorption takes place as a coordinated process across different bone surfaces (see the regions marked in Fig. 2). At the AM cortex (our area of investigation) this translates into a region of newer primary lamellar bone close to the endosteal surface, while the bone is more mature (older) away from this surface. The mice do not secondarily remodel their bones to form osteons, thus the progressive increase of the mineral-to-matrix ratios away from the endosteal edge seen in Fig. 5 is thus indicative of an increased maturity of the bone tissue in the more intracortical regions. Correspondingly, similar increasing trends in indentation modulus and Yind seen in Figs. 6–8 suggest a weaker, more compliant newer bone tissue close to the endosteal edge, which becomes stiffer and stronger as the bone matures.
Figs. 5–8 also indicate that this transition from newer to more mature (older) bone tissue happens over a shorter distance in A/J mice, than in B6. Moreover the A/J mice appear to have obtained a higher degree of mineralization in their femora, since they consistently show the highest local values of the mineral-to-matrix ratios in the intracortical regions, and correspondingly the highest local values of indentation modulus and Yind. These findings are in line with results from other researchers who have reported a similar higher tissue level mineral-to-matrix ratio as measured by Fourier transform infra-red imaging (FTIR) (Courtland et al., 2008,2009) and a significantly higher whole bone ash content (Jepsen et al., 2003) in A/J mouse relative to B6 mouse bones. When viewed together these results would seem to indicate that the bone tissues are compositionally non-identical between the femurs of the two mouse strains A/J and B6.
This strain-dependent difference is explained by using the hypothesis put forward in the works of the Jepsen et al., 2001,2003, who has suggested that the underlying causes for such differences in bone quality between the two strains can be traced to their whole bone morphologies and mechanical demands imposed by weight bearing. As mentioned before, the A/J femora have a smaller diameter and correspondingly a smaller moment of inertia compared to B6 (see Fig. 5), but they do not differ in their cortical areas (Jepsen et al., 2001,2003). This would have inevitably led to a less stiff structure in the A/J mice if the bone compositions were identical across the two mouse strains. By biologically coupling a change in their bone quality, in terms of a higher mineral-to-matrix ratio, the A/J mouse strain appears to have satisfied the increased mechanical demands imposed by their particular bone morphology. This is confirmed by whole bone mechanical tests comparing the two strains, where A/J femora are found to possess similar overall stiffness and strength values, in spite of their smaller moment of inertia, as compared to B6 (Jepsen et al., 2001). However this trade-off between the reduced diameter and an increased mineral content in the A/J mice is not without consequences—at the whole bone level the A/J femora were also found to have reduced toughness and they fracture in a more brittle manner than the B6 in whole bone bending tests (Jepsen et al., 2001,2003). Thus the increased mineral content in A/J femurs makes them mechanically robust in terms of stiffness (in that they are similar to B6), but weaker with regard to their post-yield behavior.
The results presented in this work also complement our previous report on the local viscoelastic behavior observed in the same general locations of the two mouse strains (Pathak et al., 2011a). Using dynamic nanoindentation techniques on hydrated femur bone tissues of A/J and B6 mice we demonstrated a trend towards a higher viscoelastic response closer to the endosteal edge of the AM cortex than away from it, while the response was also greater for the B6 samples as compared to A/J at a similar distance into the cortex. In light of the above discussion (Figs. 5–8) this suggests that bone having a lower mineral-to-matrix ratio (a higher collagen content) would demonstrate a trend towards a larger viscoelastic response, along with a lower stiffness and yield behavior.
The above trends compare favorably with a large number of studies that have shown a positive correlation between the modulus of bone, measured using nanoindentation, to its mineral content using Raman (Tai et al., 2005; Donnelly et al., 2010; Bi et al., 2011; Burket et al., 2011) and infrared spectroscopy (Miller et al., 2007; Gourion-Arsiquaud et al., 2009) as well as other techniques such as backscattered electron imaging (Ferguson et al., 2003; Roschger et al., 2008). Our work also stresses the need for a one-to-one correlation between the nanoindentation and Raman measurement sites, without which it is not possible to appropriately interpret small variations in local properties relative to structural variations at the same location (Bi et al., 2011). This information, combined with knowledge of tissue growth patterns and age, can make for more meaningful interpretations of property variations in the bone tissue.
While our small sample size (n=2 per strain), limits our ability to interpret these results statistically, the goal of the present work was to gauge the potential of our indentation data analysis technique in generating quantitative data on bone samples in conjunction with Raman spectroscopy measurements. We are currently extending this study to larger sample sizes to study these differences in a biological context.
In the remainder of this paper we discuss two more aspects of our validation studies to ensure that these factors did not contribute to an inconsistency in the nanoindentation data analysis process followed in this work: the effect of infiltration of bone with PMMA during the embedding process, and the possibility of pressure-induced structural changes in bone due to indentation.
4.3. Effect of embedding in PMMA
The sample preparation technique used for the mouse bone samples tested in this work includes dehydrating the samples and embedding the bone in PMMA before it is cut and polished (see Fig. 1). While dehydration of bone is known to cause a 15–30% increase in its modulus (Rho and Pharr, 1999; Hoffler et al., 2005), the embedding process can also lead to infiltration of the softer PMMA onto the harder bone samples. Since the infiltration is expected to be the heaviest at the sample edges (Rho et al., 1997), this could potentially affect our nanoindentation measurements which were conducted on the endosteal edge of the AM cortex in the mouse femora.
While it is a common practice to embed bone in resins such as PMMA for nanoindentation testing, a range of contrasting reports exist regarding the effects of such a process on nanoindentation results, namely modulus and hardness. Lewis and Nyman (2008) have reported the modulus of PMMA-embedded metacarpal horse bone samples to increase after embedding, while no significant difference in modulus was observed for canine trabeculae for a wide range of epoxies used (Mittra et al., 2006). However, the same study (Mittra et al., 2006) found that the hardness of the canine bone tissue was significantly affected by the stiffness and the viscosity of the embedding material, whereas Evans et al. (1990) report a negligible 4% increase in hardness of bone from multiple species after embedding. Since no consensus can be reached from the above mentioned studies, the effects of PMMA infiltration during embedding on the indentation stress–strain analysis used in this work were tested using the procedure described below.
A third B6 sample, numbered B6-10, was used for these tests as shown in Fig. 9. Two rows of indentations at varying angles to the endosteal edge were conducted on this sample (Fig. 9a); the indents in Row 1 were aligned almost normal to the endosteal edge, while those in Row 2 were at a much shallower angle. This arrangement allows more indents closer to the endosteal edge while still maintaining sufficient spacing between indents to prevent any interference from neighboring indents. Thus if PMMA penetration closer to the endosteal edge is indeed substantial, it stands to reason that the correlation between the mechanical properties (measured by indentation) and composition (from Raman measurements) would be weaker in this region. Raman mapping was conducted across the indents as shown in Fig. 9(b) and (c).
Fig. 9.

Effect of PMMA embedding. (a) Two rows of indentations at varying angles to the endosteal edge conducted on B6 #10 femur sample. (b) and (c): Raman mapping relative to the locations of the indents in rows 1 and 2 respectively.
The results from the B6-10 sample are summarized along with tests from the other A/J and B6 samples in Fig. 8, with the data for B6-10 being marked in green. As seen from this figure, most of the indents from the B6-10 sample follow the same trend as the other mouse samples used in this work—only the indent closest to the edge (indent #1 in row 2 for B6-10, at a distance of <2 μm from the edge) shows a lower-than-expected value of indentation modulus and Yind. This indicates that at distances greater than ~2 μm the effects of PMMA infiltration are negligible and can be ignored in these sample sets.
4.4. Pressure-induced structural changes in bone
The extremely high stresses expected under the indenter can induce two potential changes in the local structure of the bone: (i) densification of the bone locally under the indenter, and (ii) pressure-induced structural transformation in the bone mineral at the indentation site. For example, Carden et al. (2003) have studied the mechanical response of bone by conducting Oliver–Pharr analysis (Oliver and Pharr, 1992) on unloading segments obtained using a flat punch indenter. They have also studied the structural changes in their samples, before and after indentation, using Raman spectra. Their analysis suggests that the modulus of bone increased with increasing indentation depths. These authors attribute the increase in modulus to possible pressure-induced structural transformation in bone minerals.
There are at least two other possible explanations for the observations reported by Carden et al. (2003): (i) The observed increases in modulus might be a consequence of the data analysis protocols used by these authors. As noted earlier, the extraction of modulus from unloading segments can produce unreliable results. (ii) Indentation can result in densification of the porous material, which can in turn increase the local modulus at the indentation site.
In an effort to understand the possible structural changes induced by the indentation, a region of bone (from a C3H/HeJ mouse femur) was first indented with the 1 μm tip (up to a max depth of 250 nm) to evaluate the properties of the virgin or untouched surface (see Fig. 10a). Then the same region was indented with the larger diameter (13.5 μm) indenter up to a maximum depth of 5000 nm. Finally further indentations with the 1 μm spherical indenter (up to a max depth of 250 nm) were performed inside these larger indents. The objective of this exercise was to ascertain the properties of bone before and after indentation and check if indentation had any significant effect on the mineralization and/or porosity of mouse bone. Raman spectra were also taken by focusing the laser beam both before and after making the larger indents. In order to ensure that the entire laser beam in Raman was focused only inside the indent (so as to remove any possible contributions from the un-indented portions of the bone), some additional larger Vickers indents were made using a Vickers micro-hardness tester (LECO M-400) at a load of 0.5 kg for a period of 10 s. The Raman signals obtained from inside this large Vickers indent were assumed to be generated only by the material deformed by indentation pressure.
Fig. 10.

(a) Optical micrograph showing the locations where the smaller 1 μm indentations (not visible in the micrograph) were made inside larger 13.5 μm indents. The micrograph also shows the locations of the points from where the Raman spectra, shown in (b) were taken. (b) Comparison of Raman spectra taken from the center of the Vickers indent and away from the indent. (c) Comparison of indentation stress strain responses between indentations performed on the virgin surface and inside another (larger) indent.
As shown in Fig. 10(b), the Raman spectra collected from inside the indent are very similar to the ones from outside the indent. They do not show any shifts in position or changes in intensity. Phase transformation due to indentation pressure is known to produce changes in new peak (or peak shifts) in the Raman spectra for a variety of material systems and has been extensively reported in the literature (Ge et al., 2004; Juliano et al., 2004; Pathak et al., 2008b). No such phenomenon was observed in this case. Also the appearance of additional mineral factors in the indented region as reported by Carden et al. (2003) were not observed in the present study. These results negate any suggestions of a structural change due to indentation pressure.
Representative datasets for the nanoindentation response, for the virgin bone surface as well as for the case of indentation inside another (larger) indent are shown in Fig. 10(c). The indentation stress–strain curves for the two cases are fairly close to one another, suggesting similar mechanical properties for both cases. In particular, the modulus (~27 GPa) and the Yind values calculated from the initial loading segment in both these cases are the same. These results suggest the absence of any significant structural changes in bone due to the high stresses imposed by the indentation, either as phase transformation of minerals or as densification of porous material. The increase in modulus reported in Carden et al. (2003) is most likely due to the use of the unloading segments in the modulus calculations as well as the viscoelastic nature of bone. The primary components of bone are stiff, hydroxyapatite-like mineral and collagen. Because of the viscoelastic nature of collagen fibers in the bone matrix, bone itself has remarkable viscoelasticity (Fan and Rho (Oct 1, 2003)). An additional support for this conclusion stems from compression tests, where bone has been found to be stiffer and stronger at higher strain rates (Oyen and Cook, 2009).
5. Conclusions
In summary, we have demonstrated a novel way of characterizing the local mechanical behavior at the micron to sub-micron level in bone using spherical nanoindentation. This has been made possible by the combined use of Raman spectroscopy and our data analysis procedures for spherical nanoindentation which allow us to analyze the initial loading portion of the indentation stress–strain response. Using such structure–property correlations we show that bone with a higher mineral-to-matrix ratio demonstrates a trend towards a higher modulus and indentation yield strength. Thus regions of newer bone, with lower mineral-to-matrix ratios, are found to have lower local modulus and local indentation yield strength values than regions of older bone, and the B6 mouse strain exhibits a trend towards lower modulus values than the more mineralized A/J strain. No immediate evidence of any densification and/or phase transformations under the indenter was identified. The effect of PMMA infiltration in the embedded bone specimens was also found to be minimal. As such this study constitutes a crucial first step in the formulation of a rigorous framework for establishing multi scale structure–property linkages in bone.
Acknowledgments
This work was supported by grants from the National Institutes of Health (NIH AR044927). SK and SJV acknowledge funding from ARO grant W911NF-10-1-0409. SP and SJV acknowledge support from the 2007 and 2011 Sigma Xi Grants-in-Aid of Research (GIAR) program for this work, respectively. SP also gratefully acknowledges support from the W.M. Keck Institute for Space Studies Postdoctoral Fellowship program during the writing of this manuscript. The MTS XP® nanoindentation system and the Renishaw 1000 Raman micro spectrometer used in this study are maintained and operated by the Centralized Research Facilities in the College of Engineering at Drexel University. The authors also wish to thank Dr. Phil Nasser and Dr. Hayden-William Courtland (both at Mount Sinai School of Medicine, New York, NY) for assistance with sample preparation, as well as Dr. Zhorro Nikolov and Ms Melanie Patel (Drexel University) for help with Raman measurements.
references
- Akkus O, Adar F, Schaffler MB. Age-related changes in physicochemical properties of mineral crystals are related to impaired mechanical function of cortical bone. Bone. 2004;34(3):443–453. doi: 10.1016/j.bone.2003.11.003. [DOI] [PubMed] [Google Scholar]
- Angker L, Swain MV. Nanoindentation: application to dental hard tissue investigations. Journal of Materials Research. 2006;21(8):1893–1905. [Google Scholar]
- Bala Y, Depalle B, Farlay D, Douillard T, Meille S, Follet H, Chapurlat R, Chevalier J, Boivin G. Bone micromechanical properties are compromised during long-term alendronate therapy independently of mineralization. Journal of Bone and Mineral Research: The Official Journal of the American Society for Bone and Mineral Research. 2011 doi: 10.1002/jbmr.1501. http://dxdoi.org/10.1002/jbmr.1501. [DOI] [PubMed]
- Barsoum MW, Zhen T, Kalidindi SR, Radovic M, Murugaiah A. Fully reversible, dislocation-based compressive deformation of Ti3SiC2 to 1 GPa. Nature Materials. 2003;2(2):107–111. doi: 10.1038/nmat814. [DOI] [PubMed] [Google Scholar]
- Basu S, Moseson A, Barsoum MW. On the determination of spherical nanoindentation stress–strain curves. Journal of Materials Research. 2006;21(10):2628–2637. [Google Scholar]
- Beamer WG, Donahue LR, Rosen CJ. Genetics and bone. Using the mouse to understand man. Journal of Musculoskeletal and Neuronal Interactions. 2002;2(3):225–231. [PubMed] [Google Scholar]
- Beamer WG, Donahue LR, Rosen CJ, Baylink DJ. Genetic variability in adult bone density among inbred strains of mice. Bone. 1996;18(5):397–403. doi: 10.1016/8756-3282(96)00047-6. [DOI] [PubMed] [Google Scholar]
- Beghini M, Bertini L, Fontanari V. Evaluation of the stress–strain curve of metallic materials by spherical indentation. International Journal of Solids and Structures. 2006;43(7–8):2441–2459. [Google Scholar]
- Bi X, Patil CA, Lynch CC, Pharr GM, Mahadevan-Jansen A, Nyman JS. Raman and mechanical properties correlate at whole bone- and tissue-levels in a genetic mouse model. Journal of Biomechanics. 2011;44(2):297–303. doi: 10.1016/j.jbiomech.2010.10.009. [DOI] [PMC free article] [PubMed] [Google Scholar]
- Boskey AL, Pleshko N, Doty SB, Mendelsohn R. Applications of Fourier transform infrared (FT-IR) microscopy to the study of mineralization in bone and cartilage. Cells and Materials. 1992;2:209–220. [Google Scholar]
- Burket J, Gourion-Arsiquaud S, Havill LM, Baker SP, Boskey AL, van der Meulen MCH. Microstructure and nanomechanical properties in osteons relate to tissue and animal age. Journal of Biomechanics. 2011;44(2):277–284. doi: 10.1016/j.jbiomech.2010.10.018. [DOI] [PMC free article] [PubMed] [Google Scholar]
- Carden A, Morris MD. Application of vibrational spectroscopy to the study of mineralized tissues (review) Journal of Biomedical Optics. 2000;5(3):259–268. doi: 10.1117/1.429994. [DOI] [PubMed] [Google Scholar]
- Carden A, Rajachar RM, Morris MD, Kohn DH. Ultrastructural changes accompanying the mechanical deformation of bone tissue: a raman imaging study. Calcified Tissue International. 2003;72:166–175. doi: 10.1007/s00223-002-1039-0. [DOI] [PubMed] [Google Scholar]
- Courtland HW, Nasser P, Goldstone AB, Spevak L, Boskey AL, Jepsen KJ. Fourier transform infrared imaging microspectroscopy and tissue-level mechanical testing reveal intraspecies variation in mouse bone mineral and matrix composition. Calcified Tissue International. 2008;83(5):342–353. doi: 10.1007/s00223-008-9176-8. [DOI] [PMC free article] [PubMed] [Google Scholar]
- Courtland HW, Spevak M, Boskey AL, Jepsen KJ. Genetic variation in mouse femoral tissue-level mineral content underlies differences in whole bone mechanical properties. Cells, Tissues, Organs. 2009;189(1–4):237–240. doi: 10.1159/000151381. [DOI] [PMC free article] [PubMed] [Google Scholar]
- Currey JD. The many adaptations of bone. Journal of Biomechanics. 2003;36(10):1487–1495. doi: 10.1016/s0021-9290(03)00124-6. [DOI] [PubMed] [Google Scholar]
- Donnelly E, Boskey AL, Baker SP, van der Meulen MCH. Effects of tissue age on bone tissue material composition and nanomechanical properties in the rat cortex. Journal of Biomedical Materials Research—Part A. 2010;92(3):1048–1056. doi: 10.1002/jbm.a.32442. [DOI] [PMC free article] [PubMed] [Google Scholar]
- Ebenstein DM, Pruitt LA. Nanoindentation of biological materials. Nano Today. 2006;1(3):26–33. [Google Scholar]
- Evans GP, Behiri JC, Currey JD, Bonfield W. Microhardness and Young's modulus in cortical bone exhibiting a wide range of mineral volume fractions, and in a bone analogue. Journal of Materials Science: Materials in Medicine. 1990;1:38–43. Copyright 1991, IEE. [Google Scholar]
- Fan Z, Rho J-Y. Effects of viscoelasticity and time-dependent plasticity on nanoindentation measurements of human cortical bone. Journal of Biomedical Materials Research—Part A. 2003 Oct 1;67(1):208–214. doi: 10.1002/jbm.a.10027. [DOI] [PubMed] [Google Scholar]
- Fan Z, Smith PA, Harris GF, Rauch F, Bajorunaite R. Comparison of nanoindentation measurements between osteogenesis imperfecta Type III and Type IV and between different anatomic locations (femur/tibia versus iliac crest) Connective Tissue Research. 2007;48(2):70–75. doi: 10.1080/03008200601090949. [DOI] [PubMed] [Google Scholar]
- Fan Z, Swadener JG, Rho JY, Roy ME, Pharr GM. Anisotropic properties of human tibial cortical bone as measured by nanoindentation. Journal of Orthopaedic Research. 2002;20(4):806–810. doi: 10.1016/S0736-0266(01)00186-3. [DOI] [PubMed] [Google Scholar]
- Ferguson VL, Bushby AJ, Boyde A. Nanomechanical properties and mineral concentration in articular calcified cartilage and subchondral bone. Journal of Anatomy. 2003;203(2):191–202. doi: 10.1046/j.1469-7580.2003.00193.x. [DOI] [PMC free article] [PubMed] [Google Scholar]
- Field JS, Swain MV. A simple predictive model for spherical indentation. Journal of Materials Research. 1993;8(2):297–306. [Google Scholar]
- Fischer-Cripps AC. Nanoindentation. Springer; 2004. [Google Scholar]
- Ge D, Domnich V, Juliano T, Stach EA, Gogotsi Y. Structural damage in boron carbide under contact loading. Acta Materialia. 2004;52(13):3921–3927. [Google Scholar]
- Goldman HM, Bromage TG, Boyde A, Thomas CD, Clement JG. Intrapopulation variability in mineralization density at the human femoral mid-shaft. Journal of Anatomy. 2003;203(2):243–255. doi: 10.1046/j.1469-7580.2003.00212.x. [DOI] [PMC free article] [PubMed] [Google Scholar]
- Gourion-Arsiquaud S, Burket JC, Havill LM, DiCarlo E, Doty SB, Mendelsohn R, van der Meulen MCH, Boskey AL. Spatial variation in osteonal bone properties relative to tissue and animal age. Journal of Bone and Mineral Research: The Official Journal of the American Society for Bone and Mineral Research. 2009;24(7):1271–1281. doi: 10.1359/JBMR.090201. [DOI] [PMC free article] [PubMed] [Google Scholar]
- Hengsberger S, Enstroem J, Peyrin F, Zysset P. How is the indentation modulus of bone tissue related to its macroscopic elastic response? A validation study. Journal of Biomechanics. 2003;36(10):1503–1509. doi: 10.1016/s0021-9290(03)00131-3. [DOI] [PubMed] [Google Scholar]
- Hertz H. Miscellaneous Papers. MacMillan and Co. Ltd.; New York: 1896. [Google Scholar]
- Hoffler CE, Guo XE, Zysset PK, Goldstein SA. An application of nanoindentation technique to measure bone tissue lamellae properties. Transactions of the ASME. Journal of Biomechanical Engineering. 2005;127(7):1046–1053. doi: 10.1115/1.2073671. [DOI] [PubMed] [Google Scholar]
- Jepsen KJ, Akkus OJ, Majeska RJ, Nadeau JH. Hierarchical relationship between bone traits and mechanical properties in inbred mice. Mammalian Genome: Official Journal of the International Mammalian Genome Society. 2003;14(2):97–104. doi: 10.1007/s00335-002-3045-y. [DOI] [PubMed] [Google Scholar]
- Jepsen KJ, Pennington DE, Lee YL, Warman M, Nadeau J. Bone brittleness varies with genetic background in A/J and C57BL/6J inbred mice. Journal of Bone and Mineral Research. 2001;16(10):1854–1862. doi: 10.1359/jbmr.2001.16.10.1854. [DOI] [PubMed] [Google Scholar]
- Jiao Y, Chiu H, Fan Z, Jiao F, Eckstein EC, Beamer WG, Gu W. Quantitative trait loci that determine mouse tibial nanoindentation properties in an F2 population derived from C57BL/6J ×C3H/HeJ. Calcified Tissue International. 2007;80(6):383–390. doi: 10.1007/s00223-007-9030-4. [DOI] [PubMed] [Google Scholar]
- Juliano T, Domnich V, Gogotsi Y. Examining pressure-induced phase transformations in silicon by spherical indentation and Raman spectroscopy: a statistical study. Journal of Materials Research. 2004;19(10):3099–3108. [Google Scholar]
- Kalidindi SR, Pathak S. Determination of the effective zero-point and the extraction of spherical nanoindentation stress–strain curves. Acta Materialia. 2008;56(14):3523–3532. [Google Scholar]
- Lewis G, Nyman JS. The use of nanoindentation for characterizing the properties of mineralized hard tissues: State-of-the art review. Journal of Biomedical Materials Research—Part B Applied Biomaterials. 2008;87(1):286–301. doi: 10.1002/jbm.b.31092. [DOI] [PubMed] [Google Scholar]
- Love AEH. Boussinesq's problem for a rigid cone. Journal of Mathematics. 1939;10:161–175. [Google Scholar]
- Miller LM, Little W, Schirmer A, Sheik F, Busa B, Judex S. Accretion of bone quantity and quality in the developing mouse skeleton. Journal of Bone and Mineral Research: The Official Journal of the American Society for Bone and Mineral Research. 2007;22(7):1037–1045. doi: 10.1359/jbmr.070402. [DOI] [PubMed] [Google Scholar]
- Mittra E, Akella S, Qin Y-X. The effects of embedding material, loading rate and magnitude, and penetration depth in nanoindentation of trabecular bone. Journal of Biomedical Materials Research—Part A. 2006;79(1):86–93. doi: 10.1002/jbm.a.30742. [DOI] [PubMed] [Google Scholar]
- Oliver WC, Pharr GM. Improved technique for determining hardness and elastic modulus using load and displacement sensing indentation experiments. Journal of Materials Research. 1992;7(6):1564–1580. [Google Scholar]
- Oliver WC, Pharr GM. Measurement of hardness and elastic modulus by instrumented indentation: advances in understanding and refinements to methodology. Journal of Materials Research. 2004;19(1):3–20. [Google Scholar]
- Oyen ML. Nanoindentation hardness of mineralized tissues. Journal of Biomechanics. 2006;39(14):2699–2702. doi: 10.1016/j.jbiomech.2005.09.011. [DOI] [PubMed] [Google Scholar]
- Oyen ML, Cook RF. A practical guide for analysis of nanoindentation data. Journal of the Mechanical Behavior of Biomedical Materials. 2009;2(4):396–407. doi: 10.1016/j.jmbbm.2008.10.002. [DOI] [PubMed] [Google Scholar]
- Paietta RC, Campbell SE, Ferguson VL. Influences of spherical tip radius, contact depth, and contact area on nanoindentation properties of bone. Journal of Biomechanics. 2011;44(2):285–290. doi: 10.1016/j.jbiomech.2010.10.008. [DOI] [PubMed] [Google Scholar]
- Pathak S, Cambaz ZG, Kalidindi SR, Swadener JG, Gogotsi Y. Viscoelasticity and high buckling stress of dense carbon nanotube brushes. Carbon. 2009a;47:1969–1976. [Google Scholar]
- Pathak S, Gregory Swadener J, Kalidindi SR, Courtland H-W, Jepsen KJ, Goldman HM. Measuring the dynamic mechanical response of hydrated mouse bone by nanoindentation. Journal of the Mechanical Behavior of Biomedical Materials. 2011a;4:34–43. doi: 10.1016/j.jmbbm.2010.09.002. [DOI] [PMC free article] [PubMed] [Google Scholar]
- Pathak S, Kalidindi SR, Klemenz C, Orlovskaya N. Analyzing indentation stress–strain response of LaGaO3 single crystals using spherical indenters. Journal of the European Ceramic Society. 2008a;28(11):2213–2220. [Google Scholar]
- Pathak S, Kalidindi SR, Moser B, Klemenz C, Orlovskaya N. Analyzing indentation behavior of LaGaO3 single crystals using sharp indenters. Journal of the European Ceramic Society. 2008b;28(10):2039–2047. [Google Scholar]
- Pathak S, Michler J, Wasmer K, Kalidindi SR. Studying Grain Boundary Regions In Polycrystalline Materials Using Spherical Nano-Indentation And Orientation Imaging Microscopy. Journal of Materials Science. 2011;47(2):815–823. [Google Scholar]
- Pathak S, Shaffer J, Kalidindi SR. Determination of an effective zero-point and extraction of indentation stress–strain curves without the continuous stiffness measurement signal. Scripta Materialia. 2009b;60(6):439–442. [Google Scholar]
- Pathak S, Stojakovic D, Doherty R, Kalidindi SR. Importance of surface preparation on the nano-indentation stress–strain curves measured in metals. Journal of Materials Research—Focus Issue on Indentation Methods in Advanced Materials Research. 2009c;24(3):1142–1155. [Google Scholar]
- Pathak S, Stojakovic D, Kalidindi SR. Measurement of the local mechanical properties in polycrystalline samples using spherical nano-indentation and orientation imaging microscopy. Acta Materialia. 2009d;57(10):3020–3028. [Google Scholar]
- Pelletier H. Predictive model to estimate the stress–strain curves of bulk metals using nanoindentation. Tribology International. 2006;39(7):593–606. [Google Scholar]
- Price C, Herman BC, Lufkin T, Goldman HM, Jepsen KJ. Genetic variation in bone growth patterns defines adult mouse bone fragility. Journal of Bone and Mineral Research: The Official Journal of the American Society for Bone and Mineral Research. 2005;20(11):1983–1991. doi: 10.1359/JBMR.050707. [DOI] [PubMed] [Google Scholar]
- Rho J-Y, Kuhn-Spearing L, Zioupos P. Mechanical properties and the hierarchical structure of bone. Medical Engineering and Physics. 1998;20(2):92–102. doi: 10.1016/s1350-4533(98)00007-1. [DOI] [PubMed] [Google Scholar]
- Rho J-Y, Pharr GM. Effects of drying on the mechanical properties of bovine femur measured by nanoindentation. Journal of Materials Science: Materials in Medicine. 1999;10(8):485–488. doi: 10.1023/a:1008901109705. [DOI] [PubMed] [Google Scholar]
- Rho JY, Tsui TY, Pharr GM. Elastic properties of human cortical and trabecular lamellar bone measured by nanoindentation. Biomaterials. 1997;18(20):1325–1330. doi: 10.1016/s0142-9612(97)00073-2. [DOI] [PubMed] [Google Scholar]
- Rho JY, Zioupos P, Currey JD, Pharr GM. Variations in the individual thick lamellar properties within osteons by nanoindentation. Bone. 1999;25(3):295–300. doi: 10.1016/s8756-3282(99)00163-5. [DOI] [PubMed] [Google Scholar]
- Roschger P, Paschalis EP, Fratzl P, Klaushofer K. Bone mineralization density distribution in health and disease. Bone. 2008;42(3):456–466. doi: 10.1016/j.bone.2007.10.021. [DOI] [PubMed] [Google Scholar]
- Rosen CJ, Beamer WG, Donahue LR. Defining the genetics of osteoporosis: using the mouse to understand man. Osteoporosis International. 2001;12(10):803–810. doi: 10.1007/s001980170030. [DOI] [PubMed] [Google Scholar]
- Stauss S, Schwaller P, Bucaille JL, Rabe R, Rohr L, Michler J, Blank E. Determining the stress–strain behaviour of small devices by nanoindentation in combination with inverse methods. Microelectronic Engineering. 2003;67–68:818–825. [Google Scholar]
- Swadener JG, Rho JY, Pharr GM. Effect of anisotropy on elastic moduli measured by nanoindentation in human tibial cortical bone. Journal of Biomedical Materials Research. 2001;57(1):108–112. doi: 10.1002/1097-4636(200110)57:1<108::aid-jbm1148>3.0.co;2-6. [DOI] [PubMed] [Google Scholar]
- Swain MV. Mechanical property characterization of small volumes of brittle materials with spherical tipped indenters. Materials Science and Engineering A: Structural Materials: Properties, Microstructure and Processing. 1998;253:160–166. [Google Scholar]
- Tabor D. The Hardness of Metals. Oxford University Press; 1951. [Google Scholar]
- Tai K, Qi HJ, Ortiz C. Effect of mineral content on the nanoindentation properties and nanoscale deformation mechanisms of bovine tibial cortical bone. Journal of Materials Science: Materials in Medicine. 2005;16(10):947–959. doi: 10.1007/s10856-005-4429-9. [DOI] [PubMed] [Google Scholar]
- Taljat B, Zacharia T, Kosel F. New analytical procedure to determine stress-strain curve from spherical indentation data. International Journal of Solids and Structures. 1998;35(33):4411–4426. [Google Scholar]
- Timlin JA, Carden A, Morris MD. Chemical Microstructure of cortical bone probed by Raman transects. Applied Spectroscopy. 1999;53(11):1429–1435. [Google Scholar]
- Tommasini SM, Morgan TG, van der Meulen M, Jepsen KJ. Genetic variation in structure–function relationships for the inbred mouse lumbar vertebral body. Journal of Bone and Mineral Research: The Official Journal of the American Society for Bone and Mineral Research. 2005;20(5):817–827. doi: 10.1359/JBMR.041234. [DOI] [PubMed] [Google Scholar]
- Yeni YN, Yerramshetty J, Akkus O, Pechey C, Les CM. Effect of Fixation and embedding on Raman spectroscopic analysis of bone tissue. Calcified Tissue International. 2006;78:363–371. doi: 10.1007/s00223-005-0301-7. [DOI] [PubMed] [Google Scholar]
- Zebaze RMD, Jones AC, Pandy MG, Knackstedt MA, Seeman E. Differences in the degree of bone tissue mineralization account for little of the differences in tissue elastic properties. Bone. 2011;48(6):1246–1251. doi: 10.1016/j.bone.2011.02.023. [DOI] [PubMed] [Google Scholar]