SUMMARY
Recent evidence has determined a phenotypic and functional heterogeneity for macrophage populations. This plasticity of macrophage function has been related to specific properties of subsets (M1, M2) of these cells in inflammation, adaptive immune responses, and resolution of tissue destructive processes. This investigation hypothesized that targeted alterations in the distribution of macrophage phenotypes in aged individuals, and with periodontitis would be skewed towards M1 inflammatory macrophages in gingival tissues. The study used a nonhuman primate model to evaluate gene expression profiles as footprints of macrophage variation in healthy and periodontitis gingival tissues from animals 3–23 years of age and in periodontitis tissues in adult and aged animals. Significant increases in multiple genes reflecting overall increases in macrophage activities were observed in healthy aged tissues, and were significantly increased in periodontitis tissues from both adults and aged animals. Generally, gene expression patterns for M2 macrophages were similar in healthy young, adolescent, and adult tissues. However, modest increases were noted in healthy aged tissues, similar to those seen in periodontitis tissues from both age groups. M1 macrophage gene transcription patterns increased significantly over the age range in healthy tissues, with multiple genes (e.g. CCL13, CCL19, CCR7, TLR4) significantly increased in aged animals. Additionally, gene expression patterns for M1 macrophages were significantly increased in adult health versus periodontitis and aged healthy versus periodontitis. The findings supported a significant increase in macrophages with aging and in periodontitis. The primary increases in both healthy aged tissues and, particularly periodontitis tissues appeared in the M1 phenotype.
Keywords: Macrophage polarization, periodontitis, gene expression, aging, gingival tissue
INTRODUCTION
Chronic infection of the subgingival sulcus with complex microbial biofilms containing putative periodontopathogens results in a persistent inflammatory response that results in collateral destruction of both soft tissues (gingiva, periodontal ligament, connective) and hard tissues (alveolar bone) (Armitage, 2013). Substantial evidence has documented associations of disease with specific species of bacteria in these pathogenic biofilms (Wade, 2013) and has determined an array of innate immune, inflammatory, and adaptive immune responses that are triggered by these bacteria (Hajishengallis, 2014, Souza and Lerner, 2013). Models of the initiation and progression of the disease have emphasized a role of innate responses that with alterations in the quality/quantity of the biofilms induces a neutrophil predominated acute inflammatory response (Hajishengallis and Hajishengallis, 2014, Scott and Krauss, 2012). As the lesion progresses, increasing numbers of mononuclear cells emigrate into the affected tissues and into the subgingival sulcus, consistent with a more chronic inflammatory lesion (Smith, Seymour and Cullinan, 2010). The cellular profiles of these apparent established lesions include various phenotypes of T cells, B cells and plasmacytes producing antibody (Ebersole, Dawson, Morford, Peyyala, Miller and Gonzalez, 2013), and antigen-presenting cells including macrophages (Hajishengallis, 2010, Bartold, Cantley and Haynes, 2010, Merry, Belfield, McArdle, McLennan, Crean and Foey, 2012) and dendritic cells [DC, (Anjana, Joseph and Suresh, 2012, Cutler and Teng, 2007).
Historically, the immunology literature discriminated various differences in functions of monocytes and macrophages (Ley, Miller and Hedrick, 2011, Yona and Jung, 2010), as well as supporting variations in macrophage functions related to their tissue location (e.g. spleen, liver, skin) (Geissmann, Manz, Jung, Sieweke, Merad and Ley, 2010). However, recent literature has documented a greater plasticity for macrophage populations that can be delineated via phenotypic characteristics (Zhou, Huang, Lin, Zhan, Kong, Fang and Li, 2014, Labonte, Tosello-Trampont and Hahn, 2014, Mantovani, Biswas, Galdiero, Sica and Locati, 2013, Locati, Mantovani and Sica, 2013, Sica and Mantovani, 2012, Biswas, Chittezhath, Shalova and Lim, 2012). This plasticity of macrophage phenotypes, not only translates into substantial functional differences across the subsets of cells in various tissues, but also depend upon clear differences in the stimulatory signals that result in M1 (classical activation, inflammatory), M2a (alternative activation, immunomodulatory), M2b (type II activated, immunomodulatory), and M2c (deactivated, immunomodulatory) cells. It is now clear that the innate and adaptive immune response outcomes of antigen recognition depend upon the responses of subpopulations of macrophages and DCs (Maldonado-Lopez, De Smedt, Pajak, Heirman, Thielemans, Leo, Urbain, Maliszewski and Moser, 1999, Maldonado-Lopez and Moser, 2001). These variations appear to be regulated by the types of microorganisms providing the stimulus and the local cell factor microenvironment (Banchereau, Briere, Caux, Davoust, Lebecque, Liu, Pulendran and Palucka, 2000). The resulting signaling pathways activated through these receptors and processes lead to different macrophage functions and patterns of responses. Nevertheless, there remains minimal information regarding phenotypes of macrophages that occur in clinically healthy tissues and how these change with aging and disease reflecting a cellular/humoral milieu that would contribute to tissue destruction, enhance protective immune response, or be engaged in resolution of the inflammatory lesion.
The report describes studies using a nonhuman primate model of gingival (mucosal) tissue responses to evaluate effects of aging on the local gene expression footprint of phenotypes of macrophages, as well as alterations in the distribution of M1 and M2 patterns that reflect a naturally occurring periodontitis in adult and aged animals.
METHODS
Nonhuman primate model and oral clinical evaluation
Rhesus monkeys (Macaca mulatta) (n=34; 14 females and 20 males) housed at the Caribbean Primate Research Center (CPRC) at Sabana Seca, Puerto Rico, were used in these studies. Healthy animals were distributed by age into four groups: ≤3 years (young; n=5), 3–7 years (adolescent; n=5), 12–16 years (adult; n=7) and 18–23 years (aged; n=6). Adult and aged periodontitis animals (11 additional animals) were used, since younger animals do not develop naturally occurring disease. The nonhuman primates are typically fed a 20% protein, 5% fat, and 10% fiber commercial monkey diet (diet 8773, Teklad NIB primate diet modified: Harlan Teklad). The diet is supplemented with fruits and vegetables, and water is provided ad libitum in an enclosed corral setting.
A protocol approved by the Institutional Animal Care and Use Committee (IACUC) of the University of Puerto Rico, enabled anesthetized animals to be examined for clinical measures of periodontal parameters including probing pocket depth (PPD), and bleeding on probing (BOP) as we have described previously (Ebersole, Steffen, Gonzalez-Martinez and Novak, 2008). Animals were classified as periodontitis with a mouth mean BOP index of ≥2.0 and mouth mean PPD of >3.0 and healthy animals showed a mean BOP of ≤1.0 and mean PPD of ≤3.0.
Tissue sampling and gene expression microarray analysis
A buccal gingival sample from either healthy or periodontitis-affected tissue from the premolar/molar maxillary region of each animal was taken using a standard gingivectomy technique, and maintained frozen in RNAlater solution. Total RNA was isolated from each gingival tissue using a standard procedure as we have described and tissue RNA samples submitted to the microarray core to assess RNA quality analyze the transcriptome using the GeneChip® Rhesus Macaque Genome Array (Affymetrix) (Meka, Bakthavatchalu, Sathishkumar, Lopez, Verma, Wallet, Bhattacharyya, Boyce, Handfield, Lamont, Baker, Ebersole and Kesavalu, Gonzalez, Stromberg, Huggins, Gonzalez-Martinez, Novak and Ebersole, 2011). Individual samples were used for gene expression analyses. Table 1 provides an overview of the genes whose expression was evaluated in the gingival tissues as related to M1/2, M1, and M2 phenotype macrophages. These include an array of cytokine/chemokine responses, as well as various cell surface molecules that provide some discrimination among these phenotypes.
Table 1.
Gene expression targets for macrophage phenotypes
| Gene ID | MΦ Type | Gene Title |
|---|---|---|
| ADK | M2 | Adenosine kinase |
| ARG1 | M2 | Arginase 1 |
| ALOX15 | M2 | Arachidonate 15-lipoxygenase |
| BCL2A1 | M1 | BCL2-Related Protein A1 |
| BIRC3 | M1 | Baculoviral IAP Repeat Containing 3, apoptosis regulator |
| CA2 | M2 | Carbonic anhydrase II |
| CCL1 | M2 | Chemokine (C-C motif) ligand 1 |
| CCL2 | M1 | Macrophage chemotactic protein 1 (MCP-1) |
| CCL3 | M1 | Macrophage inflammatory protein 1α (MIP-1α) |
| CCL4L1 | M1 | Chemokine (C-C motif) ligand 4-like 1 |
| CCL5 | M1 | Regulated on activation, normal T cell expressed and secreted (RANTES) |
| CCL8 | M1 | Macrophage chemotactic protein 2 (MCP-2) |
| CCL11 | M1 | Eotaxin 1 |
| CCL13 | M1 | Chemokine (C-C motif) ligand 13 |
| CCL17 | M2 | Thymus and activation regulated chemokine (TARC) |
| CCL18 | M2 | Pulmonary and activation-regulated chemokine (PARC) |
| CCL19 | M1 | Macrophage inflammatory protein 3β (MIP-3β) |
| CCL20 | M1/M2 | Macrophage inflammatory protein 3α (MIP-3α) |
| CCL22 | M2 | Chemokine (C-C motif) ligand 22 |
| CCL23 | M2 | Macrophage inflammatory protein 3 (MIP-3) |
| CCL24 | M2 | Eotaxin 2 |
| CCR2 | M1 | CD192, receptor for CCL2 |
| CCR2B | M1 | Receptor for CCL2 |
| CCR7 | M1 | Receptor for CCL19 and CCL21 |
| CXCL1 | M2 | Gro1 |
| CXCL9 | M1 | Monokine induced by gamma interferon (MIG) |
| CXCL10 | M1 | Interferon gamma-induced protein 10 (IP-10) |
| CXCL11 | M1 | Interferon-inducible T-cell alpha chemoattractant (I-TAC) |
| CXCL13 | M1/M2 | Breast and kidney-expressed chemokine (BRAK) |
| CXCR1 | M1 | Chemokine (C-X-C motif) receptor 1 |
| CXCR2 | M1 | IL8 receptor B |
| CD11b | M2 | Integrin alpha M (ITGAM) |
| CD14 | M2 | Co-receptor for LPS |
| CD16 | M2 | Fc IgG receptor 3A |
| CD23 | M2 | Fc IgE receptor 2 |
| CD36 | M2 | Class B scavenger receptor |
| CD40 | M1 | Costimulatory protein found on APCs, binds CD154 (CD40L) |
| CD68 | M1/M2 | Binds to low density lipoprotein, highly expressed by human monocytes and tissue macrophages |
| CD80 | M1/M2 | Co-stimulatory molecule (B7–1) binds CD28 and CTLA-4 |
| CD86 | M1/M2 | Co-stimulatory molecule (B7–2) binds CD28 and CTLA-4 |
| CD163 | M2 | Scavenger receptor cysteine rich family type B |
| CD200R | M2 | CD200 receptor 1, receptor for the OX-2 membrane glycoprotein |
| CD209 | M2 | DC-SIGN, C-type lectin receptor |
| CERK | M2 | Ceramide kinase |
| CHI3L2 | M1 | Chitinase 3-like 2 |
| CLEC7A | M2 | Dectin 1 |
| DRB4 | M1/M2 | Major histocompatibility complex, class II, DR beta 4 |
| DQB1 | M1/M2 | Major histocompatibility complex, class II, DQ beta 1 |
| DMB | M1/M2 | Major histocompatibility complex, class II, DM beta |
| DQ1 | M1/M2 | Major histocompatibility complex, class II, DQ 1 |
| DMA | M1/M2 | Major histocompatibility complex, class II, DM alpha |
| DOA | M1/M2 | Major histocompatibility complex, class II, DO alpha |
| DOB | M1/M2 | Major histocompatibility complex, class II, DOR beta |
| DPA | M1/M2 | Major histocompatibility complex, class II, DP alpha |
| DPB | M1/M2 | Major histocompatibility complex, class II, DP beta |
| DQA1 | M1/M2 | Major histocompatibility complex, class II, DQ alpha |
| DRA | M1/M2 | Major histocompatibility complex, class II, DR alpha |
| ECGF1/TYMP | M1 | Thymidine phosphorylase |
| FAS | M1 | Fas cell surface death receptor |
| FN1 | M2 | Fibronectin 1 |
| GADD45G | M2 | Growth arrest and DNA-damage-inducible, gamma |
| GPR86 | M2 | Purinergic receptor P2Y, G-protein coupled, 13 |
| HEXB | M2 | Hexosaminidase B |
| HO-1 | M2 | Hemoxyganase 1 |
| HRH1 | M2 | Histamine receptor H1 |
| HSD11B1 | M1 | Hydroxysteroid (11-beta) dehydrogenase 1 |
| HS3ST1 | M2 | Heparan sulfate (glucosamine) 3-O-sulfotransferase 1 |
| IDO1 | M1 | Indoleamine 2,3-dioxygenase 1 |
| IGF1 | M2 | Instulin-like growth factor 1 |
| IFNA1 | M1 | Interferon, alpha 1 |
| IFNA2 | M1 | Interferon, alpha 2 |
| IFNA6 | M1 | Interferon, alpha 6 |
| IFNA13 | M1 | Interferon, alpha 13 |
| IFNA16 | M1 | Interferon, alpha 16 |
| IFNA21 | M1 | Interferon, alpha 21 |
| IFNB1 | M1 | Interferon, beta 1 |
| IL1B | M1/M2 | Interleukin 1 beta |
| IL1RN | M2 | Interleukin 1 receptor antagonist |
| IL1R1 | M1 | Interleukin 1 receptor 1 |
| IL1R2 | M2 | Interleukin 1 receptor 2 |
| IL6 | M1 | Interleukin 6 |
| IL8 | M1 | Interleukin 8 |
| IL10 | M2 | Interleukin 10 |
| IL12A | M1 | Interleukin 12 subunit alpha |
| IL12B | M1 | Interleukin 12 subunit beta |
| IL15 | M1 | Interleukin 15 |
| IL15RA | M1 | Interleukin 15 receptor, alpha |
| IL23A | M1 | Interleukin 23 subunit alpha |
| MAF | M2 | v-Maf avian musculoaponeurotic fibrosarcoma ongogene homolog A |
| MRC1 | M2 | Macrophage mannose receptor (CD206) |
| MRC1L1 | M2 | Mannose C-type lectin receptor |
| MSR1 | M2 | Macrophage scavenger receptor 1 (SR-A1) |
| MS4A4 | M2 | Membrane-spanning 4-domains, subfamily A, member 4 |
| MS4A6A | M2 | Membrane-spanning 4-domains, subfamily A, member 6A |
| NOS2 | M1 | Nitric oxide synthase 2 (inducible) |
| OAS1 | M1 | 2’-5’-oligoadenylate synthetase 2 |
| OASL | M1 | 2’-5’-oligoadenylate synthetase-like |
| PBEF1/NAMPT | M1 | Nicotinamide phosphoribosyltransferase |
| PFKFB3 | M1 | 6-phosphofructo-2-kinase/fructose-2,6-biphosphatase 3 |
| PFKP | M1 | Phosphofructokinase, platelet |
| PLA1A | M1 | Phospholipase A1 Member A |
| PPARG | M2 | Peroxisome proliferator-activated receptor gamma |
| PSMA2 | M1 | Proteasome subunit, alpha type, 2 |
| PSMB9 | M1 | Proteasome subunit, beta type, 9 |
| PSME2 | M1 | Proteasome activator subunit 2 (PA28 beta) |
| PTX3 | M1 | Pentraxin 3 |
| P2RY14 | M2 | Purinergic receptor P2Y, G-protein coupled, 14 |
| SCARA3 | M2 | Scavenger receptor class A, member 3 |
| SCARF2 | M2 | Scavenger receptor class F, member 2 |
| SEPP1 | M2 | Selenoprotein P, plasma, 1 |
| SRA | M2 | Macrophage scavenger receptor A (SR-A) |
| SLC2A6 | M1 | Solute Carrier Family 2 (Facilitiated Glucose Transporter), member 6 |
| SLC31A2 | M1 | Solute Carrier Family 31 (Copper Transporter), Member 2 |
| SLC7A5 | M1 | Solute Carrier Family 7 (Amino Acid Transporter Light Chain, L System), Member 5 |
| SPHK1 | M1 | Sphingosine kinase 1 |
| TGFB1 | M2 | Transforming growth factor beta 1 |
| TGFBR2 | M2 | Transforming growth factor beta receptor 2 |
| TLR2 | M1 | Toll-like receptor 2 |
| TLR4 | M1 | Toll-like receptor 4 |
| TLR5 | M2 | Toll-like receptor 5 |
| TNF | M1/M2 | Tumor necrosis factor alpha |
| TNFSF10 | M1 | TRAIL |
Based upon the microarray outcomes we selected 5 genes and performed a qPCR analysis using a standard technique in our laboratory employing a Roche 480 LightCycler (Gonzalez, John Novak, Kirakodu, Stromberg, Shen, Orraca, Gonzalez-Martinez and Ebersole, 2013). Primers were prepared for IL6 (forward - CCTGAACCAACCACAAATGC; reverse – GGACTGCAGGAACTCCTTAAA; amplicon 114 bp), CXCL13 (forward – AGTCT GGAAGAAGAACAAGTCAG; reverse – GGAACTGGTGGAGTTGAAGAA; amplicon 108 bp), CCL19 (forward - GCTACCTTCTCATCAAGGATGG; reverse – GTTCTACCCAG GACTGGTCT; amplicon 102 bp), CD14 (forward - GCCCTAAACTCCCTCAATCTG; reverse – CAGTCTGTTGCAGCTGAGAT; amplicon 99 bp) and IL1R2 (forward – TTTCAGACACTACGCACCAC; reverse – ACCGTCTGTGCATCCATATTC; amplicon 118 bp) and GAPDH (forward – GGTGTGAACCATGAGAAGTATGA; reverse – GAGTCCTTCCACGATACCAAAG; amplicon 123 bp) genes, designed using software PrimerQuest at Integrated DNA Technologies website (www.idtdna.com) and were synthesized by Integrated DNA Technologies, Inc (Coralville, IA). The level of message was determined (Gonzalez, John Novak, Kirakodu, Stromberg, Shen, Orraca, Gonzalez-Martinez and Ebersole, 2013, Gonzalez, Novak, Kirakodu, Orraca, Chen, Stromberg, Gonzalez-Martinez and Ebersole, 2014, Ebersole, Kirakodu, Novak, Stromberg, Shen, Orraca, Gonzalez-Martinez, Burgos and Gonzalez, 2014) and those levels compared across the RNA samples prepared from each of the healthy groups and the 2 periodontitis groups.
Data analysis
Normalization of values across the chips was accomplished through signal intensity standardization across each chip using Affymetrix PLIER algorithm. The GeneChip® Rhesus Macaque Genome Array contained matched and mismatched pairs allowing the MAS 5 algorithm to be used. The healthy and periodontitis tissues were then compared between the age groups using a t-test and accepting a p-value <0.05 for significance. We did determine a correlation with aging in healthy tissues or periodontitis tissues using a Spearman Rank correlation analysis that was fit to the gene expression by age. A p-value ≤ 0.05 was used to evaluate the significance of the correlation. The data has been uploaded to the ArrayExpress data base (www.ebi.ac.uk) under accession number: E-MTAB-1977.
Unsupervised approaches such as clustering have been used widely to partition transcriptional expression profiles into functionally related groups. In the present study, we investigated the transcriptional profiles of a list of 136 genes whose macrophage type is known has been reported (Martinez, Gordon, Locati and Mantovani, 2006). The objective was to investigate whether genes corresponding to distinct macrophage type clustered into distinct groups. One-way ANOVA (α = 0.05) was used to identify genes from this set that were differentially expressed at least across one of the healthy age groups (Young, Adolescent, Adult, Aged), resulting in 26 transcripts. Imposing differential gene expression analysis removed noisy genes with no marked changes across any of the groups. Given the sample-size limitations in the present study and subtle transcriptional response in the current experimental setting, no multiple-testing correction to control for false-discovery or family-wise error were imposed in the differential gene expression analysis. K-means clustering in conjunction with correlation metric was subsequently used to group the 26 genes into three clusters. The choice of three clusters can be attributed to fact that the macrophage types that fall under the broad categories (M1, M2, M1/M2).
JMP (version 10.0, SAS Inc., Cary, NC) was used to create metagenes independently of group classification using principal components based on the correlation matrix. The plots are of the first two PCA scores across the healthy tissues and comparing healthy to periodontitis tissues within the two age groups. The variability is explained by each of the scores indicated on the plots.
RESULTS
Table 2 provides a summary of the clinical data on the groups of animals and measures for sites sampled from each group. As was expected, based upon the selection criteria, the group of animals with periodontitis had significantly greater BOP and PPD levels than the healthy groups across the age range. It also appeared that there was some increase in BOP and PPD with healthy aging.
Table 2.
Clinical features of animals stratified based upon presentation of periodontal health and disease.
| Clinical Measure | Healthy | Periodontitis | ||||
|---|---|---|---|---|---|---|
| Young | Adolescent | Adult | Aged | Adult | Aged | |
| Animal Group | ||||||
| Mean BOP | 0.3 ± 0.2* | 1.0 ± 0.6a | 1.0 ± 0.3b | 1.0 ± 0.5a | 2.2 ± 0.2c | 2.3 ± 0.3c |
| Mean PPD | 1.4 ± 0.1 | 2.3 ± 0.3b | 2.5 ± 0.4b | 2.5 ± 0.4b | 3.4 ± 0.2c | 3.5 ± 0.4c |
| Site Sampled | ||||||
| Mean BOP | 0.3 ± 0.4 | 0.9 ± 0.5 | 0.8 ± 0.4 | 0.9 ± 0.6 | 2.4 ± 0.4c | 2.7 ± 0.4c |
| Mean PPD | 1.3 ± 0.2 | 2.0 ± 0.3a | 2.3 ± 0.3b | 2.3 ± 0.7a | 3.6 ± 0.3c | 4.7 ± 0.9c,d |
Values denote group means ± 1SD
Significantly different from young group at least at p<0.05
Significantly different from young group at least at p<0.001
Significantly different from matched age healthy at least at p<0.001
Significantly different from adult periodontitis at p<0.03
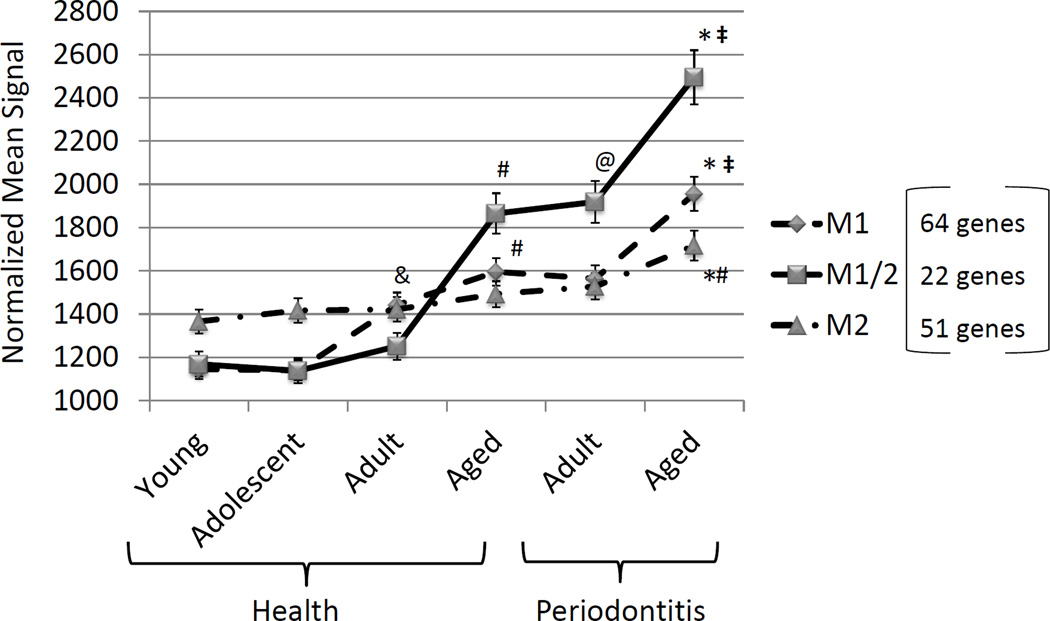
The results in Figure 1 depicts the summation of expression levels of 19 genes for M1/M2, 23 genes for M1, and 22 genes for M2. The graph demonstrates rather minimal changes in gene expression for overall macrophage numbers (M1/M2) in healthy gingival tissues from young, adolescent and adult animals. Nevertheless, a significant increase in M1/M2 gene expression was observed in healthy aged tissues, and periodontitis tissues from adult animals demonstrated increases in macrophage-related gene expression patterns. Examination of M2 gene profiles showed slightly increasing levels in young, adolescent, adult and aged healthy tissues, with no significant differences across the groups. A significant increase was noted in the aged periodontitis tissues compared to the levels detected in healthy tissues of all age groups. Finally, substantial changes were observed in the M1 gene expression profiles with increases over the entire healthy age range, and an additional significant increase in the healthy aged tissues. M1 signals were significantly greater in both adult and aged periodontitis, with the highest levels observed in aged periodontitis tissues.
Figure 1.
Expression of complex of genes reflecting M1/M2 macrophages or polarized subsets of M1 or M2. Genes contributing to the summary data are described in Table 1. Points denote group mean and vertical brackets enclose 1 SD. Asterisk (*) denotes statistically different at least at p<0.05 vs. aged healthy; # denotes statistically different at least at p<0.05 vs. other healthy groups; @ denotes statistically different at least at p<0.05 vs. adult healthy; & denotes statistically different at least at p<0.05 vs. young/adolescent groups; and denotes statistically different at least at p<0.05 vs. adult periodontitis group.
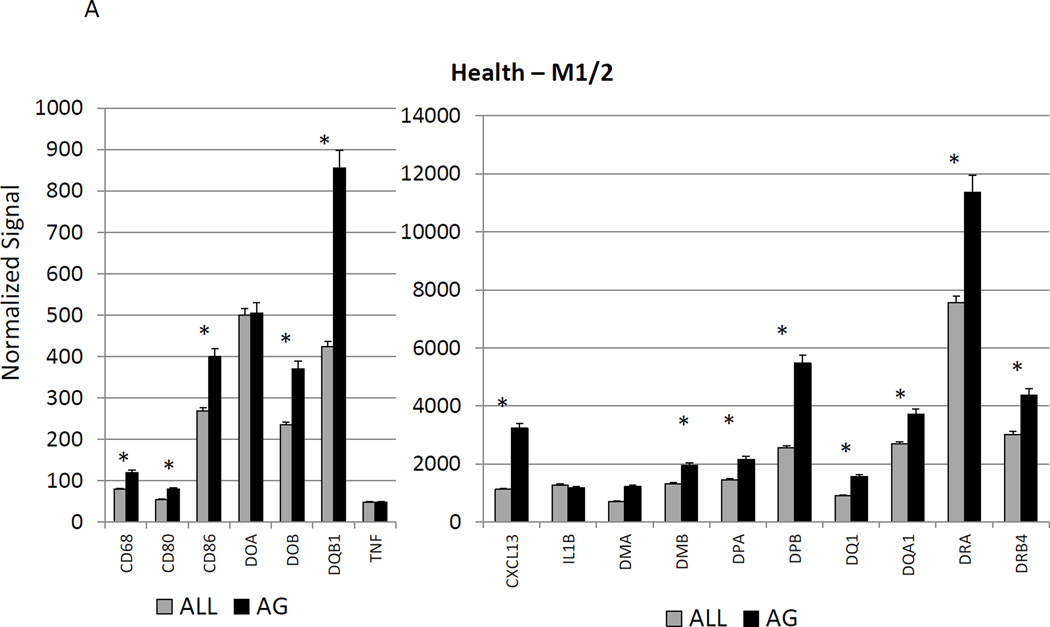
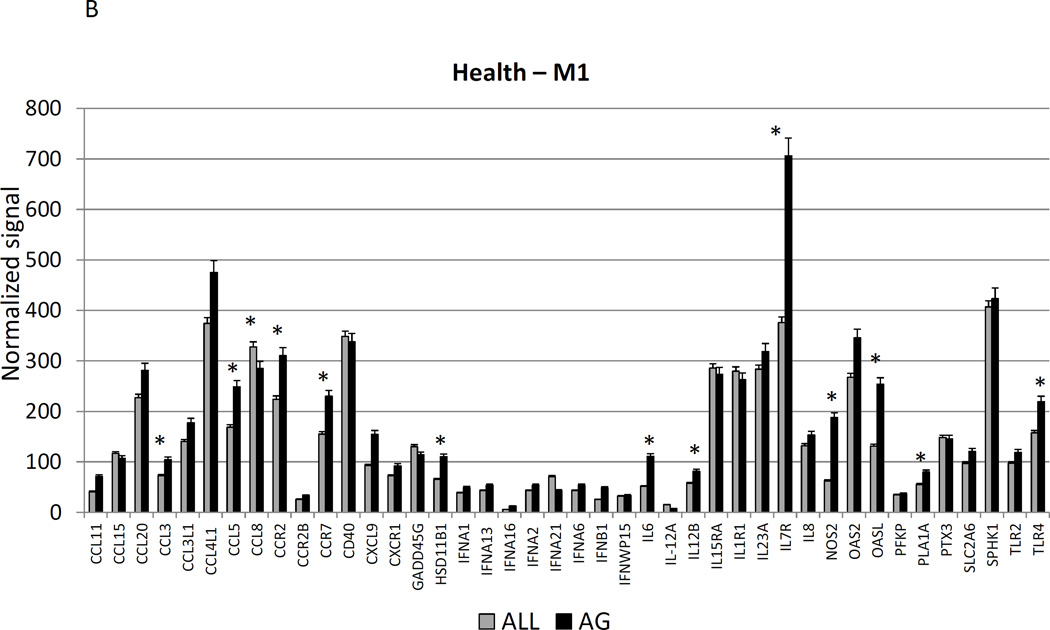
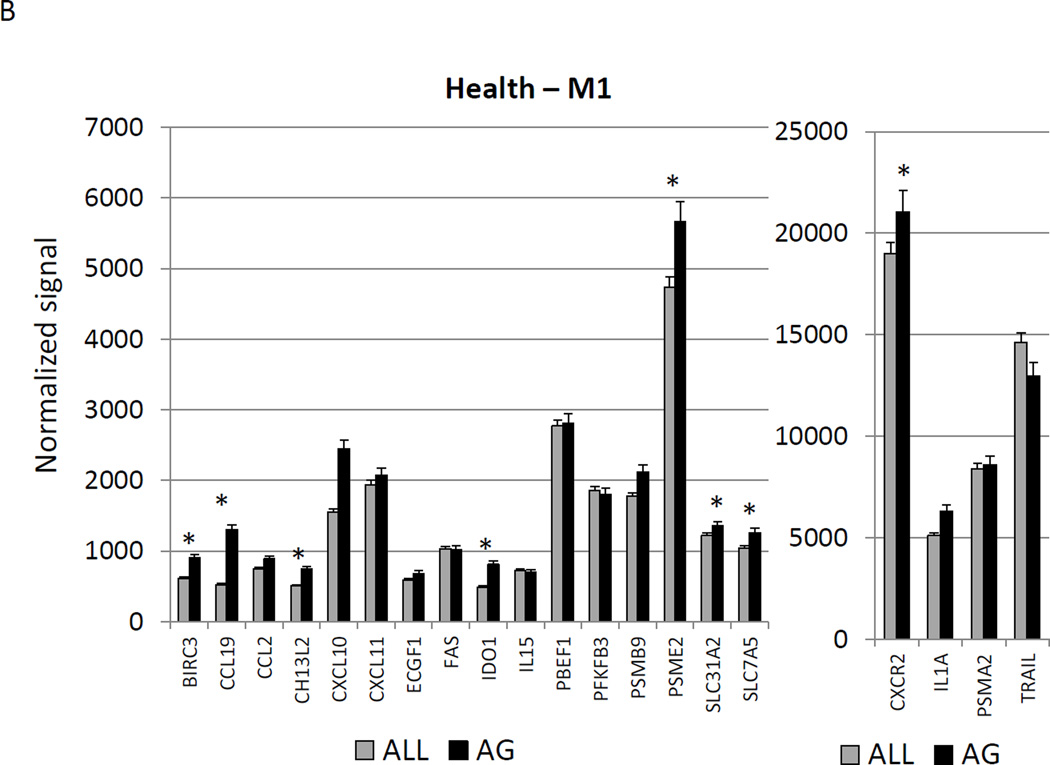
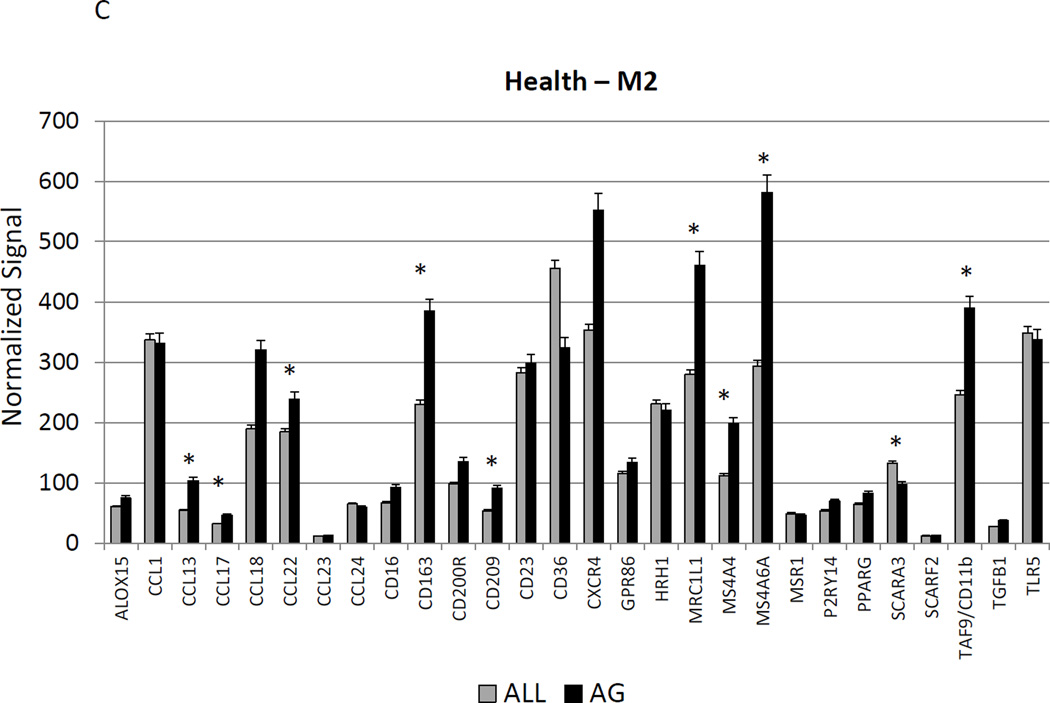
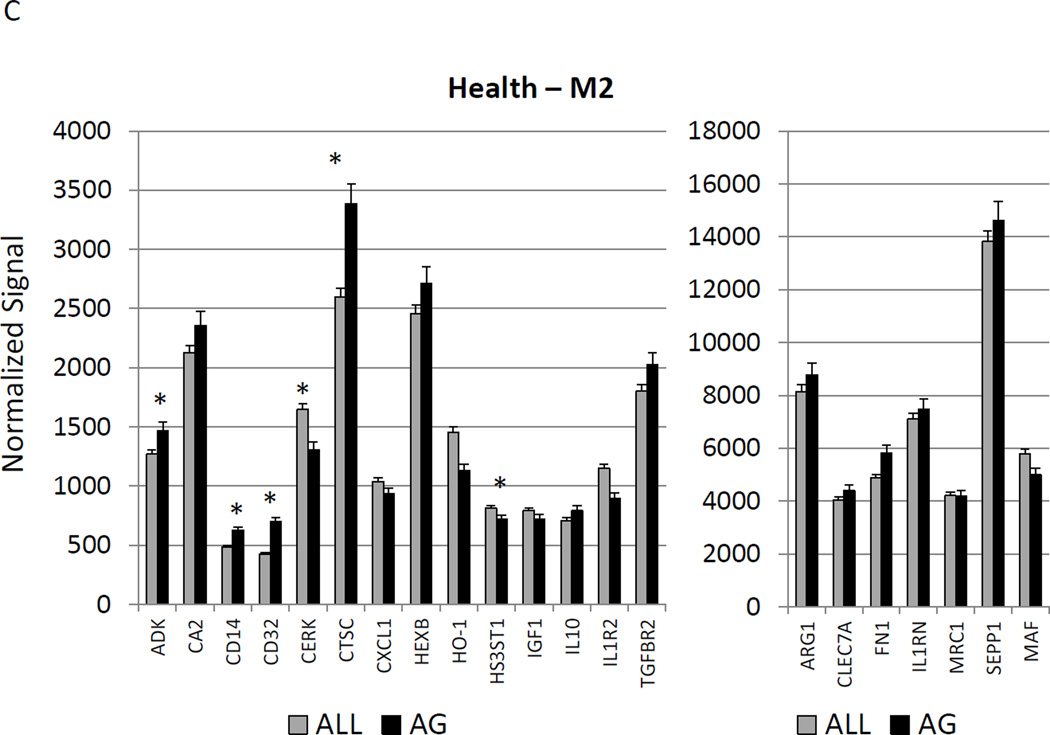
Figure 2A–C show a comparison of specific gene expression related to M1/M2, M1, or M2 cellular activities in the tissues. In these figures, the expression level in healthy aged tissues was compared with the level in all other age groups. As was suggested in the summary data in Figure 1, of the 19 genes in M1/M2 panel, 15 were significantly increased in the aged animals. M1 cell activity described by gene expression of 23 genes showed 8 significantly increased in aged healthy tissues including chemokines and multiple receptors (e.g. CCR2, CCR7, TLR4). Twenty-two genes were included in the M2 profile with 7 increased in aging healthy tissues, primarily surface receptors, including CD14.
Figure 2.
Age-related changes in the gingival expression of macrophage polarization-associated genes (A) depicts expression levels of genes indicative of M1/M2 macrophages in healthy tissues. (B) shows expression levels of M1 genes and (C) of M2 genes in healthy tissues. The bars compare mean levels and the vertical brackets 1 SD, of expression in the aged animals tissues (AG) compared to gingival tissues from other age groups (ALL). Statistical analysis (*) denotes difference at least at p<0.05 using analysis of Log2 transformed data.
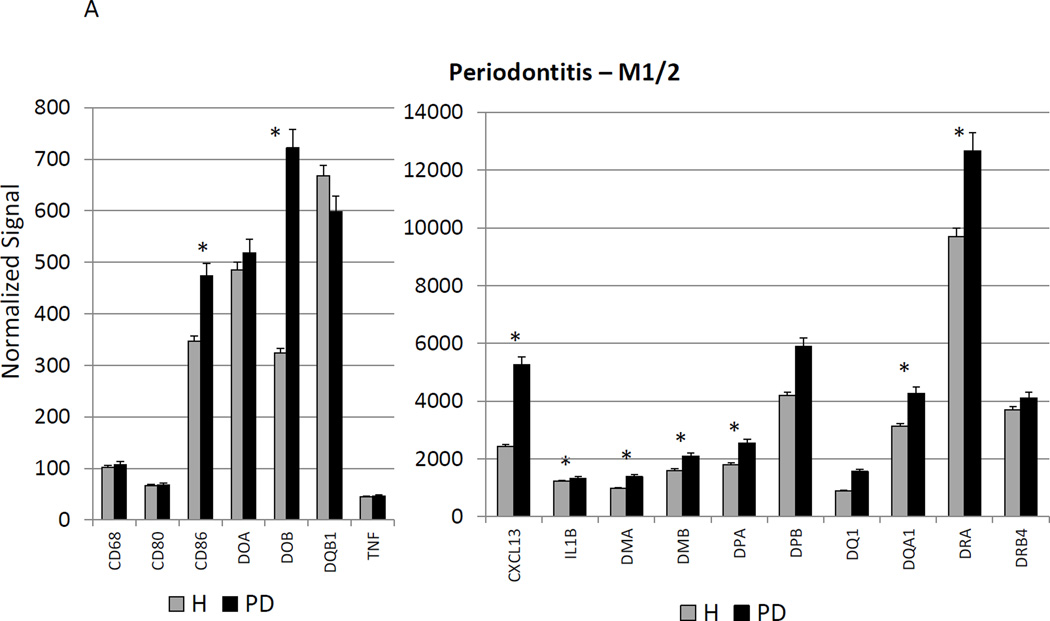
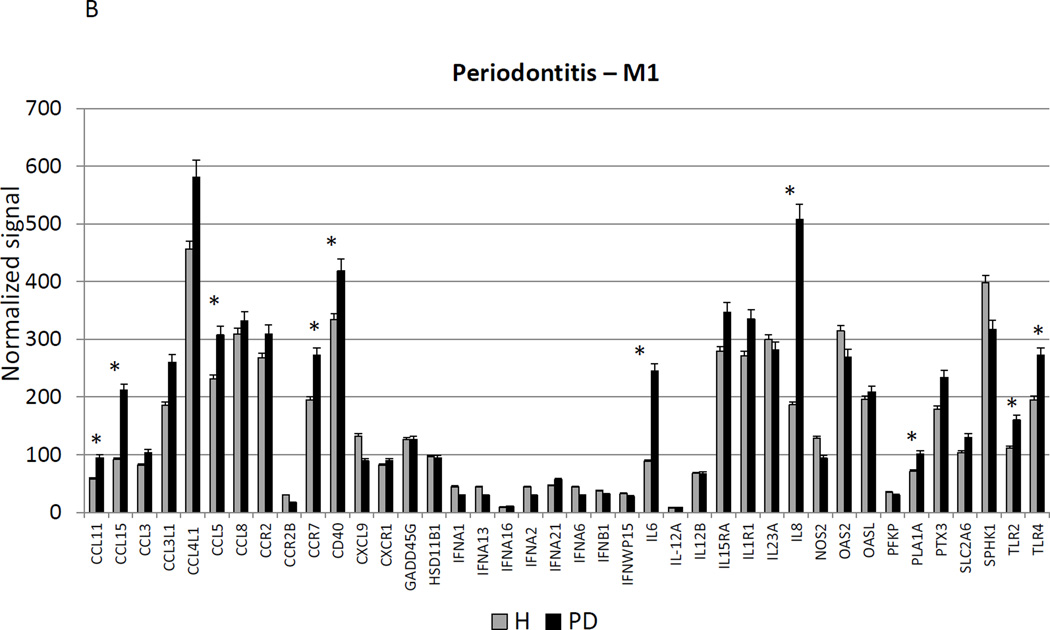
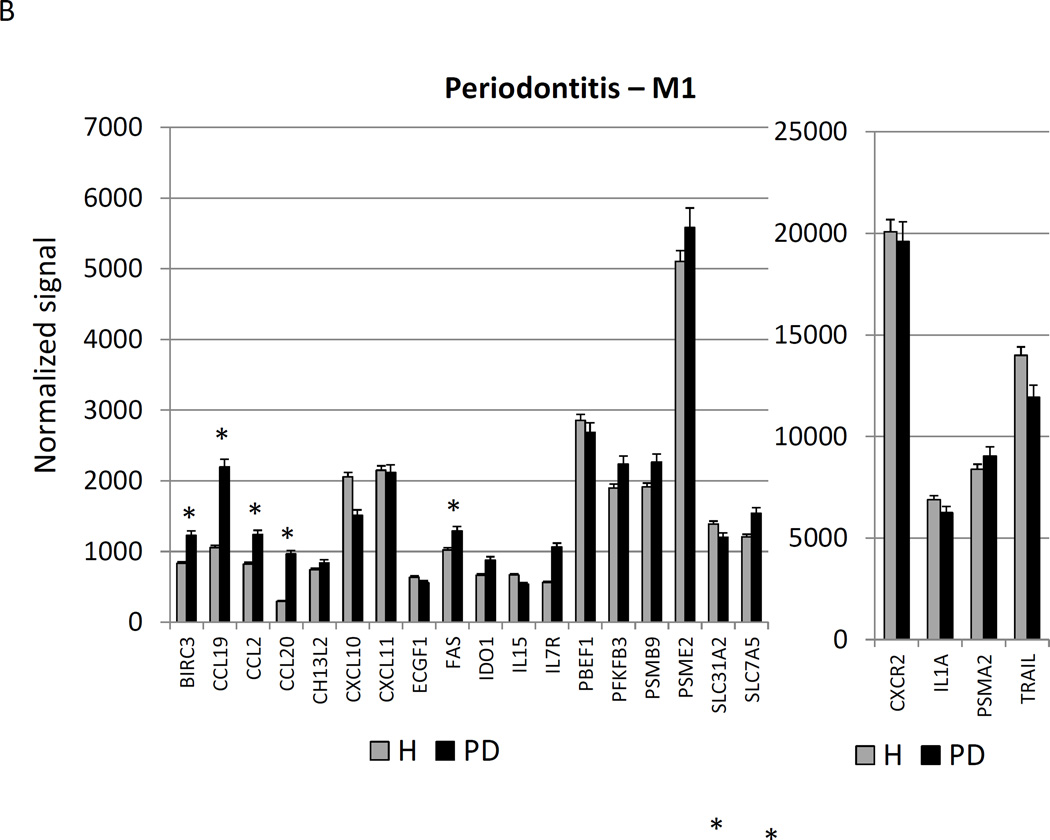
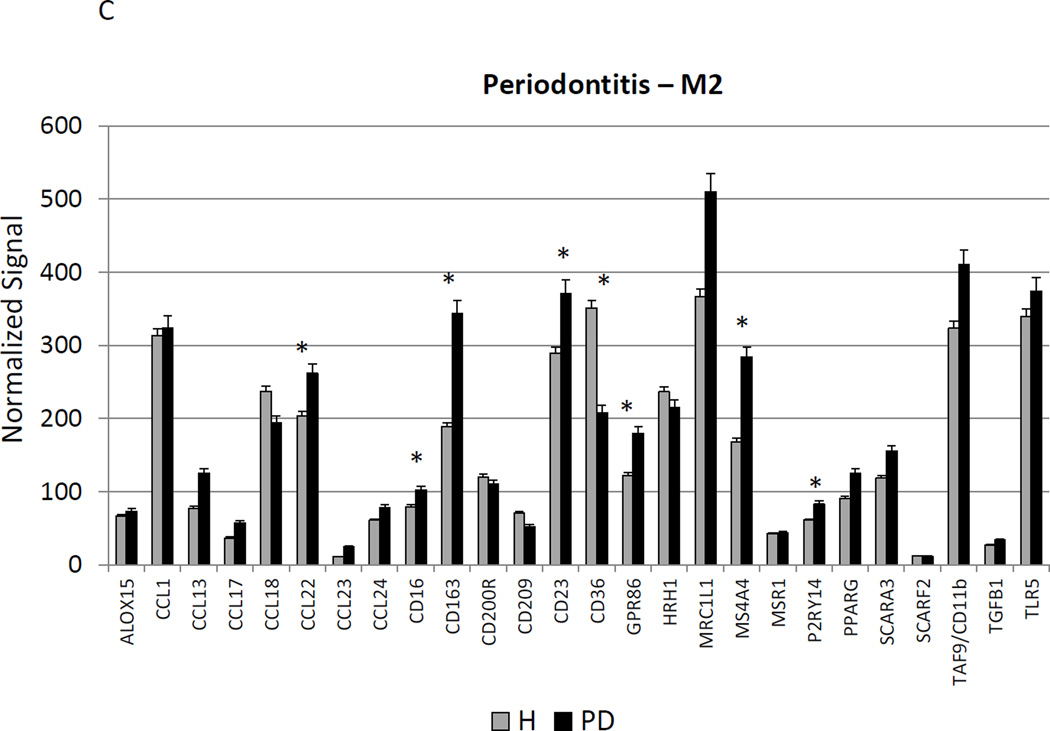
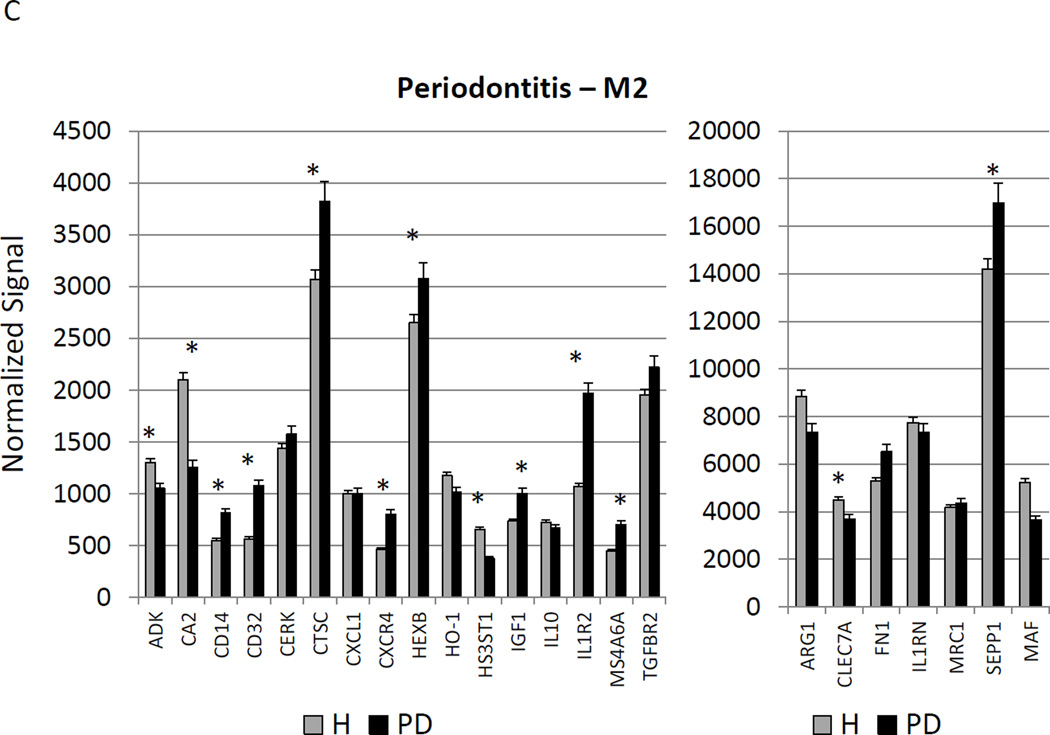
Figure 3A–C provides a similar comparison for the various macrophage phenotypes in periodontitis tissues compared to healthy adult and aged tissues. Twelve of the M1/2 genes were expressed at even greater levels in periodontitis versus the healthy tissues, including the pan-macrophage marker, CD68. With M1 gene expression profiles 9/23 were significantly increased with periodontitis including factors for communication with both T (CCL5, CCL19) and B (CCL19, CCR7) cells. Six of 22 M2 genes were also significantly increased in periodontitis tissues. Most of the up-regulated genes tended to be macrophage specific factors, including various scavenger receptors (SRA, CD163). Interestingly, IL1R2 (a decoy receptor for IL-1 proteins) gene levels were also up-regulated in the periodontitis tissues. Table 3 provides a summary of an evaluation of a subset of genes comparing levels of expression differences using the microarray technology and qPCR. These results demonstrate general agreement of the differences in expression using the individual technologies.
Figure 3.
Changes in the gingival expression of macrophage polarization-associated genes with periodontitis (A) depicts expression levels of genes indicative of M1/M2 macrophages in periodontitis and healthy tissues from adult and aged animals. (B) shows expression levels of M1 genes and (C) of M2 genes. The bars compare mean levels and the vertical brackets 1 SD, of expression in the healthy adult/aged animals tissues (Health) compared to periodontitis tissues from adult/aged animals (PD). Statistical analysis (*) denotes difference at least at p<0.05 using analysis of Log2 transformed data.
Table 3.
Comparison of expression levels of selected genes with GeneChip and qPCR. Levels are expressed as fold difference compared to Adult Healthy tissues assigned a value of 1.00.
| GENE ID | AGED HEALTHY |
ADULT PERIODONTITIS |
AGED PERIODONTITIS |
|---|---|---|---|
| IL6 | |||
| qPCR | 3.54 | 31.52 | 5.02 |
| GeneChip | 1.84 | 3.29 | 4.87 |
| CXCL13 | |||
| qPCR | 3.40 | 9.40 | 4.10 |
| GeneChip | 1.88 | 2.31 | 3.83 |
| CCL19 | |||
| qPCR | 3.20 | 5.31 | 3.70 |
| GeneChip | 1.64 | 2.39 | 3.14 |
| CD14 | |||
| qPCR | 1.73 | 1.46 | −1.28 |
| GeneChip | 1.28 | 1.60 | 1.15 |
| IL1R2 | |||
| qPCR | 1.34 | 2.09 | 5.00 |
| GeneChip | 1.02 | 2.46 | 1.22 |
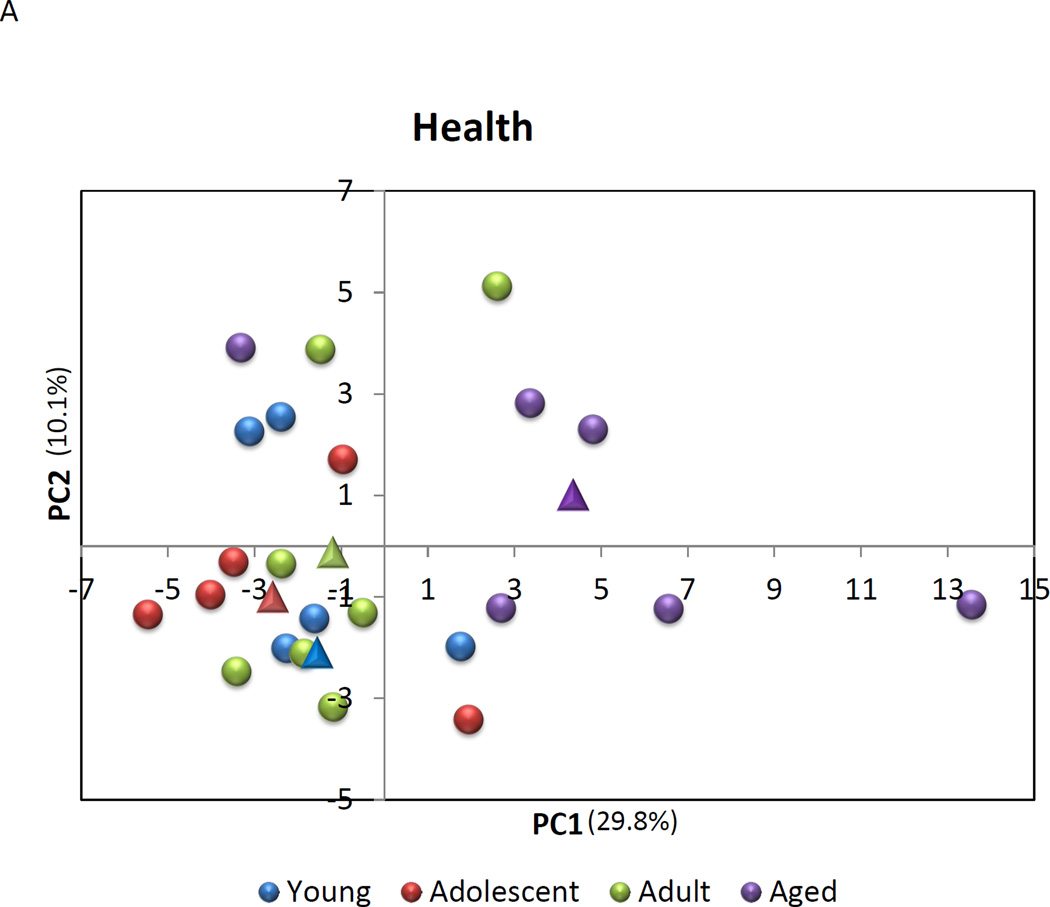
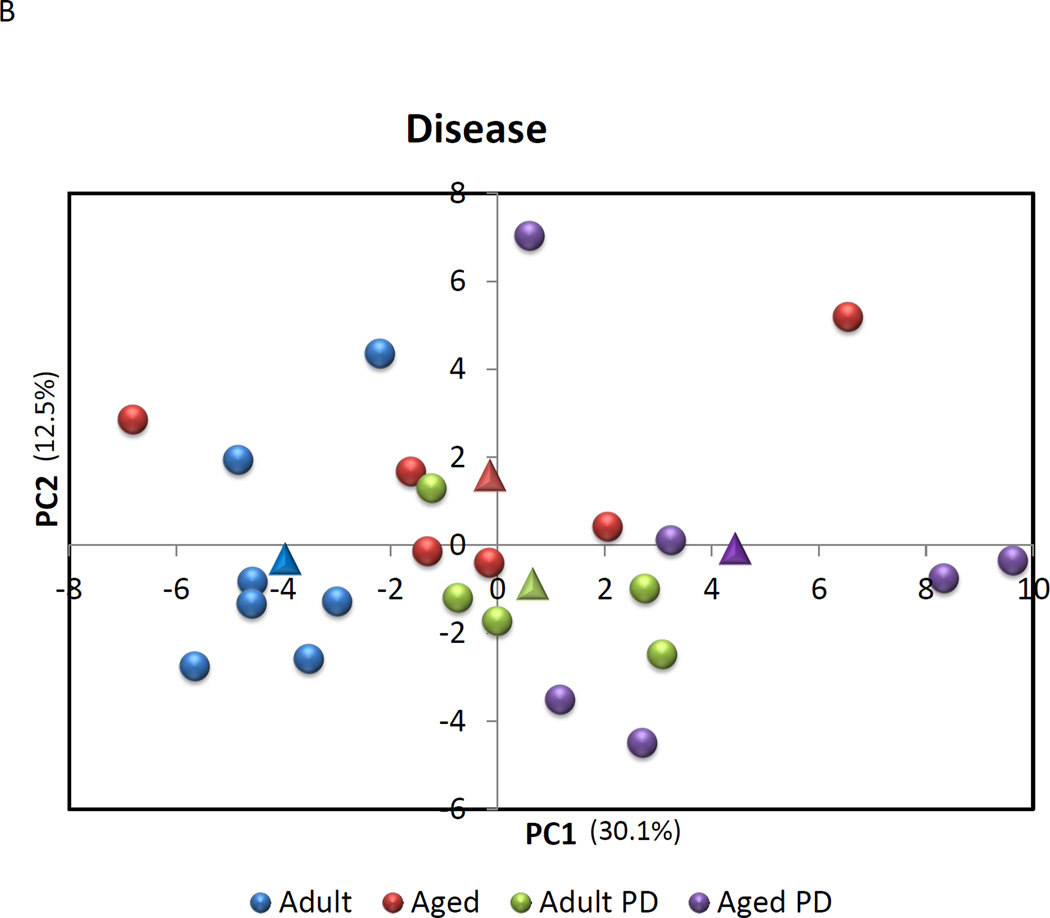
A Principal Components Analysis was then performed to evaluate the capacity of expression of this set of genes to discriminate across age groups in health, as well as between healthy and periodontitis tissues. The results in Figure 4A & B suggest that the macrophage gene footprints provide some unique features to these tissues. In healthy tissues, 5/6 of the samples from aged animals demonstrated a grouping compared to healthy gingiva from the other age groups. The results indicated that nearly 40% of the variation in macrophage gene expression could be explained by age in these healthy tissues. Similarly, the periodontitis tissues from aged and adult animals (9/11) grouped differentially from the healthy tissues with 42.6% of the variation in gene expression related to the presence of periodontitis in these tissues.
Figure 4.
Principal Components Analysis of gene expression profiles of macrophages in (A) healthy gingival tissues from 4 age groups or (B).comparing expression in healthy to periodontitis tissues from adult and aged animals. Each point denotes the relative position using 2 PC factors for each animal. The triangles denote the mean PC1 and PC2 for each of the groups.
An additional comparison was undertaken to assess the relationship of specific gene expression profiles with clinical features of periodontal health and disease. Table 4 provides a summary of the correlations that were identified. Multiple genes indicative of general macrophage activity correlated positively with both BOP and PPD in the animals, supporting that an increase in clinical features of disease was related to overall macrophage numbers. An array of cytokine, chemokine, and receptor genes for M1 macrophages were positively correlated with the clinical disease features. Interestingly, IL15, a cytokine from monocytes that elicits cell proliferation of NK cells, and SPHK1 (sphingosine kinase 1) that phosphorylates sphingosine yielding sphingosine-1-phosphate, a key sphingolipid signaling molecule involved in cell growth, survival, differentiation, and motility. The majority of M2 genes that correlated with disease measures were cell surface receptors for an array of intrinsic and extrinsic ligands. Four M2 genes were significantly negatively correlated with the clinical measures. CD36, class B scavenger receptor for altered phospholipids and lipoproteins; CLEC7A (Dectin-1), a pattern recognition receptor for fungal glucans; HS3ST1 (Heparan sulfate glucosamine 3-O-sulfotransferase 1) generates heparan sulfate structures; and MAF (v-maf), activates the expression of IL4 in T helper 2 cells.
Table 4.
Correlation of gene expression related to clinical presentation of the level of bleeding and probing pocket depth for the site sampled. The data evaluated the relationship of these clinical parameters in the adult and aged groups for both healthy and periodontitis sites (n=24). Any correlation value >0.5150 or <−0.5150 is statistically significant at least at p<0.01.
| GENE ID | BOP | PPD | GENE ID | BOP | PPD |
|---|---|---|---|---|---|
| Phenotype M1/2 | SPHK1 | −0.3324 | −0.5324 | ||
| CD86 | 0.5871 | 0.7175 | TLR2 | 0.6092 | 0.5614 |
| CXCL13 | 0.5723 | 0.6838 | Phenotype M2 | ||
| IL1B | 0.3373 | 0.5293 | CD14 | 0.7407 | 0.76770 |
| MAMU-DMA | 0.4353 | 0.6400 | CD16 | 0.4454 | 0.5830 |
| MAMU-DMB | 0.4306 | 0.6086 | CD23 | 0.4948 | 0.6011 |
| MAMU-DOB | 0.4894 | 0.5936 | CD32 | 0.6395 | 0.6259 |
| MAMU-DPA | 0.4562 | 0.5547 | CD36 | −0.3367 | −0.5356 |
| MAMU-DPB | 0.4206 | 0.5894 | CD163 | 0.6326 | 0.7593 |
| MAMU-DQA1 | 0.4065 | 0.5874 | CLEC7A | −0.5450 | −0.5361 |
| MAMU-DRA | 0.4871 | 0.5907 | CTSC | 0.5529 | 0.6255 |
| Phenotype M1 | CXCR4 | 0.6293 | 0.7937 | ||
| BIRC3 | 0.5098 | 0.7123 | GPR86 | 0.5881 | 0.6719 |
| CCL11 | 0.3275 | 0.5426 | HS3ST1 | −0.5435 | −0.3484 |
| CCL19 | 0.5384 | 0.7244 | MS4A4 | 0.5856 | 0.6956 |
| CCL20 | 0.6166 | 0.7093 | MS4A6A | 0.4227 | 0.6621 |
| CCL5 | 0.4005 | 0.5166 | P2RY14 | 0.5709 | 0.6007 |
| CCR7 | 0.5208 | 0.6917 | SEPP1 | 0.4469 | 0.5341 |
| CD40 | 0.5888 | 0.7274 | TAF9/CD11b | 0.3692 | 0.5190 |
| IL6 | 0.5723 | 0.6610 | v-maf | −0.6996 | −0.7735 |
| IL15 | −0.4150 | −0.5156 | |||
| IL15RA | 0.4414 | 0.5544 | |||
| IL1R1 | 0.5446 | 0.5330 | |||
| IL7R | 0.6331 | 0.7273 | |||
| SLC7A5 | 0.4361 | 0.6061 | |||
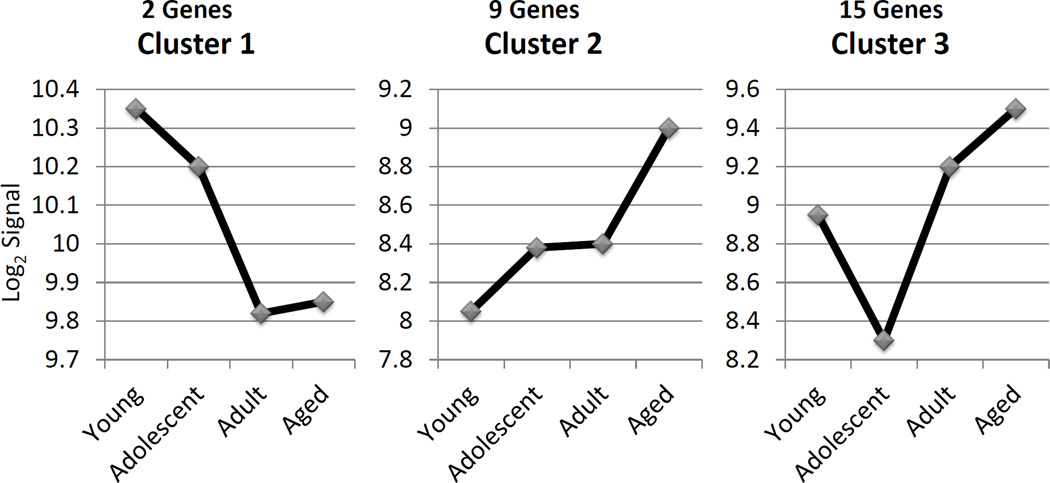
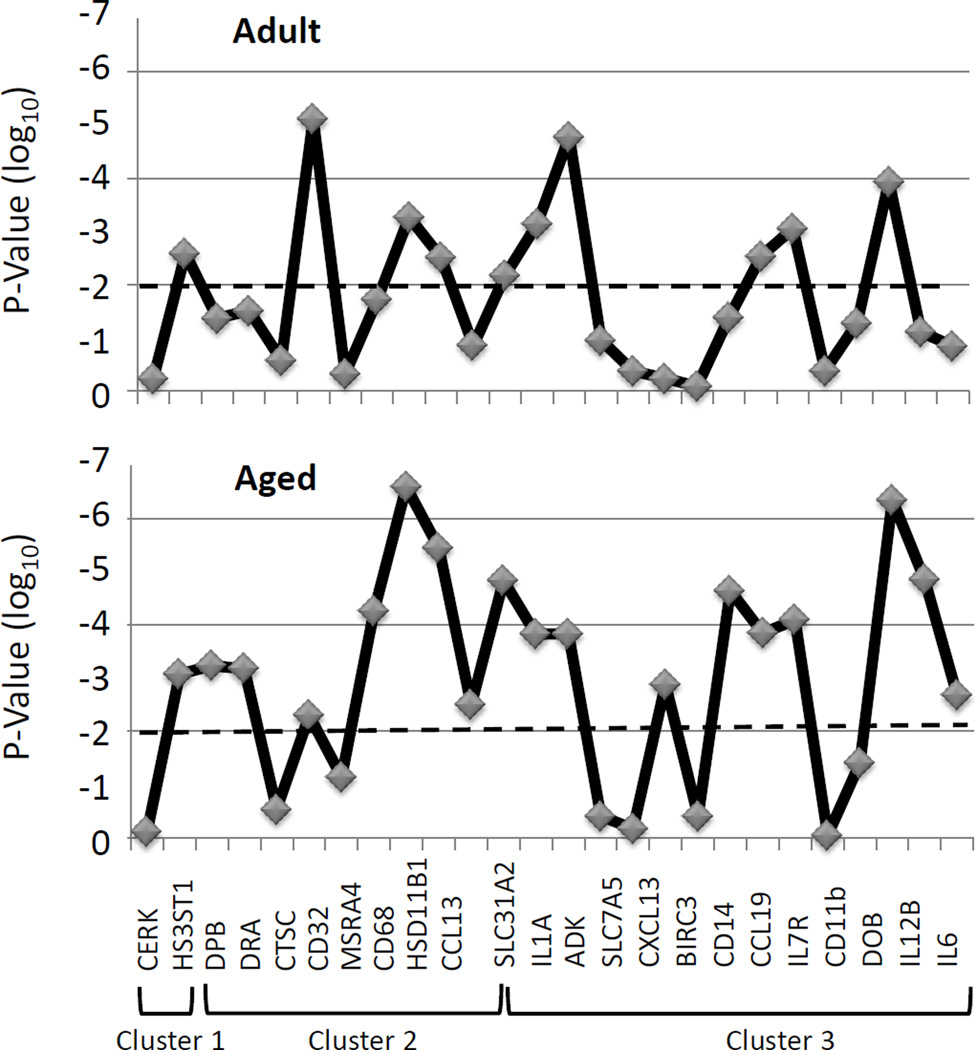
We then evaluated this array of genes related to macrophage phenotype via a cluster analysis, targeting genes that were significantly different (p<0.01, fold difference ≥2) between various age groups of healthy tissues. The results demonstrated 26 genes that sorted into 3 clusters (Figure 5) with distinct profiles across the age groups. Table 5 lists the genes in these Clusters, with M1/M2 genes found in both clusters 2 and 3. Generally M1 genes were found in Cluster 3 and M2 genes in Clusters 1, 2, and 3. An extension of the analysis of these clusters in shown in Figure 6 in which we evaluated the statistical difference in expression of each of these 26 genes comparing levels in adult or aging periodontitis tissues to the expression in healthy tissues. The results demonstrated that 18/26 genes were expressed significantly differently in the aging periodontitis tissues, and only 10/26 in the adult periodontitis tissues.
Figure 5.
Describes the gene clusters for expression across the healthy age groups. The included genes showed a statistical difference at least at p<0.01 and a fold of of ≥2 between at least 2 groups.
Table 5.
Gene IDs for expression clusters of macrophage phenotypes
| Cluster | MΦ Type | Gene ID |
|---|---|---|
| 1 | M2 | CERK |
| 1 | M2 | HS3ST1 |
| 2 | M1/M2 | MAMU-DPA |
| 2 | M1/M2 | MAMU-DRA |
| 2 | M1/M2 | CD68 |
| 2 | M1 | PLA1A |
| 2 | M1 | HSD11B1 |
| 2 | M2 | CTSC |
| 2 | M2 | CD32 |
| 2 | M2 | MS4A4 |
| 2 | M2 | CCL13 |
| 3 | M1/M2 | CXCL13 |
| 3 | M1/M2 | MAMU-DOB |
| 3 | M1 | IL6 |
| 3 | M1 | CHI3L2 |
| 3 | M1 | SLC31A2 |
| 3 | M1 | SLC7A5 |
| 3 | M1 | IL1A |
| 3 | M1 | BIRC3 |
| 3 | M1 | IL7R |
| 3 | M1 | CCL19 |
| 3 | M1 | IL12B |
| 3 | M2 | ADK |
| 3 | M2 | CD14 |
| 3 | M2 | CD86 |
| 3 | M2 | CD11b |
Figure 6. Description of levels of significant differences in gene cluster expression in samples from adult (AD PD) and aged (AG PD) periodontitis tissues compared with levels in healthy tissues across the age groups. The horizontal dashed line denotes p=0.01.
DISCUSSION
This study examined gene expression footprints of macrophage phenotypes in healthy gingival tissues with aging in nonhuman primates representing approximately 9–80 year old humans. The results demonstrated a significant increase in gene expression consistent with profiles of macrophage phenotypes and function, particularly in aged healthy tissues. This change appeared to represent an increase in M1 macrophages based upon the relative change in gene expression reflecting this subset of cells, with a small change in M2 cell gene patterns. With periodontitis in both adults and aged animals there was a significant increase in expression of genes indicative of M1 cells, with aged periodontitis tissues having the highest expression levels. Expression of genes related to the M2 phenotype of cells was only increased in aged periodontitis tissues compared to healthy tissues. Finally, the change in gene expression for M1 cells increased to a level that in aged periodontitis tissues the ratio of relative levels of expression for M1 and M1/M2 cells was equal. These results suggested a differential pattern of macrophage infiltration/differentiation/maturation in aged healthy tissues that tended towards increased inflammatory and tissue destructive macrophages (M1), even in healthy aged tissues. Thus, as we have found previously exploring gene expression profiles for other pathways (Gonzalez, Stromberg, Huggins, Gonzalez-Martinez, Novak and Ebersole, 2011, Gonzalez, John Novak, Kirakodu, Stromberg, Shen, Orraca, Gonzalez-Martinez and Ebersole, 2013, Gonzalez, Novak, Kirakodu, Orraca, Chen, Stromberg, Gonzalez-Martinez and Ebersole, 2014, Ebersole, Kirakodu, Novak, Stromberg, Shen, Orraca, Gonzalez-Martinez, Burgos and Gonzalez, 2014), while apparently clinically healthy, the aged gingival tissues seem to be fundamentally altered in the local environmental milieu of cellular functions that may present an enhanced predisposition to a tissue destructive process when challenged with a more pathogenic microbial stimulus. Additionally, in periodontitis tissues, increases in gene expression reflecting an increase in total macrophage populations appeared to be primarily related to increases in M1 cells, reflecting a response more skewed towards tissue destructive inflammation than was observed even in the adult periodontitis tissues.
Macrophages are effective at antigen processing and presentation (APCs) and are particularly adept at stimulating T cells for controlling the quality of T effector cells (Mahnke, Ring, Bedke, Karakhanova and Enk, 2008, Zanoni and Granucci, 2012, Gray and Cyster, 2012, Kelsall, 2008). These cells also play a critical role in innate immunity, responding to microbial challenge and producing elevated levels of various cytokines that contribute to host innate defenses (Locati, Mantovani and Sica, 2013, Zanoni and Granucci, 2012, Striz, Brabcova, Kolesar and Sekerkova, 2014, den Haan and Kraal, 2012). These cells recognize and respond to microbial structures using pathogen-associated molecular patterns (PAMPs/MAMPs), which decorate the surface of the macrophage enabling uptake of antigenic components and triggering activation and phenotype plasticity after engagement of microbial or viral pathogens as ligands (Papadopoulos, Weinberg, Massari, Gibson, Wetzler, Morgan and Genco, 2013, Kolli, Velayutham and Casola, 2013, Salomao, Brunialti, Rapozo, Baggio-Zappia, Galanos and Freudenberg, 2012). As such in the gene expression patterns evaluated, TLR2 and TLR4 were both up-regulated in aged healthy tissues and in particular in aged periodontitis tissues, consistent with increases in the M1 phenotype of macrophages.
Thus, beyond the PAMPs/MAMPs engaging microbes or their products to trigger inflammatory responses, these processes are also linked to up-regulation of MHC class I and II molecules, costimulatory molecules (CD40, CD80, CD86), and adhesion molecules (Makala, Nishikawa, Suzuki and Nagasawa, 2004, Bailey, Carpentier, McMahon, Begolka and Miller, 2006, Ramachandra, Simmons and Harding, 2009) for various cell types. Both CD80 and CD86 levels were increased in healthy aged gingival tissues, and CD86 continued to increase in the periodontitis tissues. In a similar fashion, an array of MHC II molecules were increased in both aged tissues and periodontitis tissues, as was expression of the pan-macrophage marker, CD68, and IL-6 that has a role in maturation of monocytes towards a macrophage phenotype (Gabay, 2006). CD40 indicative of M1 cells was only significantly increased in the periodontitis tissues.
Following maturation, the APCs produce a repertoire of cytokines, enabling communication with both B and T cells as major effector cells for antigen processing and presentation in adaptive immunity (Ramachandra, Simmons and Harding, 2009, Tugal, Liao and Jain, 2013). Recent evidence has emphasized the plasticity of macrophage phenotypes and functions and demonstrated selective functions of the subsets of macrophages related to inflammation, antigen processing/presentation, and resolution of inflammation and wound healing (Zhou, Huang, Lin, Zhan, Kong, Fang and Li, 2014, Labonte, Tosello-Trampont and Hahn, 2014, Mantovani, Biswas, Galdiero, Sica and Locati, 2013, Locati, Mantovani and Sica, 2013, Rodriguez, Domingo, Municio, Alvarez, Hugo, Fernandez and Sanchez Crespo, 2014). However, selection of macrophage differentiation into these functional types, driven by microbial stimuli or the local host environment remains to be addressed in gingival tissues. In healthy aging tissues, increases in an array of chemokines related to T cell chemoattraction and maturation were identified. These included CCL19 (MIP-3β), CCL5 (RANTES), CCL8 (MCP-2), CXCL9 (MIG), CXCL10 (IP-10), and CXCL11 (I-TAC) all indicative of functional attributes of M1 macrophages. Even greater increases in a number of the chemokines were noted in the periodontitis tissues. In addition, molecules that contribute to macrophage chemotaxis, expansion and maturation were also observed in the periodontitis tissues, i.e. CCL2 (MCP-1) and CCL13 (MCP-4). Additionally, an array of chemokines interacting with B cells was increased in healthy aged tissues including CCL19, CXCL13 (BLC) and CCR7 the receptor for CCL19 related to M1 macrophage functions (Martinez, Gordon, Locati and Mantovani, 2006).
Mucosal tissues are colonized by an extremely dense and diverse microbiota of commensal bacteria, as well as occasionally having to interact with a range of stimuli including pathogenic microorganisms (Socransky, Haffajee, Cugini, Smith and Kent, 1998, Tatakis and Kumar, 2005, Dye, Choudhary, Shea and Papapanou, 2005, D’Aiuto, Parkar, Andreou, Suvan, Brett, Ready and Tonetti, 2004, Pedron and Sansonetti, 2008). These sites continuously sample foreign material via various cells types, including macrophages and dendritic cells, which are innate immune cells within the skin and mucosa, including oral and gingival epithelium, that respond rapidly to infection, carrying crucial information about the infection to lymph nodes to trigger an immune response (Kopitar, Ihan Hren and Ihan, 2006, Nestle, Thompson, Shimizu, Turka and Nickoloff, 1994, Makino, Utsunomiya, Maeda, Shimokubo, Izumo and Baba, 2001, Jotwani, Palucka, Al-Quotub, Nouri-Shirazi, Kim, Bell, Banchereau and Cutler, 2001). A range of these APCs, including macrophages have been identified in the periodontium, with data providing phenotypic description of these cells, detecting changes in these cell populations with progressing periodontal disease, and demonstrating in vitro that these APCs can function in antigen-presentation critical in controlling the adaptive antibody response patterns in periodontal disease to individual bacteria (Jotwani, Palucka, Al-Quotub, Nouri-Shirazi, Kim, Bell, Banchereau and Cutler, 2001, Cohen, Morisset and Emilie, 2004, Mahanonda, Sa-Ard-Iam, Yongvanitchit, Wisetchang, Ishikawa, Nagasawa, Walsh and Pichyangkul, 2002, Cutler, Jotwani, Palucka, Davoust, Bell and Banchereau, 1999, Jotwani, Pulendran, Agrawal and Cutler, 2003, Tanaka, Fakher, Barbour, Schenkein and Tew, 2006, Kikuchi, Willis, Liu, Purkall, Sukumar, Barbour, Schenkein and Tew, 2005, Kikuchi, Hahn, Tanaka, Barbour, Schenkein and Tew, 2004). Within the context of the subsets of macrophages that arise dependent upon the local environmental stimuli, the M2 phenotype of cells are considered to be primarily involved in contributing to humoral immune responses and associated with wound healing (Mantovani, Biswas, Galdiero, Sica and Locati, 2013, Ferrante and Leibovich, 2012). Thus, many markers for these cells are related to scavenger receptors and surface molecule expression to regulate downstream effector cells. We noted increases in CD209 (DC-SIGN), SRA (scavenger receptor A), and MRC1L1 (mannose receptor) in healthy aged tissues. In addition, genes whose products link the macrophage with effector cells, including CCL22 (MDC, SCYA22), CD11b (integrin alpha M; ITGAM), and CD14 were all increased in healthy aging tissues. The changes in these genes are consistent with increases in M2 polarization in healthy aging tissues, and may provide some functional indication that these cells are important in maintaining health in the aged gingiva. With periodontitis, there was an additional increase in some of the scavenger receptors, SRA and CD163 (type B scavenger receptor), although this difference was less robust than the changes observed in healthy tissues. As in health, CCL22 and CD14 gene expression continued to increase in periodontitis tissues. Interestingly, gene expression of CD36, which is a class B scavenger receptor that binds numerous host factors, including collagen, thrombospondin, oxidized low density lipoproteins, and oxidized phospholipids, was significantly decreased in the periodontitis tissues. Finally, expression of IL1R2 that that binds IL-1α, IL-1β, and IL-1RA as a decoy receptor and inhibits their activities was up-regulated in the periodontitis tissues. While the changes in gene profiles for M2 cells in periodontitis were not as substantial as those related to M1 polarization, some of these alterations could support an effort by macrophages in the tissues to compete with the M1 cells and redirect towards a resolution process. Longitudinal studies of disease initiation and progression should enable a more clear definition of the kinetics and dynamics of macrophage polarization in gingival tissues that help to maintain homeostasis and gingival health versus changes that would reflect a biological progression of tissue destruction.
Acknowledgments
This work was supported by National Institute of Health grants P20GM103538 and UL1TR000117. We express our gratitude to the Caribbean Primate Research Center (CPRC) supported by grant P40RR03640, and the Microarray Core of University Kentucky for their invaluable technical assistance.
Footnotes
Conflict of Interest
The authors state no conflict of interest with any of the aspects of this study and report.
REFERENCES
- Armitage GC. Learned and unlearned concepts in periodontal diagnostics: a 50-year perspective. Periodontol 2000. 2013;62:20–36. doi: 10.1111/prd.12006. [DOI] [PubMed] [Google Scholar]
- Wade WG. The oral microbiome in health and disease. Pharmacol Res. 2013;69:137–143. doi: 10.1016/j.phrs.2012.11.006. [DOI] [PubMed] [Google Scholar]
- Hajishengallis G. The inflammophilic character of the periodontitis-associated microbiota. Mol Oral Microbiol. 2014 doi: 10.1111/omi.12065. [DOI] [PMC free article] [PubMed] [Google Scholar]
- Souza PP, Lerner UH. The role of cytokines in inflammatory bone loss. Immunological investigations. 2013;42:555–622. doi: 10.3109/08820139.2013.822766. [DOI] [PubMed] [Google Scholar]
- Hajishengallis E, Hajishengallis G. Neutrophil homeostasis and periodontal health in children and adults. J Dent Res. 2014;93:231–237. doi: 10.1177/0022034513507956. [DOI] [PMC free article] [PubMed] [Google Scholar]
- Scott DA, Krauss J. Neutrophils in periodontal inflammation. Frontiers of oral biology. 2012;15:56–83. doi: 10.1159/000329672. [DOI] [PMC free article] [PubMed] [Google Scholar]
- Smith M, Seymour GJ, Cullinan MP. Histopathological features of chronic and aggressive periodontitis. Periodontology 2000. 2010;53:45–54. doi: 10.1111/j.1600-0757.2010.00354.x. [DOI] [PubMed] [Google Scholar]
- Ebersole JL, Dawson DR, 3rd, Morford LA, Peyyala R, Miller CS, Gonzalez OA. Periodontal disease immunology: ‘double indemnity’ in protecting the host. Periodontol 2000. 2013;62:163–202. doi: 10.1111/prd.12005. [DOI] [PMC free article] [PubMed] [Google Scholar]
- Hajishengallis G. Too old to fight? Aging and its toll on innate immunity. Mol Oral Microbiol. 2010;25:25–37. doi: 10.1111/j.2041-1014.2009.00562.x. [DOI] [PMC free article] [PubMed] [Google Scholar]
- Bartold PM, Cantley MD, Haynes DR. Mechanisms and control of pathologic bone loss in periodontitis. Periodontol 2000. 2010;53:55–69. doi: 10.1111/j.1600-0757.2010.00347.x. [DOI] [PubMed] [Google Scholar]
- Merry R, Belfield L, McArdle P, McLennan A, Crean S, Foey A. Oral health and pathology: a macrophage account. The British journal of oral & maxillofacial surgery. 2012;50:2–7. doi: 10.1016/j.bjoms.2010.10.020. [DOI] [PubMed] [Google Scholar]
- Anjana R, Joseph L, Suresh R. Immunohistochemical localization of CD1a and S100 in gingival tissues of healthy and chronic periodontitis subjects. Oral Dis. 2012;18:778–785. doi: 10.1111/j.1601-0825.2012.01945.x. [DOI] [PubMed] [Google Scholar]
- Cutler CW, Teng YT. Oral mucosal dendritic cells and periodontitis: many sides of the same coin with new twists. Periodontol 2000. 2007;45:35–50. doi: 10.1111/j.1600-0757.2007.00222.x. [DOI] [PMC free article] [PubMed] [Google Scholar]
- Ley K, Miller YI, Hedrick CC. Monocyte and macrophage dynamics during atherogenesis. Arterioscler Thromb Vasc Biol. 2011;31:1506–1516. doi: 10.1161/ATVBAHA.110.221127. [DOI] [PMC free article] [PubMed] [Google Scholar]
- Yona S, Jung S. Monocytes: subsets, origins, fates and functions. Current opinion in hematology. 2010;17:53–59. doi: 10.1097/MOH.0b013e3283324f80. [DOI] [PubMed] [Google Scholar]
- Geissmann F, Manz MG, Jung S, Sieweke MH, Merad M, Ley K. Development of monocytes, macrophages, and dendritic cells. Science. 2010;327:656–661. doi: 10.1126/science.1178331. [DOI] [PMC free article] [PubMed] [Google Scholar]
- Zhou D, Huang C, Lin Z, Zhan S, Kong L, Fang C, Li J. Macrophage polarization and function with emphasis on the evolving roles of coordinated regulation of cellular signaling pathways. Cellular signalling. 2014;26:192–197. doi: 10.1016/j.cellsig.2013.11.004. [DOI] [PubMed] [Google Scholar]
- Labonte AC, Tosello-Trampont AC, Hahn YS. The Role of Macrophage Polarization in Infectious and Inflammatory Diseases. Molecules and cells. 2014 doi: 10.14348/molcells.2014.2374. [DOI] [PMC free article] [PubMed] [Google Scholar]
- Mantovani A, Biswas SK, Galdiero MR, Sica A, Locati M. Macrophage plasticity and polarization in tissue repair and remodelling. The Journal of pathology. 2013;229:176–185. doi: 10.1002/path.4133. [DOI] [PubMed] [Google Scholar]
- Locati M, Mantovani A, Sica A. Macrophage activation and polarization as an adaptive component of innate immunity. Advances in immunology. 2013;120:163–184. doi: 10.1016/B978-0-12-417028-5.00006-5. [DOI] [PubMed] [Google Scholar]
- Sica A, Mantovani A. Macrophage plasticity and polarization: in vivo veritas. J Clin Invest. 2012;122:787–795. doi: 10.1172/JCI59643. [DOI] [PMC free article] [PubMed] [Google Scholar]
- Biswas SK, Chittezhath M, Shalova IN, Lim JY. Macrophage polarization and plasticity in health and disease. Immunol Res. 2012;53:11–24. doi: 10.1007/s12026-012-8291-9. [DOI] [PubMed] [Google Scholar]
- Maldonado-Lopez R, De Smedt T, Pajak B, Heirman C, Thielemans K, Leo O, Urbain J, Maliszewski CR, Moser M. Role of CD8alpha+ and CD8alpha- dendritic cells in the induction of primary immune responses in vivo. J Leukoc Biol. 1999;66:242–246. doi: 10.1002/jlb.66.2.242. [DOI] [PubMed] [Google Scholar]
- Maldonado-Lopez R, Moser M. Dendritic cell subsets and the regulation of Th1/Th2 responses. Semin Immunol. 2001;13:275–282. doi: 10.1006/smim.2001.0323. [DOI] [PubMed] [Google Scholar]
- Banchereau J, Briere F, Caux C, Davoust J, Lebecque S, Liu YJ, Pulendran B, Palucka K. Immunobiology of dendritic cells. Annu Rev Immunol. 2000;18:767–811. doi: 10.1146/annurev.immunol.18.1.767. [DOI] [PubMed] [Google Scholar]
- Ebersole JL, Steffen MJ, Gonzalez-Martinez J, Novak MJ. Effects of age and oral disease on systemic inflammatory and immune parameters in nonhuman primates. Clin Vaccine Immunol. 2008;15:1067–1075. doi: 10.1128/CVI.00258-07. [DOI] [PMC free article] [PubMed] [Google Scholar]
- Meka A, Bakthavatchalu V, Sathishkumar S, Lopez MC, Verma RK, Wallet SM, Bhattacharyya I, Boyce BF, Handfield M, Lamont RJ, Baker HV, Ebersole JL, Kesavalu L. Porphyromonas gingivalis infection-induced tissue and bone transcriptional profiles. Mol Oral Microbiol. 25:61–74. doi: 10.1111/j.2041-1014.2009.00555.x. [DOI] [PMC free article] [PubMed] [Google Scholar]
- Gonzalez OA, Stromberg AJ, Huggins PM, Gonzalez-Martinez J, Novak MJ, Ebersole JL. Apoptotic genes are differentially expressed in aged gingival tissue. J Dent Res. 2011;90:880–886. doi: 10.1177/0022034511403744. [DOI] [PMC free article] [PubMed] [Google Scholar]
- Gonzalez OA, John Novak M, Kirakodu S, Stromberg AJ, Shen S, Orraca L, Gonzalez-Martinez J, Ebersole JL. Effects of aging on apoptosis gene expression in oral mucosal tissues. Apoptosis. 2013;18:249–259. doi: 10.1007/s10495-013-0806-x. [DOI] [PMC free article] [PubMed] [Google Scholar]
- Gonzalez OA, Novak MJ, Kirakodu S, Orraca L, Chen KC, Stromberg A, Gonzalez-Martinez J, Ebersole JL. Comparative analysis of gingival tissue antigen presentation pathways in ageing and periodontitis. J Clin Periodontol. 2014;41:327–339. doi: 10.1111/jcpe.12212. [DOI] [PMC free article] [PubMed] [Google Scholar]
- Ebersole JL, Kirakodu S, Novak MJ, Stromberg AJ, Shen S, Orraca L, Gonzalez-Martinez J, Burgos A, Gonzalez OA. Cytokine gene expression profiles during initiation, progression and resolution of periodontitis. J Clin Periodontol. 2014 doi: 10.1111/jcpe.12286. [DOI] [PMC free article] [PubMed] [Google Scholar]
- Martinez FO, Gordon S, Locati M, Mantovani A. Transcriptional profiling of the human monocyte-to-macrophage differentiation and polarization: new molecules and patterns of gene expression. J Immunol. 2006;177:7303–7311. doi: 10.4049/jimmunol.177.10.7303. [DOI] [PubMed] [Google Scholar]
- Mahnke K, Ring S, Bedke T, Karakhanova S, Enk AH. Interaction of regulatory T cells with antigen-presenting cells in health and disease. Chemical immunology and allergy. 2008;94:29–39. doi: 10.1159/000154854. [DOI] [PubMed] [Google Scholar]
- Zanoni I, Granucci F. Regulation and dysregulation of innate immunity by NFAT signaling downstream of pattern recognition receptors (PRRs) Eur J Immunol. 2012;42:1924–1931. doi: 10.1002/eji.201242580. [DOI] [PubMed] [Google Scholar]
- Gray EE, Cyster JG. Lymph node macrophages. Journal of innate immunity. 2012;4:424–436. doi: 10.1159/000337007. [DOI] [PMC free article] [PubMed] [Google Scholar]
- Kelsall B. Recent progress in understanding the phenotype and function of intestinal dendritic cells and macrophages. Mucosal Immunol. 2008;1:460–469. doi: 10.1038/mi.2008.61. [DOI] [PMC free article] [PubMed] [Google Scholar]
- Striz I, Brabcova E, Kolesar L, Sekerkova A. Cytokine networking of innate immunity cells: a potential target of therapy. Clinical science. 2014;126:593–612. doi: 10.1042/CS20130497. [DOI] [PubMed] [Google Scholar]
- den Haan JM, Kraal G. Innate immune functions of macrophage subpopulations in the spleen. Journal of innate immunity. 2012;4:437–445. doi: 10.1159/000335216. [DOI] [PMC free article] [PubMed] [Google Scholar]
- Papadopoulos G, Weinberg EO, Massari P, Gibson FC, 3rd, Wetzler LM, Morgan EF, Genco CA. Macrophage-specific TLR2 signaling mediates pathogen-induced TNF-dependent inflammatory oral bone loss. J Immunol. 2013;190:1148–1157. doi: 10.4049/jimmunol.1202511. [DOI] [PMC free article] [PubMed] [Google Scholar]
- Kolli D, Velayutham TS, Casola A. Host-Viral Interactions: Role of Pattern Recognition Receptors (PRRs) in Human Pneumovirus Infections. Pathogens. 2013;2 doi: 10.3390/pathogens2020232. [DOI] [PMC free article] [PubMed] [Google Scholar]
- Salomao R, Brunialti MK, Rapozo MM, Baggio-Zappia GL, Galanos C, Freudenberg M. Bacterial sensing, cell signaling, and modulation of the immune response during sepsis. Shock. 2012;38:227–242. doi: 10.1097/SHK.0b013e318262c4b0. [DOI] [PubMed] [Google Scholar]
- Makala LH, Nishikawa Y, Suzuki N, Nagasawa H. Immunology. Antigen-presenting cells in the gut. Journal of biomedical science. 2004;11:130–141. doi: 10.1159/000076025. [DOI] [PubMed] [Google Scholar]
- Bailey SL, Carpentier PA, McMahon EJ, Begolka WS, Miller SD. Innate and adaptive immune responses of the central nervous system. Critical reviews in immunology. 2006;26:149–188. doi: 10.1615/critrevimmunol.v26.i2.40. [DOI] [PubMed] [Google Scholar]
- Ramachandra L, Simmons D, Harding CV. MHC molecules and microbial antigen processing in phagosomes. Curr Opin Immunol. 2009;21:98–104. doi: 10.1016/j.coi.2009.01.001. [DOI] [PMC free article] [PubMed] [Google Scholar]
- Gabay C. Interleukin-6 and chronic inflammation. Arthritis research & therapy. 2006;8(Suppl 2):S3. doi: 10.1186/ar1917. [DOI] [PMC free article] [PubMed] [Google Scholar]
- Tugal D, Liao X, Jain MK. Transcriptional control of macrophage polarization. Arterioscler Thromb Vasc Biol. 2013;33:1135–1144. doi: 10.1161/ATVBAHA.113.301453. [DOI] [PubMed] [Google Scholar]
- Rodriguez M, Domingo E, Municio C, Alvarez Y, Hugo E, Fernandez N, Sanchez Crespo M. Polarization of the innate immune response by prostaglandin E2: a puzzle of receptors and signals. Molecular pharmacology. 2014;85:187–197. doi: 10.1124/mol.113.089573. [DOI] [PubMed] [Google Scholar]
- Socransky SS, Haffajee AD, Cugini MA, Smith C, Kent RL., Jr Microbial complexes in subgingival plaque. J Clin Periodontol. 1998;25:134–144. doi: 10.1111/j.1600-051x.1998.tb02419.x. [DOI] [PubMed] [Google Scholar]
- Tatakis DN, Kumar PS. Etiology and pathogenesis of periodontal diseases. Dent Clin North Am. 2005;49:491–516. doi: 10.1016/j.cden.2005.03.001. v. [DOI] [PubMed] [Google Scholar]
- Dye BA, Choudhary K, Shea S, Papapanou PN. Serum antibodies to periodontal pathogens and markers of systemic inflammation. J Clin Periodontol. 2005;32:1189–1199. doi: 10.1111/j.1600-051X.2005.00856.x. [DOI] [PubMed] [Google Scholar]
- D’Aiuto F, Parkar M, Andreou G, Suvan J, Brett PM, Ready D, Tonetti MS. Periodontitis and systemic inflammation: control of the local infection is associated with a reduction in serum inflammatory markers. J Dent Res. 2004;83:156–160. doi: 10.1177/154405910408300214. [DOI] [PubMed] [Google Scholar]
- Pedron T, Sansonetti P. Commensals, bacterial pathogens and intestinal inflammation: an intriguing menage a trois. Cell Host Microbe. 2008;3:344–347. doi: 10.1016/j.chom.2008.05.010. [DOI] [PubMed] [Google Scholar]
- Kopitar AN, Ihan Hren N, Ihan A. Commensal oral bacteria antigens prime human dendritic cells to induce Th1, Th2 or Treg differentiation. Oral Microbiol Immunol. 2006;21:1–5. doi: 10.1111/j.1399-302X.2005.00237.x. [DOI] [PubMed] [Google Scholar]
- Nestle FO, Thompson C, Shimizu Y, Turka LA, Nickoloff BJ. Costimulation of superantigen-activated T lymphocytes by autologous dendritic cells is dependent on B7. Cell Immunol. 1994;156:220–229. doi: 10.1006/cimm.1994.1166. [DOI] [PubMed] [Google Scholar]
- Makino M, Utsunomiya A, Maeda Y, Shimokubo S, Izumo S, Baba M. Association of CD40 ligand expression on HTLV-I-infected T cells and maturation of dendritic cells. Scand J Immunol. 2001;54:574–581. doi: 10.1046/j.1365-3083.2001.01003.x. [DOI] [PubMed] [Google Scholar]
- Jotwani R, Palucka AK, Al-Quotub M, Nouri-Shirazi M, Kim J, Bell D, Banchereau J, Cutler CW. Mature dendritic cells infiltrate the T cell-rich region of oral mucosa in chronic periodontitis: in situ, in vivo, and in vitro studies. J Immunol. 2001;167:4693–4700. doi: 10.4049/jimmunol.167.8.4693. [DOI] [PMC free article] [PubMed] [Google Scholar]
- Cohen N, Morisset J, Emilie D. Induction of tolerance by Porphyromonas gingivalis on APCS: a mechanism implicated in periodontal infection. J Dent Res. 2004;83:429–433. doi: 10.1177/154405910408300515. [DOI] [PubMed] [Google Scholar]
- Mahanonda R, Sa-Ard-Iam N, Yongvanitchit K, Wisetchang M, Ishikawa I, Nagasawa T, Walsh DS, Pichyangkul S. Upregulation of co-stimulatory molecule expression and dendritic cell marker (CD83) on B cells in periodontal disease. J Periodontal Res. 2002;37:177–183. doi: 10.1034/j.1600-0765.2002.00664.x. [DOI] [PubMed] [Google Scholar]
- Cutler CW, Jotwani R, Palucka KA, Davoust J, Bell D, Banchereau J. Evidence and a novel hypothesis for the role of dendritic cells and Porphyromonas gingivalis in adult periodontitis. J Periodontal Res. 1999;34:406–412. doi: 10.1111/j.1600-0765.1999.tb02274.x. [DOI] [PubMed] [Google Scholar]
- Jotwani R, Pulendran B, Agrawal S, Cutler CW. Human dendritic cells respond to Porphyromonas gingivalis LPS by promoting a Th2 effector response in vitro. Eur J Immunol. 2003;33:2980–2986. doi: 10.1002/eji.200324392. [DOI] [PubMed] [Google Scholar]
- Tanaka S, Fakher M, Barbour SE, Schenkein HA, Tew JG. Influence of proinflammatory cytokines on Actinobacillus actinomycetemcomitans specific IgG responses. J Periodontal Res. 2006;41:1–9. doi: 10.1111/j.1600-0765.2005.00829.x. [DOI] [PubMed] [Google Scholar]
- Kikuchi T, Willis DL, Liu M, Purkall DB, Sukumar S, Barbour SE, Schenkein HA, Tew JG. Dendritic-NK cell interactions in P. gingivalis-specific responses. J Dent Res. 2005;84:858–862. doi: 10.1177/154405910508400915. [DOI] [PubMed] [Google Scholar]
- Kikuchi T, Hahn CL, Tanaka S, Barbour SE, Schenkein HA, Tew JG. Dendritic cells stimulated with Actinobacillus actinomycetemcomitans elicit rapid gamma interferon responses by natural killer cells. Infect Immun. 2004;72:5089–5096. doi: 10.1128/IAI.72.9.5089-5096.2004. [DOI] [PMC free article] [PubMed] [Google Scholar]
- Ferrante CJ, Leibovich SJ. Regulation of Macrophage Polarization and Wound Healing. Advances in wound care. 2012;1:10–16. doi: 10.1089/wound.2011.0307. [DOI] [PMC free article] [PubMed] [Google Scholar]


