

Abstract
A theory for the calculation of resonant and nonresonant hole-burning (HB) spectra of pigment–protein complexes is presented and applied to the water-soluble chlorophyll-binding protein (WSCP) from cauliflower. The theory is based on a non-Markovian line shape theory (Renger and Marcus. J. Chem. Phys. 2002, 116, 9997) and includes exciton delocalization, vibrational sidebands, and lifetime broadening. An earlier approach by Reppert (J. Phys. Chem. Lett. 2011, 2, 2716) is found to describe nonresonant HB spectra only. Here we present a theory that can be used for a quantitative description of HB data for both nonresonant and resonant burning conditions. We find that it is important to take into account the excess energy of the excitation in the HB process. Whereas excitation of the zero-phonon transition of the lowest exciton state, that is, resonant burning allows the protein to access only its conformational substates in the neighborhood of the preburn state, any higher excitation gives the protein full access to all conformations present in the original inhomogeneous ensemble. Application of the theory to recombinant WSCP from cauliflower, reconstituted with chlorophyll a or chlorophyll b, gives excellent agreement with experimental data by Pieper et al. (J. Phys. Chem. B 2011, 115, 4053.) and allows us to obtain an upper bound of the lifetime of the upper exciton state directly from the HB experiments in agreement with lifetimes measured recently in time domain 2D experiments by Alster et al. (J. Phys. Chem. B 2014, 118, 3524.).
Introduction
Protein dynamics plays an essential role in many biophysical/biochemical processes in living organisms, like excitation energy and electron transfer in photosynthesis1 and in catalysis.2 In photosynthesis, proteins tune the optical properties of the pigments and dissipate the excess energy of electronic excitations of the pigments on their way from the light-harvesting antennae to the reaction center, where the conversion of light energy into chemical energy starts. The dissipation is possible by a dynamic modulation of transition energies of the pigments by the protein vibrations.3 Besides this dynamic modulation that appears in the homogeneous optical line shapes of the pigments, any conformational motion that is slower than the lifetime of excited pigment states (femtoseconds to nanoseconds), leads to static disorder that masks the homogeneous line shape by inhomogeneous broadening. The latter may be visualized, e.g., as spectral diffusion in single molecule experiments.4−6
Line narrowing spectroscopy is a valuable tool for deciphering the homogeneous line shape of inhomogeneously broadened systems.7−9 In fluorescence line narrowing (FLN) spectroscopy, an energetically narrow laser excites a subensemble, the homogeneous fluorescence of which is recorded.10 In nonphotochemical HB spectroscopy,9,11,12 a conformational transition of the protein is induced by selective optical excitation (burning) of the pigments. The conformational transition of the protein, in turn, leads to a change in optical transition energy of the pigments. In the HB spectrum (which is the postburn absorption spectrum minus the preburn absorption spectrum), a hole appears at the initial absorption frequency of the pigments and a positive contribution (termed antihole) is visible at the spectral position where the initially excited pigments absorb after their frequency was shifted by the conformational transition of the protein. HB spectroscopy allows one to obtain information on both the homogeneous line shape of pigment–protein complexes (PPCs) and spectral diffusion processes of the pigment transition energies due to the optically induced conformational transitions of the protein. Line narrowing spectroscopy is usually performed at cryogenic temperatures, where the homogeneous broadening is small. Therefore, the line shape contains more details than at higher temperatures. Since the parameters of the Hamiltonian of PPCs (site energies, excitonic coupling, spectral densities) in good approximation are temperature-independent, the temperature dependence of optical spectra can be well described by the line shape theory discussed below. In this way, it is possible to characterize a PPC by low-temperature spectroscopy and use the parameters to describe the biological function at physiological temperatures.
It has been a challenge to describe HB spectra of excitonically coupled pigments in proteins. The reason is 2-fold: on the one hand, a simple theory for homogeneous line shapes of multipigment complexes was missing, and on the other hand, it was not clear how the photoproduct can be described. For a long time, the standard theory of an electronic two-level system coupling to an infinite number of harmonic oscillators, developed originally by Lax13 and independently by Kubo and Toyozawa14 half a century ago, has been applied to study the signature of the lowest exciton state in the hole burning spectra of various PPCs.9,15,16 Often, quantitative agreement with experimental data could be obtained. The underlying assumption that the lowest exciton state can be treated as an effective two level system of displaced free energy surfaces got support from a recent normal-mode analysis (NMA) of the spectral density of the exciton–vibrational coupling of a PPC (the FMO protein).17 The diagonal elements of the exciton–vibrational coupling were found to be significantly larger than the off-diagonal elements. Neglecting the latter effectively results in the Kubo–Toyozawa–Lax (KTL) theory.13,14 Combining an exact treatment of the diagonal elements with a Markov and secular treatment of the off-diagonal elements, as suggested by Renger and Marcus (RM),18 yields a multipigment line shape expression that includes both vibrational sidebands of exciton transitions and lifetime broadening of the transitions due to exciton relaxation processes. Whereas KTL theory can treat the lowest exciton transition, RM theory describes the whole spectrum. Early successes of RM theory concern the description of FLN spectra of dimeric B820 complexes, using the spectral density extracted before on the monomeric subunit (the B777 complex), for which KTL theory applies, and the structure prediction of chlorophyll dimers in the water-soluble protein complex (WSCP),19 which will be discussed in more detail below. We note that, in a recent extension of RM theory, the nonsecular non-Markov contributions from the off-diagonal elements of the exciton-vibrational coupling were indeed found to be small.20
Recently, Reppert21 applied RM theory to the analysis of HB spectra of excitonically coupled systems and reported interesting results on model dimers. When burned into the low-energy exciton state, the dimers show a sharp hole at the burn frequency and, in addition, a lifetime-broadened sine function-shaped feature at the frequency of the upper exciton state. The latter feature, which cannot be obtained with KTL theory, reflects the fact that when a pigment changes its site energy, both exciton states of the dimer change their energy (the upper exciton state shifting on average to larger energies) and the zero-phonon transition of the upper exciton state is strongly homogeneously broadened by its finite lifetime. The study by Reppert21 paved the way for a quantitative understanding of HB spectra of excitonically coupled systems and has stimulated the present work.
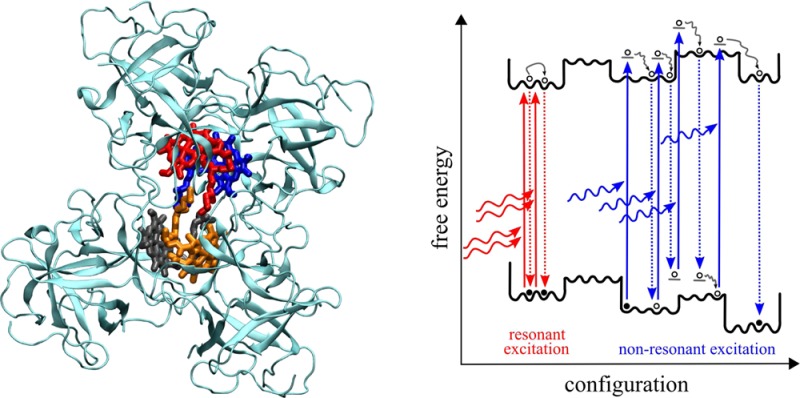
Besides the appropriate homogeneous line shape theory, a second problem in the description of HB spectra concerns the spectrum of the photoproducts, as mentioned above. In the case of nonphotochemical HB, a photoproduct is a complex in which one of the pigments (let us say pigment m) has changed its local transition energy (site energy). We will denote the respective absorption spectrum of the PPC as αm(ω). A crucial question in this respect is which new site energy Em shall be assigned? Does the pigment “remember” its original site energy Em′ or does it lose all its memory in the HB transition? This question is directly related to the free energy landscape of the protein in the excited state of the PPC. Reppert21 took an intriguing simple approximation and assumed that the pigment will lose the memory about its initial state completely and the protein can reach any of its preburn conformational substates with distribution P(Em – E̅m; σ) that is centered around the mean site energy E̅m of this pigment, with inhomogeneous width σ. Such conformational cycling most likely involves multiple pigment excitations and de-excitations, as illustrated in Figure 1. As will be shown in the present work, this approximation is valid only if during the electronic excitation (burning) some excess energy is deposited in the system, either by exciton relaxation between the upper and lower exciton state, after excitation of the former, or by vibrational relaxation, after excitation of the vibrational sideband of the lower exciton state. However, for so-called resonant excitation, that is excitation (burning) of the zero-phonon transition of the lowest exciton state, any roughness of the free energy surface will provide barriers that can only be tunneled through or overcome slowly by thermal fluctuations. Therefore, it is likely that the pigment will keep memory of its original (preburn) site energy and the protein cannot cycle through its whole conformational substates. Consequently, the distribution function P(Em – Em; σres) of the postburn transition energy Em is centered around the preburn site energy Em′ and is expected to be much narrower than the original site energy distribution function P(Em – E̅m; σ), that is, it holds that σres ≪ σ (as illustrated in Figure 1).
Figure 1.

(left) Illustration of free energy surfaces of ground state |g⟩ and exciton states |M⟩ and of conformational transitions induced by multiple excitation/de-excitation processes. The optical transitions to the vibrational ground state of the lowest exciton state (resonant excitation) are shown in red; the transitions to higher excited states (nonresonant excitation) are shown in blue. (right) Probability distributions for the postburn site energy of pigment m corresponding to the different excitation conditions in the left part (same color code). Note that the distributions are not normalized due to illustrative purposes.
A suitable model system to test new theories is WSCP.22,23 HB spectra of recombinant class IIa WSCP from cauliflower that was reconstituted with either chlorophyll a (Chla) or Chlb were reported by Pieper et al.24 The linear optical spectra of this complex were used earlier by Krausz and co-workers25 to infer an open sandwich geometry of Chl dimers, with an opening angle of 60°. Later, we refined this angle to 24° for Chla homodimers and 35° for Chlb homodimers by taking into account the homogeneous line shape functions of exciton transitions, using RM theory.19 In parallel, a crystal structure of the related class IIb WSCP complex from Lepidium virginicum was published26 that contains four Chla pigments, which are indeed arranged in two open-sandwich dimers with an opening angle of 30° between transition dipole moments. Recent 2D electronic spectra were measured on class IIb WSCP from L. virginicum and revealed an excited state lifetime of 50 fs27 of the upper exciton state, in good agreement with earlier predictions for class IIa WSCP from Redfield and modified Redfield theory.19 Besides structure prediction19,25 and the development of theory,20 WSCP has been an important model system for the study of intersystem crossing in Chla and Chlb.28 It has also been used for a theoretical demonstration of the capability of nonlinear polarization spectroscopy in the frequency domain to reveal the homogeneous broadening and thereby the lifetime of the upper exciton state.29 In the present work, we show that this lifetime is also accessible from HB spectra for resonant excitation of the upper exciton state.
Theory and Computational Methods
Linear Optical Spectra
In the following, a short survey of the theory of optical spectra is given. For a detailed discussion, we refer to refs (3, 18, 30, and 31). The theory is based on a standard Hamiltonian Hppc for the pigment–protein complex that describes the pigments as coupled two-level systems interacting with vibrational degrees of freedom of the pigments and the protein.3 It is composed of three parts, Hppc = Hex + Hex–vib + Hvib. The exciton part Hex includes the site energies Em of the pigments, defined as the optical transition energies at the equilibrium position of nuclei in the electronic ground state, and the excitation energy transfer couplings Vmn. The exciton–vibrational part Hex–vib describes the modulation of site energies and excitonic couplings by the vibrations. In the spirit of a NMA,17 it is assumed that the site energies and excitonic couplings depend linearly on the displacements of the vibrational coordinates from their equilibrium values. The vibrational part Hvib describes uncoupled harmonic oscillators.
For the calculation of optical spectra, the Hamiltonian of the PPC is transformed to the basis of delocalized exciton states |M⟩ which are given as linear combinations of local excited states |m⟩.
| 1 |
The exciton coefficients cm(M) and
excitation energies  , are
obtained from the solution of the
eigenvalue problem
, are
obtained from the solution of the
eigenvalue problem  of the exciton Hamiltonian Hex. The
absolute square of the exciton coefficient cm describes the probability
that the mth pigment is excited when the PPC is in
the Mth exciton state. The exciton–vibrational
Hamiltonian Hex–vib contains diagonal
elements, which lead to vibrational sidebands and off-diagonal elements,
which cause lifetime broadening of the optical lines.18
of the exciton Hamiltonian Hex. The
absolute square of the exciton coefficient cm describes the probability
that the mth pigment is excited when the PPC is in
the Mth exciton state. The exciton–vibrational
Hamiltonian Hex–vib contains diagonal
elements, which lead to vibrational sidebands and off-diagonal elements,
which cause lifetime broadening of the optical lines.18
Homogeneous Absorption Spectra
The linear absorption
| 2 |
is obtained from the dipole–dipole correlation function, as described in ref (18). The exciton transition dipole moment μ0M is given as a linear combination of local transition dipole moments d0m of the pigments μ0M = ∑mcm(M)d0m. The line shape function DM(ω) was derived in ref (18) by using a non-Markovian partial ordering prescription (POP) theory and can be expressed as DM(ω) = DM(ω) + DMvib(ω) with the so-called zero-phonon line (ZPL) DM(ω) that describes the excitation of electronic degrees of freedom only
| 3 |
and the vibrational sideband DMvib(ω) that contains the vibronic transitions, that is a simultaneous excitation of electronic and vibrational degrees of freedom
| 4 |
The time-dependent function GM(t) describes the vibrational sideband of the exciton transition and is related to the spectral density of the exciton–vibrational coupling Jmnkl(ω) by
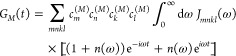 |
5 |
where n(ω) = 1/(eℏω/(kT) – 1) is the Bose–Einstein distribution function of vibrational quanta, which gives the mean number of vibrational quanta with energy ℏω excited at a given temperature T and contains Boltzmann’s constant k.
The inverse dephasing time constant τM–1 is obtained from the Redfield rate constants kM→N of exciton relaxation between exciton state |M⟩ and the other exciton states |N⟩ and contains also an empirical inverse pure dephasing time constant τpd–1
| 6 |
The Redfield rate constant kM→N is given by
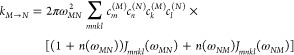 |
7 |
with the transition frequency ωMN = ωM – ωN between the Mth and the Nth exciton state. We note that τpd in eq 6 in principle can be obtained by taking into account a quadratic dependence of transition energies on the vibrational coordinates and is responsible for the finite width of the ZPL of the lowest exciton state at low temperature. Here, τpd is treated as a free parameter that is obtained from a fit of the HB spectra.
The frequency ω̃M in eqs 3 and 4 is the transition frequency between the ground state |0⟩ and the exciton state |M⟩ that contains a renormalization due to the diagonal and off-diagonal parts of the exciton–vibrational coupling32
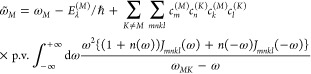 |
8 |
where Eλ(M) is the reorganization energy of the Mth exciton state defined as
| 9 |
and p.v. denotes the principal part of the integral. Note that it holds that Jmnkl(ω) = 0 for ω < 0. A recent NMA of the spectral density of a pigment–protein complex has shown that the fluctuations in excitonic couplings are negligible and the correlation in site energy fluctuations has practically no influence on exciton relaxation.17 Therefore, the spectral density is approximated as Jmnkl(ω) = δmnδklδmkJ(ω) where we use a function J(ω) that was extracted from FLN spectra of B777 complexes as18
| 10 |
and compare our results also with those obtained from an alternative J(ω) from the literature.33 The Huang–Rhys factor S equals the integral over the spectral density S = ∫0∞ dω J(ω). Whereas the functional form of J(ω) is very similar for different pigment–protein complexes, S differs somewhat and needs to be determined, for example, from the temperature dependence of the linear absorption (see below).
Inhomogeneous Absorption Spectra
As discussed in the Introduction, protein dynamics occur on many different time scales and lead to fluctuations in excitonic couplings and site energies. The fluctuations, which are fast compared with excited state lifetimes, lead to homogeneous broadening of optical line shapes, as described above. The slow fluctuations cause static disorder, that is, every complex in an ensemble will exhibit a different exciton Hamiltonian. It seems reasonable to assume that the order of magnitude difference between fluctuations of site energies and excitonic couplings found for the dynamic disorder17 also holds for static disorder. Therefore, we only include variations in site energies.
In order to describe the absorption spectra measured on an inhomogeneous ensemble, the homogeneous absorbance is averaged over different realizations of static disorder of local transition frequencies ωi of the pigments:
| 11 |
where N is the number of pigments and the distribution function P is assumed to be a Gaussian function, which for simplicity is assumed to be the same for all pigments,
| 12 |
with a full width at half-maximum  . The distribution functions are
centered
around the mean local transition frequencies ω̅i of the pigments that depend on their local binding
site in the protein. The corresponding energies E̅i = ℏω̅i are termed (mean) site energies.
. The distribution functions are
centered
around the mean local transition frequencies ω̅i of the pigments that depend on their local binding
site in the protein. The corresponding energies E̅i = ℏω̅i are termed (mean) site energies.
We note that the assumption of independent Gaussian disorder in site energies, although it is common practice in the field, has not been proven yet by a microscopic theory. From electrostatic calculations of site energy shifts in pigment–protein complexes, it is known that the site energies depend on interactions with a large number of amino acid residues of the protein.34 If the local conformations of the side chains of the latter are independent, we expect, in the spirit of the central limit theorem of statistical mechanics, Gaussian distributions of the site energies. There is indeed support for this assumption from ZPL hole depth measurements (also termed zero phonon action spectroscopy) of localized lowest excited states in pigment–protein complexes.9,35
Hole-Burning Spectra
In HB spectroscopy, the inhomogeneous ensemble of PPCs is excited with an energetically narrow laser. The spectral width of the burning laser is negligible small compared with the width of the ZPL; hence we assume monochromatic excitation with frequency ωexc. Since the complexes in the sample are inhomogeneously broadened, a certain selection of excited complexes can be achieved by this excitation. In nonphotochemical HB, the protein changes conformation when the pigments are excited. Due to this conformational transition, after the PPC has returned to its ground state, the transition energies of the pigments and thereby the absorption spectrum of the complex have changed. In general, the probability of a conformational transition is low, which means the complex has to be excited many times until a measurable change in the absorbance occurs. We will denote the postburn absorption spectrum of a complex as αm(ω), where pigment m has changed its transition energy. After optical excitation, the excitons relax quickly. At very low temperatures, only the lowest exciton state is populated after the relaxation and the conformational transitions of the local protein environments of the pigments start from there. The probability to find pigment m excited in the lowest exciton state is given by the respective square of the exciton coefficient |cm(1)|2. For simplicity, we assume that the intrinsic HB efficiency of all local protein environments of the pigments is the same. Therefore, the postburn absorbance is proportional to ∑mαm(ω)|cm|2. Please note that the HB efficiency is sufficiently low that at most one pigment changes its site energy per excitation by the burn laser. The final HB spectrum is an accumulation of many such events. Note that the factor |cm(1)|2 takes into account a reduction of the local reorganization of the protein environment due to delocalization of excited states. That is, a delocalized lowest exciton state will exhibit a lower HB efficiency at a given site than a lowest exciton state that is localized at that site.
In order to calculate αm(ω), we have to assign a new site energy to pigment m. The simplest approximation, used also by Reppert,21 is to assume that after the HB transition, the protein can end up in any of the conformational substates that are present in the original inhomogeneous ensemble. In this case, the HB signal, that is, the difference between the absorbance after burning and the original absorbance of the sample, reads
| 13 |
where α(ωexc) is the homogeneous absorbance at the excitation (burning) frequency and ⟨...⟩dis denotes an average over static disorder in site energies that will be performed numerically by using a Monte Carlo method, as usual. Although no explicit expression was given by Reppert, in essence eq 13 describes his approach. In the approach by Reppert, a Monte Carlo procedure is used not just for the disorder average but also to describe every step in the HB experiment. Therefore, many events that do not contribute to the actual HB spectrum had to be included, whereas in eq 13 only the relevant events are considered. We will see below that eq 13 holds well for excitation energies that are larger than the zero-phonon transition energy of the lowest exciton transition, that is, for so-called nonresonant (nr) burning conditions, but it cannot describe resonant HB spectra.
In the latter case, the energy of the burn laser is resonant to the zero-phonon transition of the lowest exciton state, and there is no excess energy available that can be used for the conformational transition of the protein. Therefore, the jumps in the optical transition energy of the pigments are smaller. To take into account this circumstance, we describe the HB spectrum including resonant and nonresonant burning conditions as
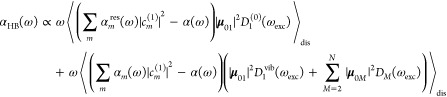 |
14 |
where αmres(ω) denotes the homogeneous absorption spectrum of a complex that was excited (burned) resonantly into the zero-phonon transition of its lowest exciton state, described by D1(ωexc), given in eq 3. In this case, the postburn transition frequency ωm is not taken from the original distribution function P(ωm – ω̅m; σ) but instead from a distribution function P(ωm – ωm′; σres) that is centered around the preburn site energy ℏωm of pigment m (see Figure 1). In addition, we assign a smaller width σres to this distribution function, to take into account the reduced conformational flexibility, as discussed above. The second part of eq 14 takes into account nonresonant burning processes, that is excitation of the remaining exciton states M = 2, ..., N at higher energies, described by DM(ωexc), and excitation of the vibrational sideband of the lowest exciton state M = 1, described by D1vib(ωexc). In these cases, we assume that there is enough excess energy available after excitation, either by exciton relaxation or by vibrational excitation, that all conformational substates of the protein can be reached and, therefore, the preburn distribution function P(ωm – ω̅m; σ) of the transition energy of pigment m applies also to the postburn site energy. We note that for nonresonant excitation conditions practically only the second part of eq 14 contributes to the HB signal, which then becomes identical to the simple expression in eq 13, describing the nonresonant HB signal.
Structure
A crystal structure exists for the class IIb WSCP complex of L. virginicum containing Chla,26 as discussed in the Introduction. The four chlorophylls are arranged in two open sandwich dimers with strong intradimer and weak interdimer excitonic couplings. As shown in recent publications,20,36 the same pigment geometry can be assumed for class IIa Chla–WSCP from cauliflower. In case of Chlb–WSCP, an increase in opening angle between transition dipole moments of strongly coupled Chls by 9° was suggested as compared with Chla–WSCP, based on simulations of optical spectra at a temperature of 77 K.20 In the present work, we take the pigment geometry for Chla–WSCP from the crystal structure of L. virginicum and reinvestigate the change in opening angle between transition dipole moments for Chlb–WSCP, by including 4 K absorbance data.
Refinement of Parameters from Fit of Linear Optical Spectra
The parameters of the present model, determined as described below, are summarized in Table 1 and are compared there to those used in our earlier work.36 In the present work, the excitonic couplings were inferred directly from the splitting between the peaks, seen in absorbance and circular dichroism spectra. In the case of Chla, we arrive at a value of 83 cm–1, which is very close to the value 84 cm–1, obtained before. In case of Chlb, we find that the earlier value of 72 cm–1 should be somewhat increased to 82 cm–1 for a better fit of low-temperature spectra. The integral exciton–vibrational coupling strength, that is, the Huang–Rhys factor S = 0.8, has been determined earlier from the temperature dependence of the absorption spectrum, in agreement with the present calculations shown in Figure S1 of the Supporting Information. The inhomogeneous width Δinh for the distribution function of site energies, as well as the mean site energy ℏω̅ has been determined from the fit of low temperature absorbance spectra in Figure 2. Please note that the values of σ = 64 and 66 cm–1 correspond to Δinh = 150 and 155 cm–1 (fwhm), respectively. The values are close to those determined earlier.36 Concerning the angle β between transition dipole moments, a value of β = 30° results from the crystal structure, assuming the transition dipole moments to be oriented along the NB–ND axis of the Chls. As discussed already recently,20 the Chlb–WSCP spectra can be better described by increasing the opening angle between the transition dipole moments. A value of 39° was suggested in ref (20). Here we arrive at an optimal value of β = 36°, as shown in the lower part of Figure 2. Besides the parameters determined from the linear spectra discussed above, there are two additional adjustable parameters, namely, the width σres of the distribution function P(Em – Em′; σres) of the photoproduct for resonant excitation of the ZPL of the lowest exciton states and the pure dephasing time constant τpd. These parameter are inferred from comparison with experimental HB data (see below).
Table 1. Parameters Used for the Calculation of Spectra.
Figure 2.
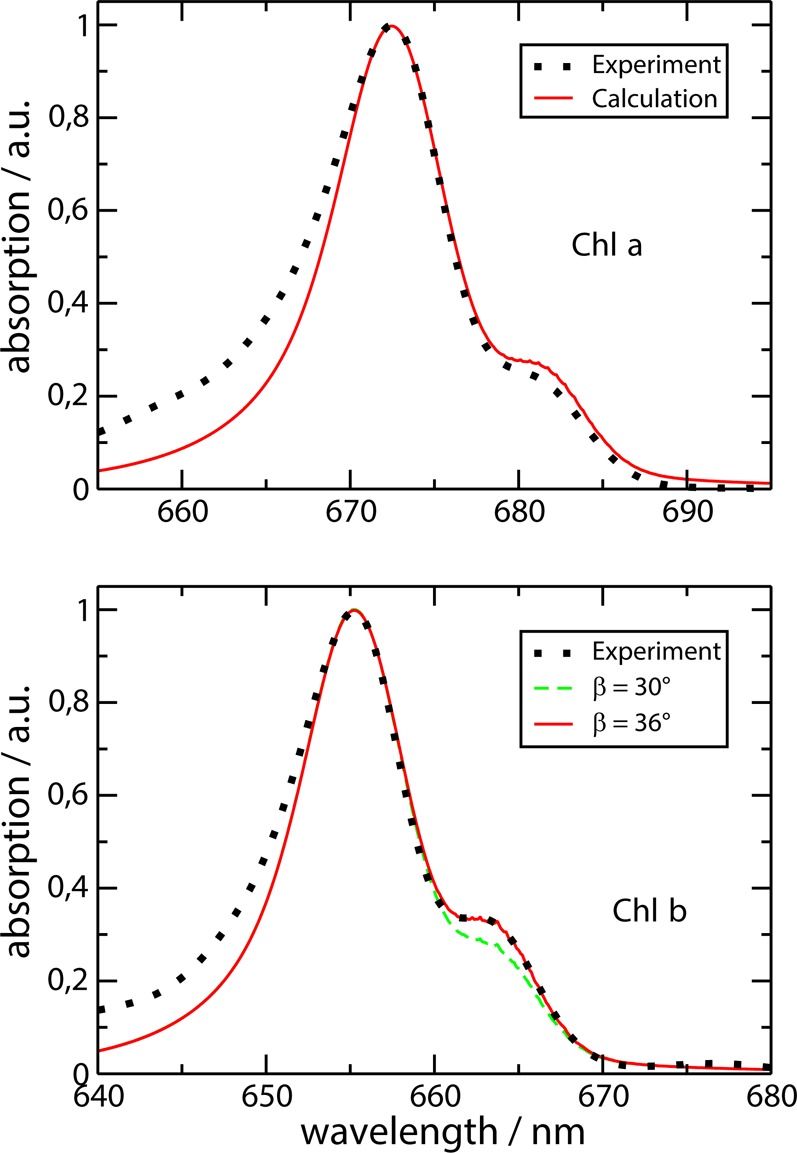
Low temperature linear absorption (T = 4 K) of Chla–WSCP (upper part) and Chlb–WSCP (lower part). The dots show the experimental data from Pieper et al.;24 lines show the calculations using the parameters given in Table 1. In the lower part, in addition, a calculation is shown in which the opening angle β = 30° between transition dipole moments from the crystal structure of class IIb WSCP (containing Chla) was applied, assuming that the latter are oriented along the NB−ND axis of Chls.
Results
Hole-Burning Spectra
HB spectra at 4 K were calculated for two different burn conditions, exciting either the low- or the high-energy exciton state. In the calculation of the disorder average, 106 random configurations of site energies have been taken into account. The calculated spectra for Chlb–WSCP are compared in Figure 3 with the experimental data. For excitation of the low-energy exciton state (λburn = 664.9 nm, upper part of Figure 3), a sharp hole results at the burn wavelength that is accompanied by two sharp positive features at both sides of the sharp bleach. From the width of the sharp hole, a pure dephasing time τpd = 2750 fs is inferred. Toward longer wavelengths, a sideband, the so-called pseudo-phonon sideband (PPSB), appears as a negative bleach around 666 nm. At shorter wavelengths, where the upper exciton state absorbs, a broad sine-shaped feature results with a bleaching around 659 nm and positive absorbance around 653 nm. The overall agreement between calculations and experimental data is excellent if eq 14 is used. Using eq 13 instead gives only qualitative agreement for the short wavelength part of the spectrum but misses completely the PPSB at long wavelengths. Close inspection of the PPSB reveals that it is more prominent in the experiment than in the calculations. So far, all our attempts to obtain a better agreement by varying the shape of the spectral density have failed. For example, we have tested a J(ω) that was extracted by Pieper et al.33 from experimental delta-FLN spectra of WSCP,33 using standard KTL theory, as discussed in detail in the Supporting Information.
Figure 3.
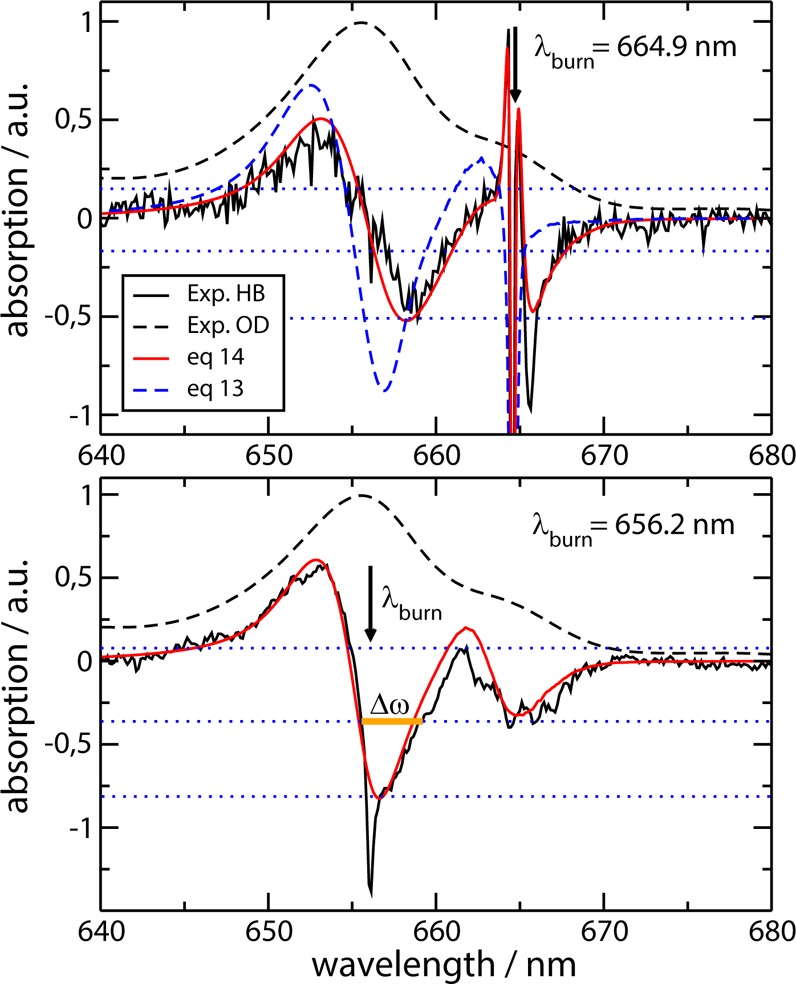
Low temperature (T = 4 K) linear absorption (OD) and hole-burning (HB) spectra of Chlb–WSCP. Black dashed and solid lines show experimental absorption and HB data, respectively, from Pieper et al.,24 red solid lines show the calculations using eq 14, and blue dashed lines show the calculation using eq 13, which corresponds to the approach by Reppert.21 In the lower part, the blue dashed line coincides with the red line. The Δω in the lower part denotes the fwhm of the high-energy bleaching, which is used in the main text to obtain an upper bound to the lifetime of the upper exciton state. The parameters used for the calculations are given in Table 1. The arrows indicate the burn wavelength.
If the upper exciton state is excited by the burn laser (lower part of Figure 3), there is a broad bleaching around the burn wavelength and positive absorbance at shorter wavelength (as for low-energy burning). In addition, another broad bleaching appears at longer wavelength around 665 nm, where the low-energy exciton state absorbs. No sharp feature is obtained, in contrast to the HB spectrum resulting for low-energy excitation (burning) shown in the upper part of Figure 3. The calculations are again in excellent agreement with the experimental data. The only experimental feature that is not obtained in the calculations is a small dip at the burn wavelength. Since for the high-energy burning frequency the ZPL of the low-energy exciton state is not excited, both eqs 13 and 14 give identical results. For Chla–WSCP, HB spectra at low-energy burning conditions (λexc = 682.0 nm) are compared in Figure 4 with the experimental data. The HB spectrum of Chla–WSCP has a similar shape as the Chlb–WSCP spectrum but is shifted toward longer wavelengths, due to the difference in site energies ℏω̅ between Chla and Chlb. The overall agreement between calculations and experimental data is good, but not as excellent as for Chlb–WSCP. We have no explanation for the larger discrepancy, at the moment.
Figure 4.
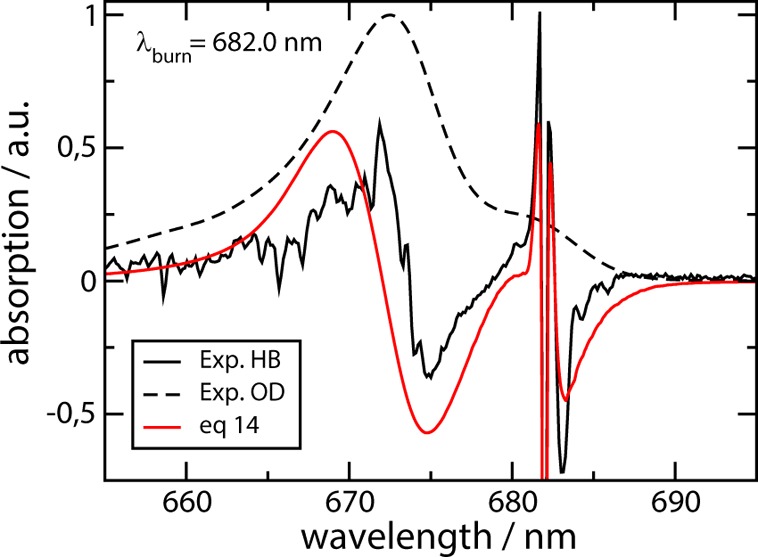
Low temperature (T = 4 K) linear absorption (OD) and hole-burning (HB) spectra of Chla–WSCP. Black dashed and solid lines show experimental absorption and HB data, respectively, from Pieper et al.;24 red line shows the calculation using the parameters given in Table 1.
Discussion
So far, it has not been possible to describe HB spectra of excitonically coupled systems over a spectral range that is larger than that of the lowest exciton state. Here we present a theory that changes this situation. Besides applying a homogeneous line shape theory for PPCs, containing vibrational sidebands and lifetime broadening due to exciton relaxation, developed18 and tested19,20 earlier, it was important to relate the amount of excess energy provided by the burn laser to the magnitude of the conformational transition of the protein. We find that excitation of the electronic degrees of freedom of the lowest exciton state only, that is, burning into the zero-phonon transition of this state, does allow the protein only to reach conformational substates in the close neighborhood of its original conformation. In striking contrast, any higher excitation gives the protein the freedom to cycle through its free energy landscape and reach any conformational substate present in the original inhomogeneous ensemble. Please note that even excitation of the vibrational sideband of the lowest exciton transition, which has a maximum near 25 cm–1, provides enough excess energy. This result may be surprising at first glance, since at least some of the free energy barriers are most likely larger than this value. However, as illustrated in Figure 1, in a hole-burning experiment, one can make use of multiple excitation and de-excitation reactions of the chromophores that will ultimately drive the protein through its conformational substates. From our phenomenological modeling of the hole-burning spectra, we have to conclude that in the case of resonant excitation of the ZPL of the lowest exciton state, the missing excess energy hampers the initial phase of the conformational cycle such that only conformational substates in the neighborhood of the preburn substate are available. It should be noted also that for such resonant excitation the excited state population may be partially quenched by stimulated emission induced by subsequent burn photons, since there is no fast relaxation in the excited state that could bring the system out of resonance with respect to the burn laser.
In order to point out the influence of these effects on the calculated HB spectrum, the latter is decomposed as αHB(ω) = α+(ω) – α–(ω), where α+(ω) contains all the terms with positive sign in eqs 13 or 14 and α–(ω) contains those with negative sign, see also the Supporting Information for a definition of α+(ω) and α–(ω). In essence, α+(ω) is the absorbance of the photoproduct and α–(ω) is the preburn absorbance, both weighted by the absorbance α(ωexc) at the burn frequency ωexc. As explained before, eq 13 assumes that the protein can end up in any of its original conformational substates, that is, the pigments “forget” their initial site energies. Therefore, as seen in the middle part of Figure 5, in the postburn spectrum α+(ω), the sharp peak at the burn frequency has completely vanished and no PPSB results in the difference spectra α+(ω) – α–(ω). In contrast, taking into account the limitation in conformational motion that occurs if the purely electronic zero-phonon transition of the lowest exciton state is excited, let the pigments “remember” their original site energies and diminished and slightly broadened the sharp peak at the burn frequency and also the low-energy shoulder. The latter contains ZPLs of those complexes that were burned into their vibrational sideband. The difference α+(ω) – α–(ω) in this case reveals the PPSB in nice agreement with the experimental data (Figures 3 and 4). Please note also that on average the high-energy part of the postburn spectrum α+(ω) is shifted to the left of the preburn spectrum α–(ω), explaining the sine function shape in the difference.
Figure 5.
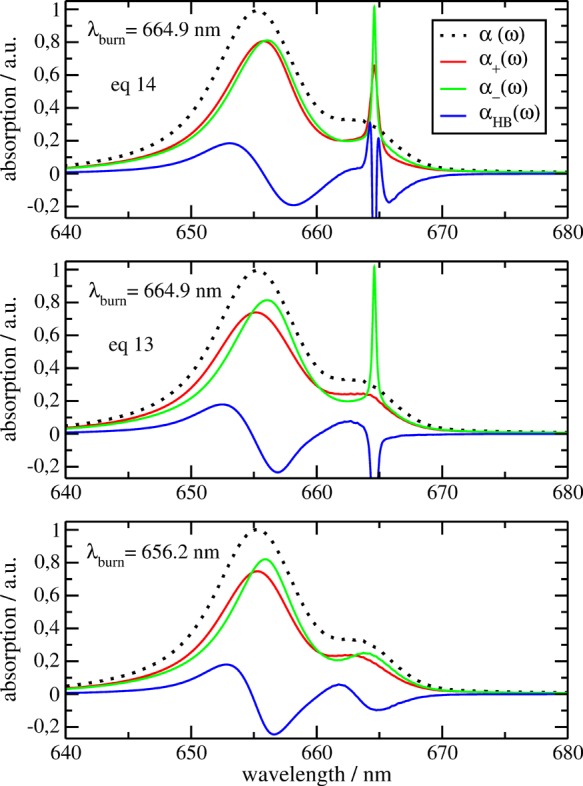
Calculated absorption spectrum (black dotted curve), as well as the calculated positive (α+(ω), red curve) and negative (α–(ω), green curve) contributions to the hole burning spectrum αHB(ω) = α+(ω) – α–(ω) (blue curve) are shown, assuming resonant burning conditions in the upper and middle parts and nonresonant burning conditions in the lower part. The HB spectra in the upper part were calculated with eq 14, in the middle part eq 13 (corresponding to Reppert’s theory) was used, and in the lower part eqs 13 and 14 yield identical results.
Since the upper exciton state is strongly lifetime-broadened, many different complexes in the inhomogeneous ensemble absorb at the burn wavelength of 656.2 nm (lower part of Figure 5), and the low-energy exciton state, therefore, keeps a large part of its inhomogeneous broadening in the HB spectrum. However, the width of the high energy bleaching reflects the homogeneous broadening of the upper exciton state and may be used to infer the lifetime of this state. From eq 3, it follows that the full width at half-maximum (fwhm) Δω of this curve equals 2τM–1. Taking into account that the lifetime equals the inverse rate constant 1/k2→1, we obtain from eq 6 (neglecting the small τpd–1) a lifetime of the upper exciton state as 1/Δω. The Δω = 80 cm–1 that can be extracted from Figure 3 results in a lifetime of 65 fs, in good agreement with the 50 fs lifetime estimated from recent 2D spectra.27 As seen in the lower part of Figure 5, the actual homogeneous width of the pre- and postburn spectra are somewhat larger than that of the HB spectra because in the latter we have partial cancellation due to the difference. Therefore, the lifetime obtained from the experimental Δω in HB should be considered as an upper bound.
From an average over the inverse rate constant 1/k2→1, we obtain the average theoretical lifetime of 75 ± 30 fs in agreement with the above values. The relatively large standard deviation of 30 fs of the theoretical average reflects the fact that the exciton states in the wings of the distribution function are more localized than in the center and, therefore, live longer. Since in the experiment the burn laser was resonant with the maximum of the distribution function of the high-energy exciton state, the short-lived exciton states were selected.
Although there is almost quantitative agreement between calculated and measured HB spectra, in particular for Chlb–WSCP (Figure 3), we still need to understand the origin of the more pronounced PPSB observed for excitation of the low-energy exciton state and the origin of the additional sharp feature at the burn frequency for high-energy excitation. Whereas the former feature could be due to a more complicated postburn spectrum than assumed here, the origin of the latter could be twofold. On the one hand, the Markov approximation applied to the off-diagonal elements of the exciton–vibrational coupling in the line shape theory might be too simple. The τM determining the width of the zero-phonon transition in eq 3 becomes frequency dependent if non-Markov effects in the nondiagonal elements of the exciton–vibrational coupling are taken into account,32 which could explain a more complicated line shape than a simple Lorentzian. Please note, however, that the non-Markovian treatment of the off-diagonal elements in the exciton–vibrational coupling in ref (32) allowed only for a perturbative description of the diagonal part of the exciton–vibrational coupling and therefore does not describe the vibrational sidebands accurately enough. Therefore, a more advanced theory37−39 would be needed. On the other hand, high-frequency intramolecular vibronic transitions of the pigments, neglected so far, might be responsible for the sharp dip in the experiment. As seen in the linear absorbance (Figure 2), there are deviations between the calculated and measured spectra at high energies (short wavelengths). Those deviations could be due to intramolecular vibrational degrees of freedom of the pigments, which have not been taken into account in the calculations. Since the deviations are not observed in the CD spectra,19,36 it is likely that these intramolecular vibronic transitions do not mix strongly with the exciton transitions and, therefore, could exhibit a larger lifetime and hence a smaller line width in the HB spectra. HB experiments detecting the change in circular dichroism might be helpful to distinguish excitonic from nonexcitonic contributions to the homogeneous line shape. Inspiration may be taken also from ab initio multimode vibronic coupling theories on molecular dimers.40 We note that an improved line shape theory can readily be inserted into eq 14 and the HB spectrum obtained, as long as it is possible to separate the expression for the ZPL from that of the vibrational sideband.
Summary and Conclusions
The main result of the present paper is eq 14, which is found to describe experimental HB data of excitonically coupled pigment–protein complexes quantitatively for all burning conditions. For nonresonant burning, this equation becomes identical to eq 13, which summarizes a Monte Carlo scheme used by Reppert21 before to investigate model systems but is numerically more efficient than Reppert’s scheme. The latter is found to fail in the case of resonant burning conditions.
The key idea of the present paper, which allows us to describe also resonant burning, is to relate the change in site energy during the HB transition to the excess energy deposited by the burn laser in the protein. The simplest possible assumption is to distinguish burning with and without excess energy. The latter applies if the zero-phonon transition of the lowest exciton state is excited, and the former includes any excitation with higher energy. Interestingly, this simple approximation allows for a good quantitative description of experimental HB spectra of WSCP.
Obviously, in the electronic excited state of the complex, intermolecular vibrational excitations with energies in the 10 cm–1 range are enough to initiate subsequent conformational transitions that are driven by multiple excitation and de-excitation reactions of the pigments in the hole-burning process. In the course of these conformational transitions, all conformational substates are reached contributing to the inhomogeneous distribution function of the site energies in the electronic ground state of the complex. An interesting question for future work is to provide a microscopic picture of the inhomogeneous distribution function of the site energies in a pigment–protein complex and to identify the relevant conformational substates of the protein, as well as the mechanisms that drive these transitions. So far, methods have been developed to calculate site energies for a given structure including also fluctuations due to vibrational motion of the protein that are fast compared with the lifetime of excited pigment states (for a recent review, see ref (3)). The next step will be to include slow conformational motion of the protein, like reorientation of polar side chains or fluctuations in the protonation pattern of titratable residues. Under resonant burning conditions, there is no excess energy available to drive the conformational motion and only the conformational substates in the neighborhood of the preburn state are available. In principle, these states could be reached either by thermal fluctuations or by tunneling. In order to distinguish between these two processes, lowering the temperature even further than 4 K, used in the present HB experiments, toward the millikelvin range would be helpful. If tunneling is the major process, the width σres of the postburn site energy distribution function should be temperature-independent, whereas in the case of thermal activation σres should become smaller with decreasing temperature. In the latter case, it might be possible to determine the barrier heights of the free energy landscape of the protein in the excited state. Pioneering work in this direction has been published by Wiersma, Friedrich and co-workers,41 who investigated the free energy landscape of myoglobin by temperature-dependent hole-burning and photon echo spectroscopy and were able to infer details of the free energy landscape. The present work provides the theory to interpret similar experiments on multipigment–protein complexes.
Acknowledgments
We dedicate this work to Rudolph A. Marcus for his 92nd birthday, who helped to create the multipigment line shape theory applied here. We thank Jörg Pieper for sharing the original experimental data with us. Financial support by the Austrian Science Fund (FWF), Grant P24774-N27, is gratefully acknowledged.
Supporting Information Available
The Supporting Information is available free of charge on the ACS Publications website at DOI: 10.1021/jacs.5b08246.
Determination of Huang–Rhys factor from temperature dependence of absorbance, discussion of alternative spectral density, definition of α+(ω) and α–(ω) (PDF)
The authors declare no competing financial interest.
Supplementary Material
References
- Renger T. In Primary Processes of Photosynthesis, Part 1: Principles and Apparatus; Renger G., Ed.; RSC Publishing: Cambridge, U.K., 2008; Chapter 2, pp 39–97. [Google Scholar]
- Noji H.; Yasuda R.; Yoshida M.; Kinosita K. J. Nature 1997, 386, 299–302. 10.1038/386299a0. [DOI] [PubMed] [Google Scholar]
- Renger T.; Müh F. Phys. Chem. Chem. Phys. 2013, 15, 3348–3371. 10.1039/c3cp43439g. [DOI] [PubMed] [Google Scholar]
- Brecht M.; Studier H.; Radics V.; Nieder J. B.; Bittl R. J. Am. Chem. Soc. 2008, 130, 17487–17493. 10.1021/ja806216p. [DOI] [PubMed] [Google Scholar]
- Krüger T. P. J.; Ilioaia C.; Johnson M. P.; Ruban A. V.; van Grondelle R. Biochim. Biophys. Acta, Bioenerg. 2014, 1837, 1027–1038. 10.1016/j.bbabio.2014.02.014. [DOI] [PubMed] [Google Scholar]
- Kunz R.; Timpmann K.; Southall J.; Cogdell R. J.; Freiberg A.; Köhler J. Biophys. J. 2014, 106, 2008–2016. 10.1016/j.bpj.2014.03.023. [DOI] [PMC free article] [PubMed] [Google Scholar]
- Kharlamov B. M.; Bykovskaya L. A.; Personov R. I. Chem. Phys. Lett. 1977, 50, 407–411. 10.1016/0009-2614(77)80354-0. [DOI] [Google Scholar]
- Avarmaa R. A.; Rebane K. K. Spectrochim. Acta Mol. Biomol. Spectrosc. 1985, 41, 1365–1380. 10.1016/0584-8539(85)80189-6. [DOI] [Google Scholar]
- Jankowiak R.; Reppert M.; Zazubovich V.; Pieper J.; Reinot T. Chem. Rev. 2011, 111, 4546–4598. 10.1021/cr100234j. [DOI] [PubMed] [Google Scholar]
- Creemers T.; de Caro C.; Visschers R.; van Grondelle R.; Völker S. J. Phys. Chem. B 1999, 103, 9770–9776. 10.1021/jp990805x. [DOI] [Google Scholar]
- Rätsep M.; Freiberg A. Chem. Phys. Lett. 2003, 377, 371–376. 10.1016/S0009-2614(03)01193-X. [DOI] [Google Scholar]
- Purchase R.; Völker S. Photosynth. Res. 2009, 101, 245–266. 10.1007/s11120-009-9484-5. [DOI] [PMC free article] [PubMed] [Google Scholar]
- Lax M. J. Chem. Phys. 1952, 20, 1752–1760. 10.1063/1.1700283. [DOI] [Google Scholar]
- Kubo R.; Toyozawa Y. Prog. Theor. Phys. 1955, 13, 160–182. 10.1143/PTP.13.160. [DOI] [Google Scholar]
- Hayes J. M.; Gillie J. K.; Tang D.; Small G. J. Biochim. Biophys. Acta, Bioenerg. 1988, 932, 287–305. 10.1016/0005-2728(88)90166-1. [DOI] [Google Scholar]
- Jankowiak R.; Hayes J. M.; Small G. J. Chem. Rev. 1993, 93, 1471–1502. 10.1021/cr00020a005. [DOI] [Google Scholar]
- Renger T.; Klinger A.; Steinecker F.; Schmidt am Busch M.; Numata J.; Müh F. J. Phys. Chem. B 2012, 116, 14565–14580. 10.1021/jp3094935. [DOI] [PMC free article] [PubMed] [Google Scholar]
- Renger T.; Marcus R. J. Chem. Phys. 2002, 116, 9997–10019. 10.1063/1.1470200. [DOI] [Google Scholar]
- Renger T.; Trostmann I.; Theiss C.; Madjet M. E.; Richter M.; Paulsen H.; Eichler H. J.; Knorr A.; Renger G. J. Phys. Chem. B 2007, 111, 10487–10501. 10.1021/jp0717241. [DOI] [PubMed] [Google Scholar]
- Dinh T.; Renger T. J. Chem. Phys. 2015, 142, 034104. 10.1063/1.4904928. [DOI] [PubMed] [Google Scholar]
- Reppert M. J. Phys. Chem. Lett. 2011, 2, 2716–2721. 10.1021/jz2012353. [DOI] [Google Scholar]
- Satoh H.; Uchida A.; Nakayama K.; Okada M. Plant Cell Physiol. 2001, 42, 906–911. 10.1093/pcp/pce117. [DOI] [PubMed] [Google Scholar]
- Renger G.; Pieper J.; Theiss C.; Trostmann I.; Paulsen H.; Renger T.; Eichler H. J.; Schmitt F. J. J. Plant Physiol. 2011, 168, 1462–1472. 10.1016/j.jplph.2010.12.005. [DOI] [PubMed] [Google Scholar]
- Pieper J.; Rätsep M.; Trostmann I.; Schmitt F.-J.; Theiss C.; Paulsen H.; Eichler H. J.; Freiberg A.; Renger G. J. Phys. Chem. B 2011, 115, 4053–4065. 10.1021/jp111457t. [DOI] [PubMed] [Google Scholar]
- Hughes J.; Razeghifard R.; Logue M.; Oakley A.; Wydrzynski T.; Krausz E. J. Am. Chem. Soc. 2006, 128, 3649–3658. 10.1021/ja056576b. [DOI] [PubMed] [Google Scholar]
- Horigome D.; Satoh H.; Itoh N.; Mitsunaga K.; Oonishi I.; Nakagawa A.; Uchida A. J. Biol. Chem. 2007, 282, 6525–6531. 10.1074/jbc.M609458200. [DOI] [PubMed] [Google Scholar]
- Alster J.; Lokstein H.; Dostál J.; Uchida A.; Zigmantas D. J. Phys. Chem. B 2014, 118, 3524–3531. 10.1021/jp411174t. [DOI] [PubMed] [Google Scholar]
- Renger T.; Madjet M. E.; Müh F.; Trostmann I.; Schmitt F.-J.; Theiss C.; Paulsen H.; Eichler H.-J.; Knorr A.; Renger G. J. Phys. Chem. B 2009, 113, 9948–9957. 10.1021/jp901886w. [DOI] [PubMed] [Google Scholar]
- Schoth M.; Richter M.; Knorr A.; Renger T. Phys. Rev. Lett. 2012, 108, 178104. 10.1103/PhysRevLett.108.178104. [DOI] [PubMed] [Google Scholar]
- Adolphs J.; Renger T. Biophys. J. 2006, 91, 2778–2797. 10.1529/biophysj.105.079483. [DOI] [PMC free article] [PubMed] [Google Scholar]
- May V.; Kühn O.. Charge and Energy Transfer Dynamics in Molecular Systems, 3rd, revised and enlarged ed.; Wiley-VCH: Berlin, 2011. [Google Scholar]
- Renger T.; May V. Phys. Rev. Lett. 2000, 84, 5228–5231. 10.1103/PhysRevLett.84.5228. [DOI] [PubMed] [Google Scholar]
- Pieper J.; Rätsep M.; Trostmann I.; Paulsen H.; Renger G.; Freiberg A. J. Phys. Chem. B 2011, 115, 4042–4052. 10.1021/jp111455g. [DOI] [PubMed] [Google Scholar]
- Adolphs J.; Müh F.; Madjet M.; Schmidt am Busch M.; Renger T. J. Am. Chem. Soc. 2010, 132, 3331–3343. 10.1021/ja9072222. [DOI] [PubMed] [Google Scholar]
- Pieper J.; Irrgang K.-D.; Rätsep M.; Voigt J.; Renger G.; Small G. J. Photochem. Photobiol. 2000, 71, 574–581. 10.1562/0031-8655(2000)0710574AOTLQY2.0.CO2. [DOI] [PubMed] [Google Scholar]
- Renger T.; Madjet M. E.; Müh F.; Trostmann I.; Schmitt F.-J.; Theiss C.; Paulsen H.; Eichler H. J.; Knorr A.; Renger G. J. Phys. Chem. B 2009, 113, 9948–9957. 10.1021/jp901886w. [DOI] [PubMed] [Google Scholar]
- Hein B.; Kreisbeck C.; Kramer T.; Rodriguez M. New J. Phys. 2012, 14, 023018. 10.1088/1367-2630/14/2/023018. [DOI] [Google Scholar]
- Moix J. M.; Ma J.; Cao J. J. Chem. Phys. 2015, 142, 094108. 10.1063/1.4908601. [DOI] [PubMed] [Google Scholar]
- Gelzinis A.; Abramavicius D.; Valkunas L. J. Chem. Phys. 2015, 142, 154107. 10.1063/1.4918343. [DOI] [PubMed] [Google Scholar]
- Kopec S.; Ottiger P.; Leutwyler S.; Köppel H. J. Chem. Phys. 2015, 142, 084308. 10.1063/1.4913363. [DOI] [PubMed] [Google Scholar]
- Thorn Leeson D.; Wiersma D.; Fritsch K.; Friedrich J. J. Phys. Chem. B 1997, 101, 6331–6340. 10.1021/jp970908k. [DOI] [Google Scholar]
Associated Data
This section collects any data citations, data availability statements, or supplementary materials included in this article.