

Abstract
Segmentation and three-dimensional (3D) visualization of teeth in dental computerized tomography (CT) images are of dentists’ requirements for both abnormalities diagnosis and the treatments such as dental implant and orthodontic planning. On the other hand, dental CT image segmentation is a difficult process because of the specific characteristics of the tooth's structure. This paper presents a method for automatic segmentation of dental CT images. We present a multi-step method, which starts with a preprocessing phase to reduce the metal artifact using the least square support vector machine. Integral intensity profile is then applied to detect each tooth's region candidates. Finally, the mean shift algorithm is used to partition the region of each tooth, and all these segmented slices are then applied for 3D visualization of teeth. Examining the performance of our proposed approach, a set of reliable assessment metrics is utilized. We applied the segmentation method on 14 cone-beam CT datasets. Functionality analysis of the proposed method demonstrated precise segmentation results on different sample slices. Accuracy analysis of the proposed method indicates that we can increase the sensitivity, specificity, precision, and accuracy of the segmentation results by 83.24%, 98.35%, 72.77%, and 97.62% and decrease the error rate by 2.34%. The experimental results show that the proposed approach performs well on different types of CT images and has better performance than all existing approaches. Moreover, segmentation results can be more accurate by using the proposed algorithm of metal artifact reduction in the preprocessing phase.
Keywords: Computerized tomography image, mean shift, support vector machine, tooth segmentation
INTRODUCTION
In recent years, much effort has been put in developing medical imaging systems for clinical procedures. Actual interpretation of the obtained images is essential for successful achievement of the treatments. However, the human body's internal organs are naturally complex and hard to diagnose. Image segmentation is the process of partitioning a digital image into its constituent regions or objects. This process can be used to separate the complex structures within medical images, which results in better interpretation and diagnosis by physicians. In dentistry field, image segmentation is appropriate for detecting the structure and arrangement of the teeth. Hence, this process is one of the primary steps in some image-based applications such as planning and assessing the dental implant and orthodontic treatments. Among dental images, computerized tomography (CT) images are widely used for three-dimensional (3D) visualizing of teeth. However, dental CT image segmentation faces major challenges due to the specific features of the tooth's structure and some properties of this type of images; Challenges such as topological changes of tooth border, difficult common boundary finding in adjacent teeth, suspicious boundaries around the real border of teeth due to the tissues around the teeth, noisy nature of dental CT images, degradation of the image quality due to streak artifacts caused by metal objects, etc.[1] Therefore, most of the existing methods are semi-automatic and require the expert user's interaction. However, there are some fully-automatic methods attempting to do accurate segmentation of teeth in CT images.
Generally, we classify the segmentation methods into three classes:
Structural methods: These methods try to find structural characteristics of the area, which is to be segmented and use them for the segmentation process. Deformable models such as active contour and the level sets are the important techniques in this category, which are widely used in dental CT image segmentation[1,2,3,4,5]
Stochastic methods: These methods use local information of each pixel to decide whether or not the pixel belongs to the desired region. These methods do not take into account structural information. Thresholding algorithm[6] and the segmentation using Covariance/Aria measure[7] are the two methods in this category, which are used for dental CT images
Hybrid methods: Methods of this category use characteristics of both structural and stochastic methods. The combination of the region growing algorithm and active contour model[8] and the segmentation using statistical shape model with the support vector machine (SVM) classifier[9] are the two CT image segmentation methods of this class.
Most of the aforementioned methods for segmentation of teeth are based on deformable models.[1,2,3,4,5,8] However, some deformable models (e.g., snake model) are unable to change their own topology, so they cannot detect the two adjacent teeth. Moreover, the initial curve has prominent effects on the segmentation results in these models. The level set based methods do not have the problems mentioned above, but these methods generally have considerable computation cost and need human interaction.[10] Furthermore, deformable models can only extract the boundary of each tooth and are not able to determine the internal structure of each segmented tooth, for example, the holes, which are essential for several applications such as root canal morphology. The case of metal artifacts in these images has not been resolved in most of the previous works. Some techniques for the reduction of metal artifact have been provided in some other researches. Linear interpolation and cubic interpolation of missing data in sinogram space are popular methods.[11,12] Another way of reduction is to replace corresponding unaffected projections in adjacent slices as the missing projections in sonogram space.[13,14] In some other work,[15] the missing projections were estimated using an exemplar-based inpainting technique.[16] Other methods directly fix the damaged image through some image processing techniques such as iterative deblurring,[17] segmentation,[18] and knowledge-based methods.[19] In the previous works,[20] we introduced a multi-step technique based on the mean shift algorithm for teeth segmentation of CT images. In this research, inspired by our previous experiences considering the main challenges (such as metal artifacts and noise), we propose a fully automated technique that uses the least square SVM (LS-SVM) classifier and mean shift algorithm for teeth segmentation in CT volumetric data. This paper is organized as follows. We describe the mean shift algorithm and LS-SVM classifier in detail in section 2. In section 3, we present our method for automatic segmentation of the teeth in CT images. In section 4, some promising results are demonstrated and analyzed. Finally, we conclude our work with a summary of the paper and some future works in section 5.
BACKGROUND
Mean Shift Algorithm
The mean shift algorithm[21] is a density estimation-based nonparametric clustering method. The principles of this method are as follows:[22] Given n data points Xi, i = 1,…, n in the d-dimensional space Rd, radially symmetric kernel K(x) (which profile of the kernel is k(x)) and bandwidth parameter h; the multivariate kernel density estimator is:
Where ck, d is a normalization constant which causes k (x) integrate to one.[22]
If we define g (x) = k’(x); g (x) as a new profile, the kernel G (x) is defined as:
G(x) = cg,dg(∥x∥2) (2)
Then it proves the mean shift vector obtained as follows:
The mean shift vector moves to find a point where the density estimator has a zero gradient and the local maximum of density. Mean shift method is able to determine all pixel clusters of the image. Therefore, internal structures of teeth can be extracted in the case of dental slices after segmentation. Moreover, we can define appropriate arbitrary dimensions for feature space to get accurate results of segmentation by the mean shift algorithm.
Support Vector Machine
SVM is a supervised kernel-based learning model which was invented by Vapnik.[23,24] This algorithm is widely used in real-world applications such as handwritten digit recognition,[25] medical image segmentation,[26] and face detection from images.[27] SVM model analyzes data and recognize patterns used for classification and regression analysis. In general, SVM maps input vectors into a higher dimensional feature space through a kernel function to perform efficiently nonlinear classifications as linear classifications. Noticeable feature of this model is that the classes, which are not linearly separable in real space, can be separated linearly in a higher dimensional feature space. The principles of this model are as follows:
Given a set of training data  where xk ∈ Rn and corresponding output pattern yk∈ {−1, +1}, the SVM classifier takes the following form in the feature space:
yk[wT ø(xk) + b] ≥ 1 k = 1,..., N (4)
Where ø(x) is the nonlinear function which maps input data from original space to the high dimensional space and b is a real constant. In case a separating hyperplane does not exist, Variables ξk are used and the classifier is defined as follows:
yk[wT ø(xk) + b] ≥ 1 − ξk k = 1,..., N (5)
ξk ≥ 0, k = 1,..., N
The risk bound is minimized by the following optimization problem:
The Lagrangian function is used to solve this problem and then we will get a quadratic programming problem that needs to be solve.
LS-SVM is a LS version of SVM which was introduced by Suykens and Vandewalle.[28] The idea of this model is to modify the formula by adding a least square term to the cost function, so the optimization problem are reformulated as:
The ek is the error in the kth training data and γ is the penalty factor which is the trade-off between a smoother classification and the training error.
By this modification, it is not necessary to solve convex quadratic programming problem and solving a set of linear equations is substituted. This solution reduces the computation cost of the problem.
PROPOSED METHOD
In this section, we introduce our method for automatic segmentation of volumetric dental CT images. Main steps of the proposed method are as follows:
First step: Metal artifact reduction (MAR) and noise removal
Second step: Initial segmentation and individual tooth region detection
Third step: Final segmentation.
In the remainder of this section, we review each step of the proposed algorithm:
First Step: Metal Artifact Reduction and Noise Removal
The existence of noise and metal artifacts in dental CT images are the important problems that make the segmentation difficult. The effect of metal artifacts is generated due to the metal objects in the teeth or jaws such as dental implants and metallic fillings. To address these problems, the preprocessing step is required to improve the quality of the affected slices in dental CT images. In this section, an efficient algorithm is proposed for the MAR and noise removal. An overview of the proposed method is shown in Figure 1. The main idea of the proposed algorithm is the classification of image pixels into two general categories: Teeth pixels and nonteeth pixels. The first category consists of dental structures’ pixels, which should remain unchanged in the result of MAR algorithm. The second category consists of the background pixels, which may have been affected due to metal artifacts and need to be corrected. The following steps were performed for each slice in the datasets.
Figure 1.

The overview of the metal artifact reduction method
Specifying teeth and nonteeth pixels
In this step, the dental structure pixels are separated from other pixels in the image. To this end, the LS-SVM classification model was used to identify teeth and nonteeth pixels. This learning model classifies data with good accuracy and high speed.[29] To train this model, first, we selected two middle and crown slices and segmented them manually; second, the possible label for each pixel was considered: Teeth or nonteeth. The training set consisted of three factors: The coordinates of the pixel needed to classify, its intensity value and intensity values of its neighbors. The size of this neighborhood is defined by an (m × m) input window where m equals 5 in this work. Thus, each training sample has 27 features (two for pixel coordinates, one for pixel intensity value and 24 for neighbor pixels intensity values). Initially, all the teeth pixels and an equal number of randomly selected nonteeth pixels were used for training. The LS-SVM model was trained to produce a binary value of 1 for an input window whose center is the target tooth's pixel or a 0 value otherwise. After the learning process, the LS-SVM model was used to identify teeth pixels in other slices of the CT image.
Partitioning of nonteeth pixels
Generally, nonteeth pixels belong to the background of the image. The background pixels are divided into three distinct groups. The first group contains the pixels that have very low-intensity values. Often, the streaking artifacts are identified with high-intensity pixels so we can assume that the pixels in the first group have not been affected by metal artifacts and consequently must have remained unchanged. The second group contains the pixels that have a higher intensity than the first group, but their intensities are not high enough to certify the impact of the metal artifacts. The third group includes pixels with high-intensity values and has most likely been affected by the metal artifacts. Two threshold values should be used to determine the areas of each group. Manual specification of the threshold values might give poor results because of the nonuniform intensity variations in some regions of dental CT slices. In addition, the choice of the two global threshold values for a particular slice might be inappropriate for other slices. Moreover, manual selection of the threshold values for individual slices is a time-consuming task. Therefore, we used a thresholding method based on Fuzzy C-mean clustering (FCM)[30] to apply an automated threshold value selection. Hence, each region is regarded as a fuzzy set, and three clusters are considered for fuzzy clustering of the background pixels.
Modifying the background areas
In this step, each group of the background pixels is repaired as follows:
First group: This group contains the dark background pixels of a slice which have certainly not been affected by metal artifacts and remained unchanged
Second group: This group forms the light background of the image. Most of the pixels in this group are related to the soft tissues and must remain unchanged. However, there might be some dark background pixels affected by the metal artifacts located in this group. To correct them, we replaced the intensity value of each pixel by the median of the intensity value of itself, its neighboring pixels, and the corresponding pixels in the previous adjacent slice
Third group: This group consists of pixels with high-intensity value and is most probably affected by metal artifacts. To repair them, we replaced their values with the corresponding unaffected pixels in the previous adjacent slice.
Aggregate the images and guided filtering
In this step, we aggregated four images obtained in the previous steps, to get a reconstructed image. A guided filter[31] was then applied on the reconstructed slice to smooth it while preserving the edges. The guided filter considers the content of a guidance image to perform an edge preservable smooth filtering. The guidance image or any other appropriate image can be taken as the input image.[31] In this case, we use reconstructed image as a guidance image.
This algorithm was executed slice by slice, starting from the root region slices. In many CT images root slices are not affected by the metal artifacts, so they can be used effectively for correcting the next slices. This strategy is not practical in some cases that the dental implant replaces the dental root and needs further investigation.
Second Step: Initial Segmentation and Individual Tooth Region Detection
In the second step, the CT slices were initially segmented and individual teeth regions were detected. To this end, two stages were considered as follows:
First stage: Initial segmentation to separate bony structures from other tissues
In this stage, first, the bony structures were separated from other tissues. To this end, the mean shift filtering was applied to each slice of the CT image so as to smooth the image while preserving details. Then an appropriate threshold value was determined for eliminating nonbony pixels. Figure 2a shows an original slice of the CT image and Figure 2b shows the result of this stage.
Figure 2.
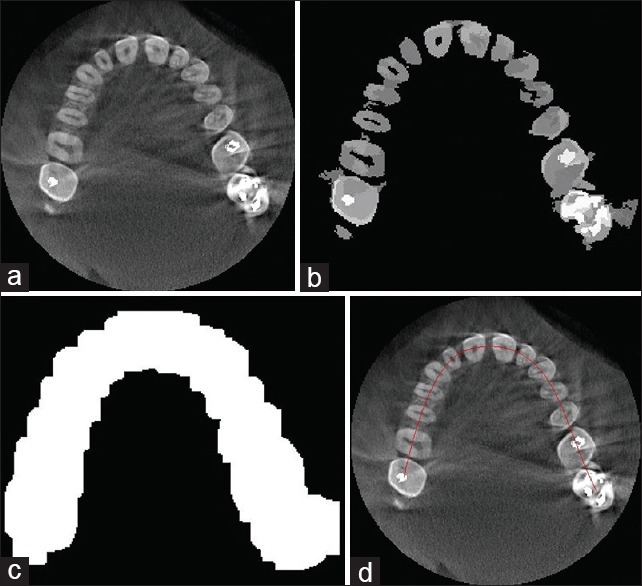
(a) An original slice, (b) Applying mean shift filtering and thresholding, (c) Binary dilated image, (d) Estimated dental arc
Second stage: Individual tooth region detection
In this step, we first separated the general region of the teeth from other bony structures and then we fitted an arc on the teeth region for estimating separator lines between teeth. Gao and Chae[32] proposed a method to detect individual region of each tooth from the CT image. To this end, adjacent teeth are separated by a plane in the 3D space. This method is proper to separate the teeth that have regular structure but contains some errors in separating the teeth with a high degree of root curvature. To solve this problem, we used separator lines instead of planes in the 2D space of each slice. Other steps are similar to the steps of the mentioned method.[32] First, the general region of the teeth and other bony structures were estimated by applying a morphological dilation operator on the binary image of the previous step. The general region of the teeth was then found considering the assumptions defined in the above-mentioned work[32] [Figure 2c]. Next, arc of the teeth was estimated using the least squares spline modeling[33] for white pixels [Figure 2d]. In this step, the separator lines between teeth are to estimate. To this end, we considered a line crossing for each dental arc point and calculated its integral intensity and then we plotted a profile, which indicates the integral intensity values of the points along the arc. Then local minimums were obtained by determining an appropriate threshold value for the integral intensity profile. These local minimums were considered as the arc's separator points. Each separator line passed through the corresponding point and was perpendicular to the arc [Figure 3a]. It should be noted that the holes were filled with pixels of more intensity values using a morphological reconstruction operator[34] to avoid obtaining the wrong local minimums. Furthermore, it is important to choose an appropriate threshold value for obtaining the local minimums, which can also be automated using intelligent threshold selection methods.
Figure 3.
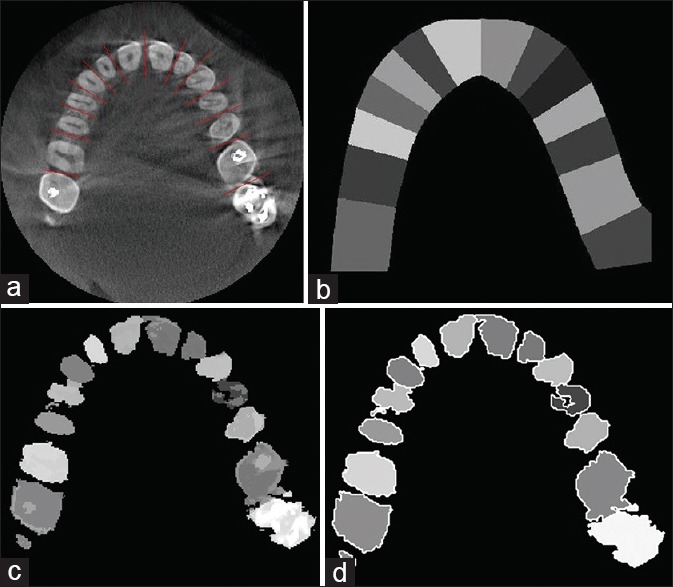
(a) The separating lines between teeth, (b) Estimating a general area for each tooth, (c) Segmentation result after eliminating backgrounds, (d) Detected individual boundaries after segmentation
Third Step: Final Segmentation
In this step, final segmentation of CT slices is done using the mean shift algorithm. Appropriate dimensions are defined for the feature space to overcome the previous problems mentioned at the introduction section. The feature space is a 2D lattice of 3D vectors. The 2D lattice represents the spatial coordinate of each pixel and 3D vector for each pixel is defined as follows:
Intensity value of the pixel is the first dimension of pixel vector
We assigned a certain value to the pixels of each tooth region. This value is considered as the second dimension of each pixel vector [Figure 3b]
We distinguished the teeth and other bony tissues in the image by considering the fact that the teeth have a lot of inner edges. For this purpose, the edge map of the original image was extracted by phase congruency method.[35] The measurement of phase congruency provides information that are invariant to the image contrast and can be used for efficient corner and edge detection.[35] The result of this general edge detection method was incorporated with the initial segmented image. The intensity values in the resulted image are considered for the third dimension of the feature vector of each pixel.
The result of segmentation is an image in which all the teeth were specified as separate areas. The teeth were specified separately by eliminating the background clusters in the segmented area of each tooth [Figure 3c]. The mean shift method determines individual boundaries of each tooth by identifying its different cluster. Detected individual boundaries in a sample slice are shown in Figure 3d. Finally, the Shear-Warp approach[36] was used for volume rendering and 3D visualization of the segmented CT image. The main idea of the Shear-Warp approach is the factorization of the viewing matrix into a 3D shear, a projection to construct a distorted intermediate image and a 2D warp to generate the final image.[36] Figure 4a shows a 3D visualization of two of the original CT images of the upper jaw in two views. Figure 4b shows the images after the segmentation process.
Figure 4.

(a) Three-dimensional visualizing of two of the original computerized tomography images by Shear-Warp approach 36, (b) Three-dimensional visualizing of the images after segmentation process by Shear-Warp approach 36
RESULTS
We have used 14 dental cone-beam CT (CBCT) datasets to evaluate the proposed method, which were provided from the patients with different ages and various teeth conditions. Regarding patients’ sex, 9 women and 5 men were selected. Their mean age was 40 with the standard deviation of 11.6 and median of 45. CBCT scans were performed on Planmeca Promax 3DS and Scanora 3D imaging systems. The images are stored in DICOM files with the 16-bit gray level resolution. The voxels sizes of the image from Planmeca Promax 3DS are 320 μm with X-ray parameters of 84 kV and 12 mA for the voltage and current, respectively. The voxel sizes of the image from Scanora 3D were 200 mm with the X-ray parameters of 90 kV and 13 mA for the voltage and current, respectively. The algorithm was implemented using C++ and Matlab environment.
Most of the previous approaches are based on the deformable models.[1,2,3,4,5,8] Gao and Chae.[1] used a single edge-based level set method[37] for root segmentation and coupled the edge-based level set method[37] for crown segmentation with a modification of energy function. This algorithm is not fully automated and needs the user interaction to identify the initial boundaries of teeth, and they did not consider the problem of metal artifacts.
Keyhannejad et al.[2] applied the edge-based level set method[38] for the segmentation of bony tissues from other tissues and also the region-based level set method[39] (Chen-Vase model) for the segmentation of teeth from other bony tissues. Finally, the teeth boundaries were estimated using anatomical information and 2D panoramic image. In this study, they assumed the upper and lower jaw are symmetric, but it is not often a correct assumption in reality. Moreover, by using a 2D panoramic image in the 3D space, a lot of information will be lost. Besides, the existence of metal artifacts may give poor results in this work. Hosntalab et al.[4] improved this method by proposing an approach for the metal artifacts reduction. They also employed variational region-based level set technique[39,40] for the segmentation. Although this method has better performance than the previous method, use of the 2D panoramic image in 3D space makes inaccurate initial contours for the segmentation.
Gao and Chae[3] used the coupled edge based level set method to build a virtual common boundary between two adjacent teeth. This algorithm also needs user interaction to identify the initial boundaries of the segmented teeth. Similarly, they did not consider the effect of metal artifacts.
Grzegorzek et al.[5] proposed a method which uses the active contour[41] (Snake model) to segment the teeth of CT image. In this research, the user is required to manually set the reference points of all the teeth, which are applied to determine initial boundaries. Moreover, Snake model has some inherent problems which are mentioned in section 1.
Yanagisawa and Omachi[8] presented a method for extracting the 3D shape of teeth using the region growing algorithm and active contour model. This method is unable to completely separate adjacent teeth in the crown region, and the lack of a proper artifact reduction approach may give poor results in some cases. Furthermore, it needs user interaction to set points for all teeth, which are required for region growing algorithm.
As it became clear, several previous studies proposed semi-automatic methods and need user interaction to perform segmentation. In addition, the problem of the metal artifact has not been considered in most previous works. Our proposed method does not have these problems and produces accurate results through a fully automated mechanism.
Too demonstrate the efficiency of our proposed method, we have compared our results with the results of two famous deformable models which have been used in most previous works. These deformable models are region-based level set method (Chan-Vase model)[39] and edge-based level set method.[38] We also have compared our results with the result of the two novel deformable models: Active contours with selective local or global segmentation,[42] and Level Set method preserving distance function.[43] As a baseline comparison, we also considered a conventional segmentation method based on thresholding. Therefore, we evaluated the proposed method comparing our method with the mentioned methods as well as the ground truth which was generated by a radiologist. In the remainder of this section, we review the functionality and accuracy analysis of the proposed method.
Functionality Analysis
We evaluated the functionality of the proposed method by displaying the segmentation results of the sample slices. To assess the functionality of the MAR algorithm proposed in the first step, we chose a middle slice and a crown slice with the metal artifacts. These slices are shown in Figure 5a and b, respectively. The results of applying the MAR algorithm on the selected slices are also shown in Figure 5c and d, respectively. According to the results, the proposed MAR algorithm reduces the metal artifacts of the slices, especially middle slices, but it may not have a noticeable functionality in the case of crown slices with intensive metal artifacts and, therefore, needs further investigation. Functional evaluation of the proposed segmentation method is displayed in Figure 6. The first row in Figure 6 shows three samples of the crown, middle and root slices. Manually segmented slices are also shown in the second row, and the third row shows the results of the proposed method. As shown in Figure 6, the results are very similar to the manually segmented slices.
Figure 5.
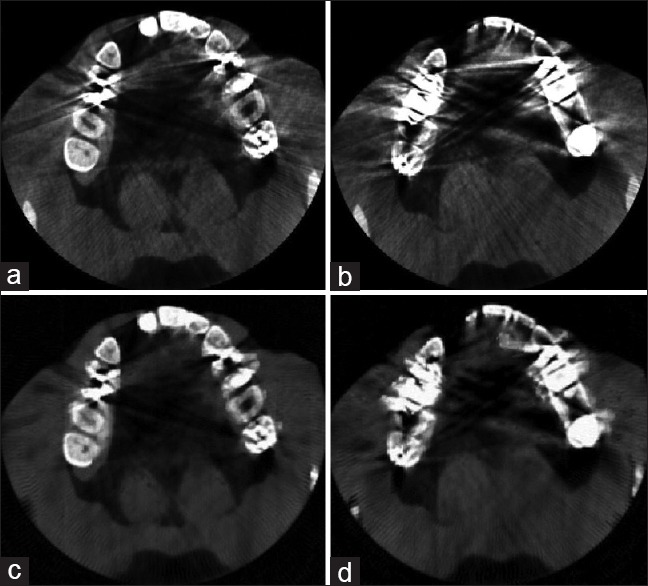
(a) A middle slice with metal artifacts, (b) A crown slice with metal artifacts, (c) Middle slice after applying metal artifact reduction algorithm, (d) Crown slice after applying metal artifact reduction algorithm
Figure 6.
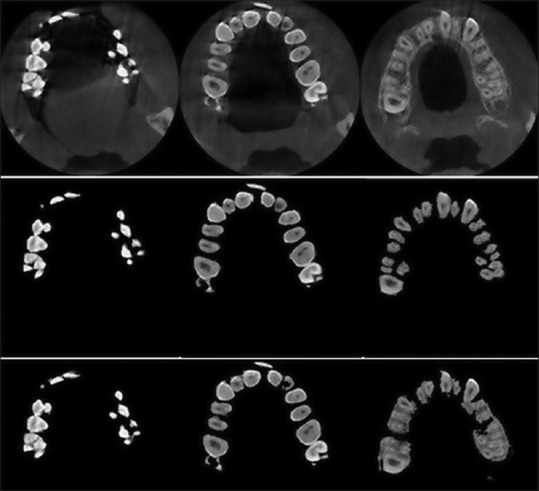
Three sample of crown, middle and root slices, manually segmented slices and segmented slices by the proposed method
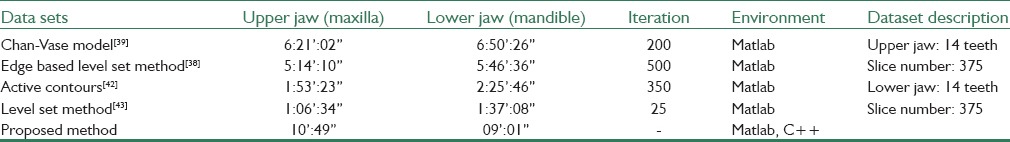
Moreover, the segmentation algorithm was tested on a laptop with a Core 2Due 2.6 GHz CPU and 3 GB memory. The proposed method was written in C++ and Matlab environment and all deformable models was implemented in Matlab environment. Table 1 presents the running time for two datasets of the maxilla and mandible with 375 slices and 14 teeth. We took these datasets as example which can be reference for other images because all CT images have similar characteristics. As depicted in Table 1 deformable models need different iteration number for the contour evolution. The most time-consuming part of deformable models is the iterative process of reinitializing contours or signed distance function. Level Set method preserving distance function[43] needs fewer iteration number than other deformable models in order to get proper results. The mean shift method is also iterative. At every iteration, the kernel is moved to the local maximum of density, but the number of iterations is variant in different images and in uniform images is less than nonuniform images. In order to perform fast segmentation, we implemented the main steps of our segmentation method in C++ language programming. The execution time was about 9–11 min which is practicable in actual applications.
Table 1.
Computation time for segmenting a full dataset
Accuracy Analysis
The accuracy analysis of the proposed methodology was carried out by assessing the segmentation results using the reliable measures. In the first evaluation, the performance measures[44] are used as follows: Sensitivity  , specificity
  , precision
  , accuracy
  and error rate
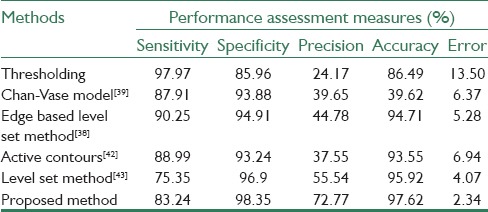
  . True positive (TP), false positive (FP), false negative (FN) and true negative (TN) and Pref are, in this regard, calculated as follows: TP pixels are correctly segmented as teeth tissues, FP pixels are incorrectly segmented as teeth tissues, TN pixels are correctly segmented as nonteeth tissues, FN pixels are incorrectly segmented as nonteeth tissues, and Pref is the sum of TP, TN, FP, and FN. We divided the available datasets into two main groups: The first group which included 5 datasets unaffected by the metal artifacts (3 datasets of the maxilla and 2 datasets of the mandible) and the second group which consisted of 9 affected datasets: 4 datasets of the maxilla and 5 datasets of the mandible. The purpose of this categorization is the investigation of the capability of the proposed method in segmenting the images with the effect of metal artifacts or without them. In addition, we evaluated the effectiveness of the proposed MAR algorithm. Table 2 contains the results of applying the proposed method on the images which had no metal artifacts. As illustrated in this table, the proposed method has better performance in segmenting the middle and crown slices than the root ones. This is due to the low contrast of the root slices which made the segmentation difficult. Table 3 contains the results of applying the proposed method on images which had metal artifacts. The first column tabulates the results of the segmentation without MAR, while the second column shows the results of the segmentation with applying MAR algorithm in the first step. As depicted in Table 3, the MAR algorithm is more effective in enhancing the results. Furthermore, we evaluated the accuracy of the proposed method in comparison with the previous methods through calculating the performance measures for each method. As shown in Table 4, the rate of accuracy, precision and specificity of the proposed method are higher than other methods, and its error rate is also lower than others. Our method increased the sensitivity, specificity, precision and accuracy of the segmentation results by 83.24%, 98.35%, 72.77%, and 97.62%, respectively and decreased the error rate by 2.34%.
Table 2.
Quantitative evaluation of the proposed method on three categories slices
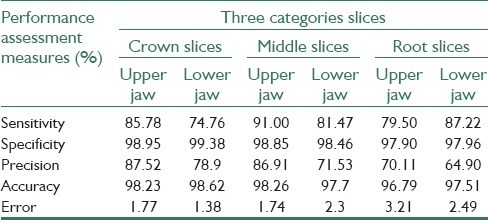
Table 3.
The performance measures of the proposed method for datasets affected by metal artifacts and effectiveness of the MAR algorithm to improve segmentation results
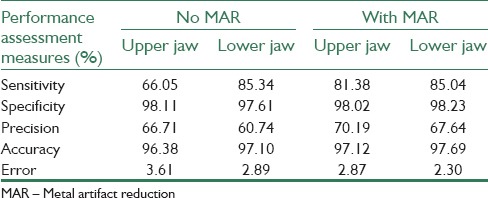
Table 4.
Performance comparison of our method with other methods
The performance measures of the proposed method for datasets affected by metal artifacts and effectiveness of the MAR algorithm to improve segmentation results [Table 3].
The receiver operating characteristic (ROC) curve[45] is another appropriate measure for comparing the segmentation methods. The vertical and horizontal lines are associated with the sensitivity and specificity, respectively. The area under the ROC curve quantifies the ability of the method to discriminate between teeth pixels and nonteeth pixels. According to the plotted ROC curves in Figure 7, the curve of our proposed method has a better position than other methods. As described in Table 5, the area under the proposed method's curve is estimated about 0.98 that is greater than the area under other curves.
Figure 7.
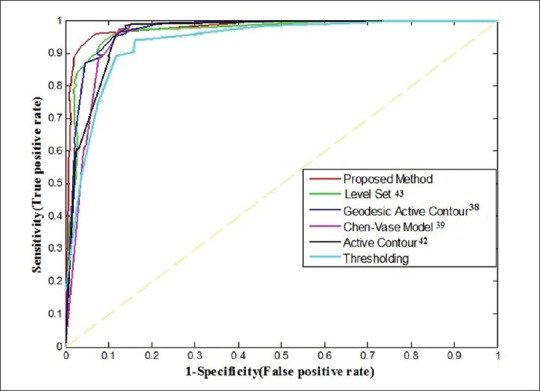
The receiver operating characteristic curves of the proposed method and other methods
Table 5.
The area under ROC curves of our method and other methods

CONCLUSION AND FUTURE WORKS
In this work, we focused on the automatic tooth segmentation of the CT image slices. To this end, we proposed a multi-step method based on the mean shift algorithm. Our method includes three main steps. We proposed an efficient MAR algorithm using LS-SVM classification and FCM thresholding as the first step. Then, we separated the general area of dental structures from other bony tissues and detected the region of each tooth. Finally, the final segmentation was performed using the mean shift algorithm through defining an appropriate feature space. Experimental results show the efficiency of our proposed method in teeth segmentation. We evaluated the proposed method in terms of functionality and accuracy analysis. Functional analysis indicated the capability of the proposed method achieving its goals. Accuracy analysis was done by reliable performance measures. The quantitative assessment indicated that the proposed method is effective for the segmentation of the crown and middle slices, and the segmentation results of these slices are more accurate than root slices due to the problem of low contrast in root slices. Moreover, experimental results indicated the performance enhancement by the proposed segmentation compared to the previous techniques. The use of an efficient technique for 3D visualization of the segmented slices is one of the future works regarding this research. In addition, the efficiency of the algorithm in root segmentation needs further investigation. Assessment of the proposed method with more datasets and using our segmentation results for further applications such as root canal morphology are our future challenges.
Financial Support and Sponsorship
Nil.
Conflicts of Interest
There are no conflicts of interest.
BIOGRAPHIES

Parinaz Mortaheb received her B.Sc. degree in Software engineering in 2010 from Islamic Azad University of Isfahan (Khorasgan Branch), Isfahan, Iran. She received her M.Sc. degree in Artificial Intelligence (Robotic) from Yazd University, Yazd, Iran, in 2013. She is currently a lecturer of Department of Computer Engineering at Islamic Azad university of Khomeini Shahr and Payam Nour university in the field of Artificial Intelligence. Her research interests include biomedical image processing, computer vision, machine learning, and Multi-agent systems.
E-mail: parinaz.mortaheb@gmail.com.

Mehdi Rezaeian has received his B.Sc. degree in electronics engineering in 1994 from KNT University, Tehran, Iran. He received his M.Sc. degree in Biomedical engineering from University of Tehran in 1997. In 1999, he joined the faculty of engineering at University of Tehran for five years. In 2010, he received his Ph.D. degree from Swiss Federal Institute of Technology in Zurich. Since 1998, his main research is in image processing and computer vision topics. Now, he is an assistant professor of Department of Electrical and Computer Engineering at Yazd University, Iran. He published more than 40 papers in journals and conferences.
E-mail: mrezaeian@yazd.ac.ir.
REFERENCES
- 1.Gao H, Chae O. Individual tooth segmentation from CT images using level set method with shape and intensity prior. Pattern Recognit. 2010;43:2406–17. [Google Scholar]
- 2.Keyhannejad S, Zoroofi R, Setarehdan S, Shirani G. Bangalore, India: IET International Conference on Visual Information Engineering; 2006. Automated Segmentation of Teeth in Multi-Slice CT Images; pp. 339–44. [Google Scholar]
- 3.Gao H, Chae O. Xi’an, China: 5th International Conference on Visual Information Engineering; 2008. Touching Tooth Segmentation from CT Image Sequences Using Coupled Level Set Method; pp. 382–7. [Google Scholar]
- 4.Hosntalab M, Aghaeizadeh R, Abbaspour A, Shirani TG. Segmentation of teeth in CT volumetric dataset by panoramic projection and variational level set. Int J CARS. 2008;3:257–65. [Google Scholar]
- 5.Grzegorzek M, Paulus D, Trierscheid M, Papoutsis D. Hong Kong: IEEE; 2010. Teeth Segmentation in 3D Dentition Models for the Virtual Articulator. Proceeding of 2010 IEEE 17th International Conference on Image Processing; pp. 3609–12. [Google Scholar]
- 6.Dong-Ri S, Fu-Yuan G. Chengdu, China: IEEE; 2010. The Segmentation Algorithm of Dental CT Images Based on Fuzzy Maximum Entropy and Region Growing. International Conference on Bioinformatics and Biomedical Technology; pp. 74–8. [Google Scholar]
- 7.Kuroiwa Y, Hazuki S. Singapore: IEEE; 2011. Introduction of C/A (Covariance/Area) with Applications to Tooth Segmentation in Dental CT Image. 8th International Conference on Information, Communications and Signal Processing (ICICS) pp. 1–5. [Google Scholar]
- 8.Yanagisawa R, Omachi S. Tokyo, Japan: Springer Berlin Heidelberg; 2010. Extraction of 3D shape of a tooth from dental CT images with region growing method. 4th International Workshop on Computational Forensics (IWCF) pp. 68–77. [Google Scholar]
- 9.Duy NT, Lamecker H, Kainmueller D, Zachow S. Automatic detection and classification of teeth in CT data. Med Image Comput Comput Assist Interv. 2012;15(Pt 1):609–16. doi: 10.1007/978-3-642-33415-3_75. [DOI] [PubMed] [Google Scholar]
- 10.Liu J, Chen J, Liu X, Chun L, Tang J, Deng Y. Mass segmentation using a combined method for cancer detection. BMC Syst Biol. 2011;5(Suppl 3):S6. doi: 10.1186/1752-0509-5-S3-S6. [DOI] [PMC free article] [PubMed] [Google Scholar]
- 11.Kalender WA, Hebel R, Ebersberger J. Reduction of CT artifacts caused by metallic implants. Radiology. 1987;164:576–7. doi: 10.1148/radiology.164.2.3602406. [DOI] [PubMed] [Google Scholar]
- 12.Bazalova M, Beaulieu L, Palefsky S, Verhaegena F. Correction of CT artifacts and its influence on Monte Carlo dose calculations. Med Phys. 2007;34:2119–32. doi: 10.1118/1.2736777. [DOI] [PubMed] [Google Scholar]
- 13.Yazdi M, Beaulieu L. San Diego, CA, USA: IEEE; 2006. A Novel Approach for Reducing Metal Artifacts due to Metallic Dental Implants.2006 IEEE Nuclear Science Symposium Conference Record; pp. 2260–3. [Google Scholar]
- 14.Tohnak S, Mehnert AJ, Mahoney M, Crozier S. Dental CT metal artefact reduction based on sequential substitution. Dentomaxillofac Radiol. 2011;40:184–90. doi: 10.1259/dmfr/25260548. [DOI] [PMC free article] [PubMed] [Google Scholar]
- 15.Chen Y, Li Y, Guo H, Hu Y, Luo L, Yin X, et al. CT metal artifact reduction method based on improved image segmentation and sinogram in painting. Math Probl Eng. 2012;2012:1–12. [Google Scholar]
- 16.Criminisi A, Pérez P, Toyama K. Region filling and object removal by exemplar-based image inpainting. IEEE Trans Image Process. 2004;13:1200–12. doi: 10.1109/tip.2004.833105. [DOI] [PubMed] [Google Scholar]
- 17.Wang G, Snyder DL, O’Sullivan JA, Vannier MW. Iterative deblurring for CT metal artifact reduction. IEEE Trans Med Imaging. 1996;15:657–64. doi: 10.1109/42.538943. [DOI] [PubMed] [Google Scholar]
- 18.Mirzaei S, Guerchaft M, Bonnier C, Knoll P, Doat M, Braeutigam P. Use of segmented CT transmission map to avoid metal artifacts in PET images by a PET-CT device. BMC Nucl Med. 2005;5:3. doi: 10.1186/1471-2385-5-3. [DOI] [PMC free article] [PubMed] [Google Scholar]
- 19.Kennedy JA, Israel O, Frenkel A, Bar-Shalom R, Azhari H. The reduction of artifacts due to metal hip implants in CT-attenuation corrected PET images from hybrid PET/CT scanners. Med Biol Eng Comput. 2007;45:553–62. doi: 10.1007/s11517-007-0188-8. [DOI] [PubMed] [Google Scholar]
- 20.Mortaheb P, Rezaeian M, Soltanian-Zadeh H. Zanjan, Iran: IEEE; 2013. Automatic Dental CT Image Segmentation Using Mean Shift Algorithm. 8th Iranian Conference on Machine Vision and Image Processing (MVIP2013) pp. 807–12. [Google Scholar]
- 21.Fukunaga K, Hostetler L. The estimation of the gradient of a density function, with applications in pattern recognition. IEEE Trans Inf Theory. 1975;21:32–40. [Google Scholar]
- 22.Comaniciu D, Meer P, Member S. Mean shift: A robust approach toward feature space analysis. IEEE Trans Pattern Anal Mach Intell. 2002;24:603–19. [Google Scholar]
- 23.Vapnik V, Lerner A. Pattern recognition using generalized portrait method. Autom Remote Control. 1963;24:774–80. [Google Scholar]
- 24.Cortes C, Vapnik V. Support-vector networks. Mach Learn. 1995;20:273–97. [Google Scholar]
- 25.Liu C, Nakashima K, Sako H, Fujisawa H. Handwritten digit recognition: Benchmarking of state-of-the-art techniques. Pattern Recognit. 2003;36:2271–85. [Google Scholar]
- 26.Moyano-Cuevas JL, Plaza A, Dopido I, Pagador JB, Sanchez-Margallo JA, Sánchez LF, et al. Seville, Spain: 2014. 3D Segmentation of MRI of the Liver Using Support Vector Machine. XIII Mediterranean Conference on Medical and Biological Engineering and Computing; pp. 368–71. [Google Scholar]
- 27.Moh TS, Shah PM. Savannah, GA, USA: ACM, Proceedings of the Annual Southeast Conference; 2013. Time-Efficient Architecture for Face Detection from Images Using Support Vector Machine; p. 18. [Google Scholar]
- 28.Suykens JA, Vandewalle J. Least squares support vector machine classifiers. Neural Process Lett. 1999;9:293–300. [Google Scholar]
- 29.Zhu YZ, Mao ZM. Hammamet, Tunisia: IEEE; 2004. Online Optimal Modeling of LS-SVM Based on Time Window.2004 IEEE International Conference on Industrial Technology, 2004 IEEE ICIT ‘04; p. 3. [Google Scholar]
- 30.Jawahar CV, Biswas PK, Ray AK. Investigations on fuzzy thresholding based on fuzzy clustering. Pattern Recognit. 1997;30:1605–13. [Google Scholar]
- 31.He K, Sun J, Tang X. Guided image filtering. IEEE Trans Pattern Anal Mach Intell. 2013;35:1397–409. doi: 10.1109/TPAMI.2012.213. [DOI] [PubMed] [Google Scholar]
- 32.Gao H, Chae O. Busan, South Korea: IEEE; 2008. Automatic Tooth Region Separation for Dental CT Images. Third 2008 International Conference on Convergence and Hybrid Information Technology; pp. 897–901. [Google Scholar]
- 33.De Boor C. A Practical Guide to Splines. Revised Edition. New York, USA: Springer-Verlag; 2001. [Google Scholar]
- 34.Soille P. New York, USA: Springer-Verlag New York, Inc; 2003. Morphological Image Analysis: Principles and Applications. [Google Scholar]
- 35.Felsberg M, Sommer G. The monogenic signal. IEEE Trans Signal Process. 2001;49:3136–44. [Google Scholar]
- 36.Lacroute P, Levoy M. Orlando, FL, USA: ACM; 1994. Fast Volume Rendering Using a Shear-Warp Factorization of the Viewing Transformation. SIGGRAPH 94 21st International ACM Conference on Computer Graphics and Interactive Techniques; pp. 451–8. [Google Scholar]
- 37.Paragios N, Deriche R. Geodesic active regions: A new framework to deal with frame partition problems in computer vision. J Vis Commun Image Represent. 2002;13:249–68. [Google Scholar]
- 38.Caselles V, Kimmel R, Sapiro G. Geodesic active contours. Int J Comput Vis. 1997;10:1467–75. [Google Scholar]
- 39.Chan TF, Vese LA. Active contours without edges. IEEE Trans Image Process. 2001;10:266–77. doi: 10.1109/83.902291. [DOI] [PubMed] [Google Scholar]
- 40.Vese LA, Chan TF. A multiphase level set framework for image segmentation using the Mumford and Shah Model. Int J Comput Vis. 2002;50:271–93. [Google Scholar]
- 41.Kass M, Witkin A, Terzopoulos D. Snakes: Active contour models. Int J Comput Vis. 1988;1:321–31. [Google Scholar]
- 42.Zhang K, Zhang L, Song H, Zhou W. Active contours with selective local or global segmentation: A new formulation and level set method. Image Vis Comput. 2010;28:668–76. [Google Scholar]
- 43.Estellers V, Zosso D, Lai R, Osher S, Thiran JP, Bresson X. Efficient algorithm for level set method preserving distance function. IEEE Trans Image Process. 2012;21:4722–34. doi: 10.1109/TIP.2012.2202674. [DOI] [PubMed] [Google Scholar]
- 44.Sokolova M, Lapalme G. A systematic analysis of performance measures for classification tasks. Inf Process Manag. 2009;45:427–37. [Google Scholar]
- 45.Fawcett T. An introduction to ROC analysis. Pattern Recognit Lett. 2006;27:861–74. [Google Scholar]