Abstract
Breast cancer is the most common type of cancer among women. The important key to treat the breast cancer is early detection of it because according to many pathological studies more than 75% – 80% of all abnormalities are still benign at primary stages; so in recent years, many studies and extensive research done to early detection of breast cancer with higher precision and accuracy. Infra-red breast thermography is an imaging technique based on recording temperature distribution patterns of breast tissue. Compared with breast mammography technique, thermography is more suitable technique because it is noninvasive, non-contact, passive and free ionizing radiation. In this paper, a full automatic high accuracy technique for classification of suspicious areas in thermogram images with the aim of assisting physicians in early detection of breast cancer has been presented. Proposed algorithm consists of four main steps: pre-processing & segmentation, feature extraction, feature selection and classification. At the first step, using full automatic operation, region of interest (ROI) determined and the quality of image improved. Using thresholding and edge detection techniques, both right and left breasts separated from each other. Then relative suspected areas become segmented and image matrix normalized due to the uniqueness of each person's body temperature. At feature extraction stage, 23 features, including statistical, morphological, frequency domain, histogram and Gray Level Co-occurrence Matrix (GLCM) based features are extracted from segmented right and left breast obtained from step 1. To achieve the best features, feature selection methods such as minimum Redundancy and Maximum Relevance (mRMR), Sequential Forward Selection (SFS), Sequential Backward Selection (SBS), Sequential Floating Forward Selection (SFFS), Sequential Floating Backward Selection (SFBS) and Genetic Algorithm (GA) have been used at step 3. Finally to classify and TH labeling procedures, different classifiers such as AdaBoost, Support Vector Machine (SVM), k-Nearest Neighbors (kNN), Naïve Bayes (NB) and probability Neural Network (PNN) are assessed to find the best suitable one. These steps are applied on different thermogram images degrees. The results obtained on native database showed the best and significant performance of the proposed algorithm in comprise to the similar studies. According to experimental results, GA combined with AdaBoost with the mean accuracy of 85.33% and 87.42% on the left and right breast images with 0 degree, GA combined with AdaBoost with mean accuracy of 85.17% on the left breast images with 45 degree and mRMR combined with AdaBoost with mean accuracy of 85.15% on the right breast images with 45 degree, and also GA combined with AdaBoost with a mean accuracy of 84.67% and 86.21%, on the left and right breast images with 90 degree, are the best combinations of feature selection and classifier for evaluation of breast images.
Keywords: Breast cancer, breast thermography, classification, feature selection, TH, thermogram
INTRODUCTION
Breast cancer is the most common type of cancer among women. The important key to treat is early detection of it because according to many pathological studies, more than 75–80% of all abnormalities are still benign at primary stages; so in the recent years, many studies and extensive research have been carried out for early detection of breast cancer with higher precision and accuracy.[1,2]
Before the cells become cancerous, tissues around them start creating new blood vessels to prepare a constant supply of nutrients supporting their rapid growth. These types of so-called “bad” cells, lead to the release of chemicals into the surrounding areas and can help the blood vessels to be built one after another continuously which is known as “angiogenesis.” These highly active blood vessels feed nutrients to newly formed hungry cancerous cells, it can cause increasing fluid (lymph and blood) propagation and then producing heat leading to increase of local temperature near the skin around cancerous tissue, forming “hot spots.” These hot spots are created before growing as benign tumors.[3,4]
Recently, mammography and ultrasound imaging were the most used techniques for the early detection of breast cancer. The harms of standard mammography technique can be aggressive because experts believe that electromagnetic radiation itself can be considered as a stimulating factor for cancer development. Moreover, this technique is very disturbing because patient complains of breast discomfort due to pushing it. Ultrasound is also very effective in detecting different breast masses but has a high degree of fault to detect the ductal carcinoma.[5,6] To remove the disadvantages of current methods, infrared thermography can be used as a complementary method for detecting breast abnormalities in thermal images. Infrared thermography uses a highly sensitive infrared camera to obtain the image of the temperature distribution in the human body. This imaging technique due to the use of nonionizing radiation (passive), noncontrast enhanced injection, noncontact, and noninvasive is very valuable in many biological and medical applications when compared or in combination with other imaging modalities. Moreover, recording temperature distribution patterns in thermography leads to the physiological interpretation of tissues (temperature change based on interaction patterns), which could reveal suspected areas of cancer tissue even when there is no anatomical abnormalities on the tissue surface and it seems quite healthy; while the other diagnostic techniques such as mammography and ultrasound lead to the anatomical interpretation of tissues which reveals the problems after structural changes in higher stages of breast cancer. Results of thermography can show forming of the tissue masses in the human body, 8–10 years sooner than mammography. Temperature variations are relevant with changes in breast tissue.[7,8,9,10]
Various studies for the early detection of breast cancer using breast thermograms have been done. In 1961, Williams et al.[11] showed the possibility of detecting breast cancer from increased temperature at breast tissue acquired by infrared thermography (temperature sensitivity was about 2°C in the image acquired during a few minutes). Subsequent studies showed that the thermal images can be helpful to detect breast cancer. Parisky et al.[12] after 4 years of a clinical trial on 769 patients reported that infrared thermal imaging is a noninvasive and safe technique, can be very valuable in the determination of the benign or malignant breast abnormalities combined with mammography. Arora et al.[13] performed a clinical trial on 92 patients, leading that digital infrared thermal imaging was very valuable in women with dense breast tissue whenever combined with conventional imaging technique such as ultrasound and mammography. Kennedy et al.[14] showed that the combination of thermotherapy and other diagnostic techniques can improve the sensitivity and specificity of breast abnormality detection. Kermani et al.[15] performed the color segmentation using Gaussian mixture model on the breast thermography images. In their method, weighted Gaussian components are fit to pixel values in RGB color space. Model parameters are estimated using the popular iterative expectation-maximization algorithm. After segmentation, they ordered the obtained clusters based on the increase in average temperature.
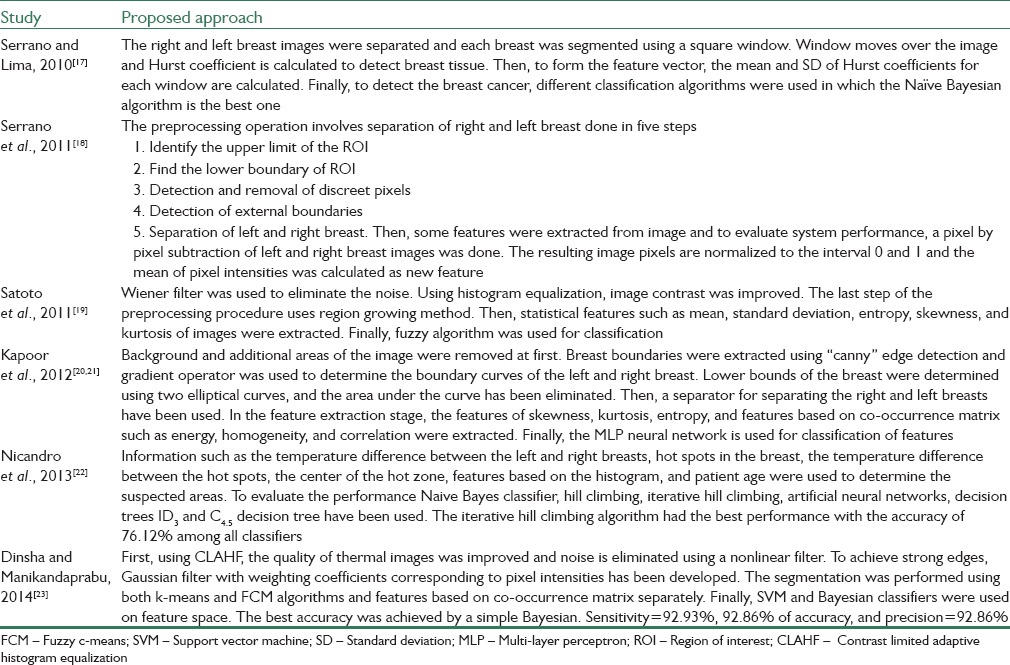
Many studies to detect breast cancer using thermography have been carried out in the late 1960s–1970s. Since the classification was done intuitively and directly by physician, those days, leading to a high false acceptance rate percentage, but based on the development of technology in the recent years, it has been proved that the increase in metabolic activity of cancerous cells and angiogenesis at the neighborhood tissues can make changes in surface temperature of the breast.[16] Table 1 represents some previous studies to detect breast cancer using thermography images.[17,18,19,20,21,22,23]
Table 1.
Previous proposed methods of detecting breast cancer using thermogram images
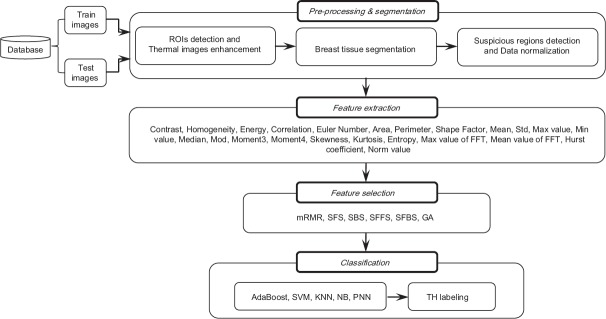
In the present study, due to a lot of attractions of breast thermography, a method with a very noticeable accuracy, sensitivity, and severity has been proposed. Proposed algorithm consists of four main steps: Preprocessing and segmentation, feature extraction, feature selection, and classification. At the first step, using full automatic operation, region of interest (ROI) was determined and the quality of image was improved. Then, using thresholding and edge detection techniques, both right and left breasts separated from each other, so relatively suspected areas become segmented and image matrix normalized to the uniqueness of each person's body temperature. At feature extraction stage, 23 features, including statistical, morphological, frequency domain, histogram, and gray level co-occurrence matrix (GLCM)-based features are extracted from the segmented right and left breast obtained from step 1. Then, to reduce the computation burden and increase the accuracy of proposed algorithm, feature selection methods such as minimum redundancy and maximum relevance (mRMR), sequential forward selection (SFS), sequential backward selection (SBS), sequential floating forward selection (SFFS), sequential floating backward selection (SFBS), and genetic algorithm (GA) have been used at step 3. Finally, to classify and assign TH, different classifiers such as AdaBoost, support vector machine (SVM), k-nearest neighbors (k-NN), Naïve Bayesian (NB), and probability neural network (PNN) are assessed to find the best suitable results. It should be noted that the sympathetic nervous system has not been activated and experiments have been done normally in these stages.
MATERIALS AND METHODS
In this research, to evaluate the performance of proposed method, the native database obtained by the help of Fanavaran Madoon Ghermez (FMG) Co., Ltd.[24] using one infrared camera (Thermoteknix VisIR 640, Resolution: 480 × 640) from the patients whom their physician was suspicious to have breast cancer and referred them to Imam Khomeini hospital for more accurate clinical examinations. Acquired Images labeled as TH1-TH5 depend to the stage of cancer by an oncologist observing all ethical issues. This database contains images with different angles such as 0°, ±45°, and ±90° before and after ice test (ice test: Putting their hands on a mixture of ice and water for about 20 min) and then a total of 10 images for each. The total number of people participated until writing this paper was 67 (total 670 images). In this paper, all views of images before the ice test for all 67 participants have been used.
The scanned area of the body should be devoid of clothing or jewelry. The camera has been designed in a way that has always been to reduce/eliminate technical errors in the imaging process. For medical applications, a controlled environment (scan room temperature: 18–23°C) helps to increase accuracy. Infrared camera should be placed at a certain distance (1.5 m) from the patient. The patient was told not to use cream or powder on the body surface before imaging, smoking, eating spicy foods, and chewing gum 3 h before imaging. Moreover, the patient was told to avoid shaving, doing any exercise or physical stimulation 24 h, and any sunbath or steam bath minimum 1 week before imaging. At least 1 month should be passed from biopsy and 3 months after breast surgery, radiation, and chemotherapy. All windows should be shielded to prevent heat radiation into the room. Fluorescent light must be away from the scanning area. The camera should be turned on for about 15 min before imaging. To avoid the stress of environment effects on body temperature, the floor should be carpeted or the patient should put on shoes. All thermal energy radiation sources such as hot water pipes, windows, insulation, and heating channels should be checked to have no effects on imaging process. Any lack of a sore throat, chest pain, chills, and no fever should be checked and confirmed by a doctor. The patient should not be placed back into the field or screen. Each of these parameters can be completely useful and effective in a matter of testing/diagnosis or treatment.[25]
The patient was told to put her hands on her head in rest state. Five different angle (0°, ±45°, and ± 90°) images were obtained (before ice test). Then, the patient was told to put her hands into the mixture of water and ice for about 20 min and so five another different angles image (0°, ±45° and ±90°) were obtained again (after the ice test). Table 2 shows the distribution of patients in whom their cancer stages (standard level: TH) were labeled by oncologist according to a paper by Gautherie et al.[26] for both the right and left breasts separately.
Table 2.
The distribution of patients in whom their cancer stages (standard level: TH) were labeled by oncologist for both right and left breasts separately

The proposed method includes four stages: (1) Preprocessing and segmentation, (2) feature extraction, (3) feature selection, (4) classification, and TH labeling. Figure 1 shows the structure of the presented method. Details of each section of the proposed algorithm will be presented.
Figure 1.
Proposed system architecture
Preprocessing and Segmentation
Preprocessing, especially in data-driven studies, is a very important stage because a better preprocessing procedure can cause a better classification results. To distinguish between normal and abnormal tissues, preprocessing and segmentation were performed in three stages: (1) ROIs detection and thermal images enhancement, (2) breast tissue segmentation, (3) suspicious regions detection and data normalization.
The first stage of the proposed method is to remove additional regions. The tissues of the neck and under breast are removed by automatic cutting and deleting the lateral arrays of the matrix image. The warmer areas are darker with less intensity. Therefore, images were complemented to change the color palette from false to true. Furthermore, the salt and pepper noise was removed by a 3 × 3 median filter. To improve the local contrast, histogram of images was equalized and adjusted. Now, details were displayed with more accuracy. Then, to determine the area of the breast tissue, “Sobel” edge detector by a threshold value of 0.05 is applied and the horizontal and vertical edges (minimum 20 continuous endmost pixels needed to be determined as a real edge) were found. Again, areas of surrounding tissue are cut to minimize the estimation error and so enhanced ROIs were detected in thermal images [Figure 2a–h].
Figure 2.
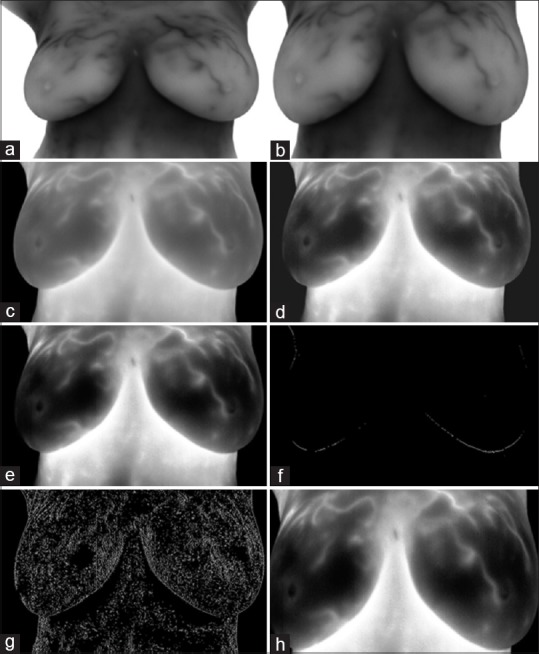
Region of interests detection and thermal image enhancement. (a) Original image; (b) removing additional regions including tissues of neck and under breast; (c) complementing the image and removing salt and pepper noise; (d) histogram equalizing of image; (e) histogram adjusting of image; (f) applying “Sobel” edge detector to obtain horizontal edges; (g) applying “Sobel” edge detector to obtain vertical edges; (h) determined region of interests
The second stage of preprocessing and segmentation is separation of the right and left breast. The coordinate of endmost pixels for lateral, upper, and lower edges are obtained. A separating line was drawn from mean coordinates of lateral edges to separate the right and left breast. As a result, the image is automatically cut at the desired point and two separate images are obtained as right and left breast [Figure 3].
Figure 3.
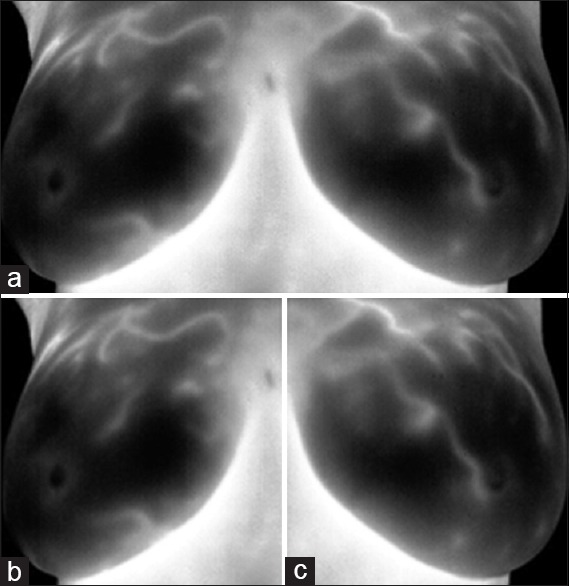
Breast tissue segmentation. (a) Determining region of interests; (b) right breast image; (c) left breast image
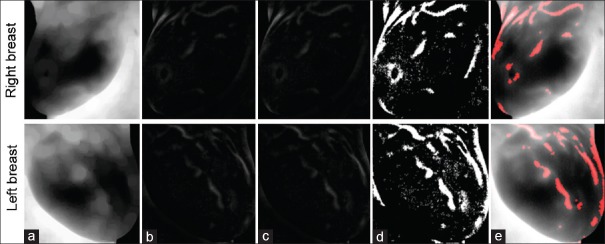
To extract suspicious regions more accurately, “Erosion” morphological operator by disk structuring element size of 10 has been used to estimate the background [Figure 4a], and the difference of estimated background and original image is obtained [Figure 4b]. Then, due to a unique temperature of every patient, data were normalized by dividing the elements to the norm of image matrix [Figure 4c]. Finally, the suspicious regions are obtained by applying adaptive thresholding [Figure 4d]. At last, final results were obtained using opening morphological operator by disk size 2, and adding it to original image [Figure 4e].
Figure 4.
Suspicious regions detection. (a) Original image after applying Erosion operator; (b) difference of estimated background and original image; (c) image matrix normalization; (d) suspicious regions detection by applying adaptive thresholding; (e) using opening morphological operator and adding to original images
Feature Extraction
In feature extraction stage, it is necessary to extract the information from images so that the system can distinguish between normal and abnormal tissues correctly. Each feature is extracted from the right and left breast separately. The features are contrast, homogeneity, energy, correlation, Euler number, area, perimeter, shape factor, mean, standard deviation, max-value, min-value, median, mod, central moment with order 3, central moment with order 4, skewness, kurtosis, entropy, max value of fast Fourier transform, mean value of fast Fourier transform, Hurst coefficient, and norm.
Mentioned features include statistical features, features based on histogram, GLCM, morphology of suspicious regions, and frequency domain. Contrast, homogeneity, energy, and correlation are based on GLCM; Euler number, area, perimeter, and shape factor are based on morphology of suspicious regions; mean, standard deviation, max-value, and min-value are based on histogram; median, mod, skewness, and kurtosis are based on statistical features, and finally, max value of fast Fourier transform and mean value of fast Fourier transform are based on frequency domain.
Feature Selection
Various information causes a high dimensionality feature matrix that reduces accuracy and increases computation burden. Hence, to obtain a more accurate selection and further reduction of the number of extracted features, different feature selection methods are used. In this paper, the mRMR,[27] SFS,[28] SBS,[28] SFFS,[29] SFBS,[29] and GA[30] are applied and compared with each other.
Classification and TH Labeling
Classification is the final stage in the proposed approach. Hence, selected feature matrix was fed into the classification algorithm to detect TH. In this research, to show the performance of the proposed method, different classification algorithms have been applied and their results have been evaluated and compared with each other to obtain the best results. These algorithms are AdaBoost,[31,32] SVM,[33] k-NN,[34] NB,[34] and PNN.[35]
TH is a standard measure to analyze thermovascular's breast that was proposed in the 1980s. Hence, physicians classify thermal images into five categories based on the combined vascular and temperatures patterns across the two breasts (TH1: Normal nonvascular, TH2: Normal vascular, TH3: Equivocal, TH4: Abnormal, TH5: Severely abnormal).[36]
RESULTS
In this research, to evaluate the performance of proposed method, the native database obtained by the help of Fanavaran Madoon Ghermez (FMG) Co., Ltd.[24] using one infrared camera (Thermoteknix VisIR 640, Resolution: 480 × 640) from the patients whom their physician was suspicious to have breast cancer and referred them to Imam Khomeini hospital for more accurate clinical examinations. Acquired Images labeled as TH1-TH5 depend to the stage of cancer by an oncologist observing all ethical issues. This database contains images with different angles such as 0°, ±45°, and ±90° before and after ice test (ice test: Putting their hands on a mixture of ice and water for about 20 min) and then a total of 10 images for each. The total number of people participated until writing this paper was 67 (total 670 images). In this paper, all views of images before the ice test for all 67 participate have been used.
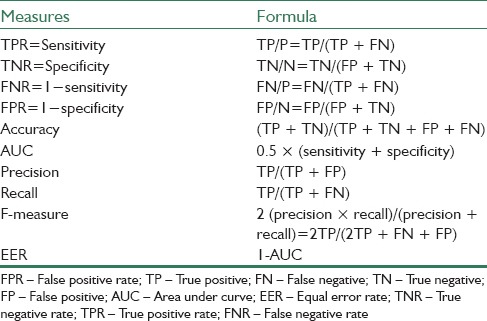
In the proposed approach, after determining ROIs and enhancing thermal images, right and left breast tissues have been separated by edge detection operators. To detect suspicious regions in each breast, “Erosion” morphological operator with a circular disk with a radius of 10 has been used. Then, the mentioned features have been extracted from right and left breast images. To obtain optimal features, different feature selection methods as mentioned in section 3-3 have been applied. Finally, the selected feature matrix was fed to different classifiers for determining TH, of that AdaBoost showed the best result among other classifiers. Experimental results show the best result obtained when k, the number of neighbors in k-NN classifier is equal to 3, the smoothing parameters in PNN classifier is equal to 0.35, and also Gaussian kernel with degree 6 is used for SVM classifier and value of parameter C is considered equal to 1. To evaluate the proposed method, 20-fold cross validation for left breast images and 22-fold cross validation for right breast images have been used. In addition, to show the efficiency of the provided system, some measures according to Table 3, such as sensitivity, specificity, area under the curve, equal error rate, precision, recall, F-measure, and false positive rate (FPR) have also been calculated.
Table 3.
Employed measures for evaluating proposed system
Performance Assessment of the Proposed Method
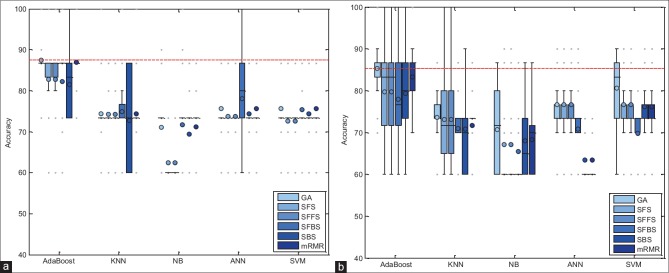
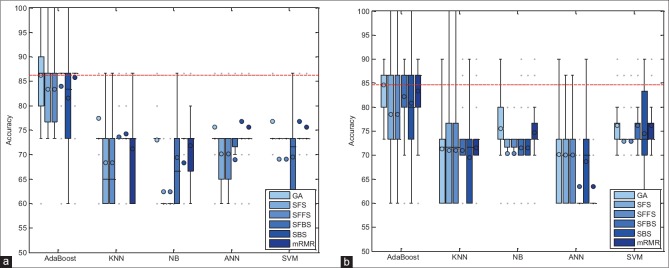
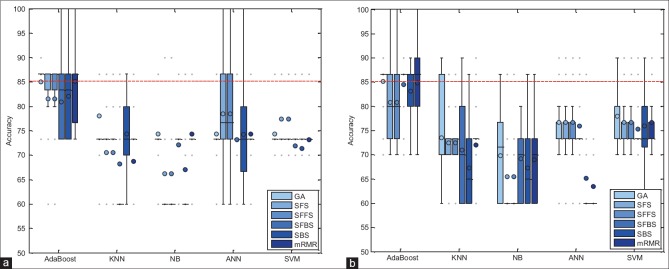
In this section, the performance of proposed method has been evaluated with combinations of different feature selection methods and classifiers. In this experiment, five classification methods such as AdaBoost, SVM, k-NN, NB, and PNN combined with six feature selection methods such as mRMR, SFS, SBS, SFFS, SFBS, and GA have been used. The results are expressed by using box-whisker plots in Figures 5–7 for 0°, 45°, and 90°, respectively. Horizontal axis shows different classifiers and vertical axis shows measures for evaluating the performance of the system. Box-plot also can show average and median. On each box, the horizontal line denotes median, the circle denotes mean, the horizontal lines outside each box identify the upper and lower whiskers, and dot points denote the outliers. The dotted line in each figure shows the highest mean accuracy for a combination of one feature selection method with one classification method among the other combinations in the left and right breast images. As shown, the combination of AdaBoost with GA gained the best result on breast images with 0° angle in both left and right breast images, also in breast images with 45° angle, the combination of AdaBoost with GA gained the best result on left breast images and the combination of AdaBoost with mRMR gained the best result on right breast images. Images with 90° angle have also the same combination with 0° images. The accuracy of these methods was compared with other methods in the right and left breast images in Figures 8-10. The best accuracies obtained by the best combinations are also shown in Table 4.
Figure 5.
Accuracy of the proposed system, corresponding to different feature selector and classifiers on 0° breast images. (a) Right breast images; (b) left breast images
Figure 7.
Accuracy of the proposed system, corresponding to different feature selector and classifiers on 90° breast images. (a) Right breast images; (b) left breast images
Figure 8.
Comparison of the accuracy of different feature selection methods in 0° breast images. (a) Comparing results on right breast images; (b) comparing results on left breast images. (Dark blue: Mean accuracy, light blue: Max accuracy)
Figure 10.
Comparison of the accuracy of different feature selection methods in 90° breast images. (a) Comparing results on right breast images; (b) comparing results on left breast images. (Dark blue: Mean accuracy, light blue: Max accuracy)
Table 4.
Evaluation of the best combinations obtained on the right and left breast images in different breast images degrees

Figure 6.
Accuracy of the proposed system, corresponding to different feature selector and classifiers on 45° breast images. (a) Right breast images; (b) left breast images
Figure 9.
Comparison of the accuracy of different feature selection methods in 45° breast images. (a) Comparing results on right breast images; (b) comparing results on left breast images. (Dark blue: Mean accuracy, light blue: Max accuracy)
Evaluation of the Proposed Method with Different Fold Cross Validation
As mentioned before, 20-fold cross validation for left breast images and 22-fold cross validation for right breast images have been used in the proposed method. Of course, to show the performance of proposed technique, different folds have been studied that according to Figures 11 and 12, the best result has been obtained with 20- and 22-fold cross validation for left and right breast images, respectively. In these figures, the mean and maximum accuracy obtained for different folds can be seen.
Figure 11.
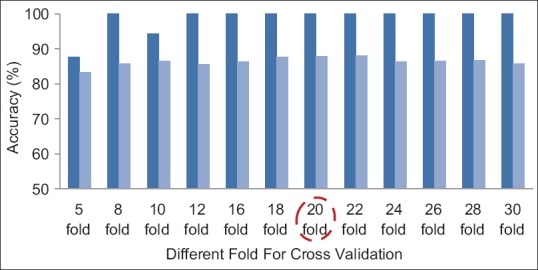
The accuracies obtained for a number of different folds for left breast images. Dark blue: Max accuracy, light blue: Mean accuracy
Figure 12.
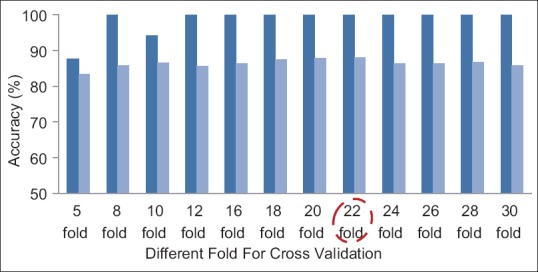
The accuracies obtained for a number of different folds for right breast images. Dark blue: Max accuracy, light blue: Mean accuracy
Training and Testing Error of Proposed System
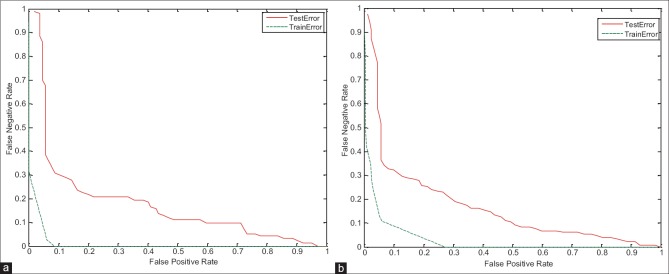
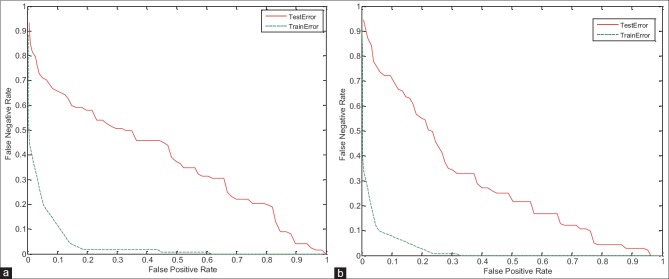
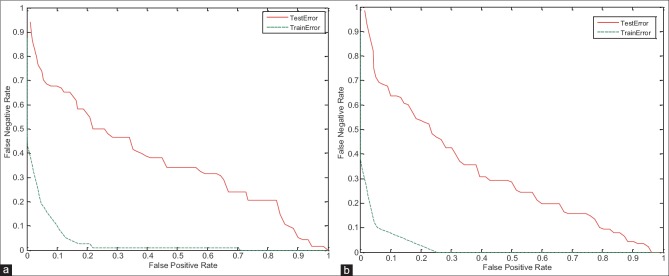
In this section, to verify the proposed system, the training and testing error have been studied. As shown in the detection error trade-off (DET) curve in Figures 13–15, the training error of proposed system is less than the testing error. Of course, this problem is obvious and logical that its’ correctness has been proved in diagrams. In DET curve, axis X and axis Y denote FPR and false negative rate (FNR), respectively. In breast cancer detection system, both errors of FPR and FNR are important. FNR error occurs when the image is normal, but detected as abnormal (it has been said, it is abnormal mistakenly). FPR error occurs when the image is abnormal, but detected as normal (it has been said, it is normal mistakenly). Hence, for the occurrence of FPR error, we will incur additional cost because the image is abnormal, but normal is detected, and this error may be irreparable. Therefore, reduction of FPR error is important in the breast cancer detection systems. In the proposed system, mean FPR, in breast images with 0° for the right and left breast images are equal to 0.0786 and 0.0917, respectively, in the breast images with 45° for the right and left breast images are also equal to 0.0928 and 0.0927, respectively, and finally, mean FPR, in breast images with 90° for the right and left breast images are equal to 0.0862 and 0.0958, respectively. The minimum FPR of the right and left breast images in 3° has been reduced to near zero. The values obtained for FPR indicate the advantage of the proposed algorithm.
Figure 13.
Detection error trade-off curve for evaluation of training and testing error in breast images with 0° angle. (a) On the right breast images, (b) on the left breast images
Figure 15.
Detection error trade-off curve for evaluation of training and testing error in breast images with 90° angle. (a) On the right breast images, (b) on the left breast images
Figure 14.
Detection error trade-off curve for evaluation of training and testing error in breast images with 45° angle. (a) On the right breast images, (b) on the left breast images
Comparison with the State-of-the-Art
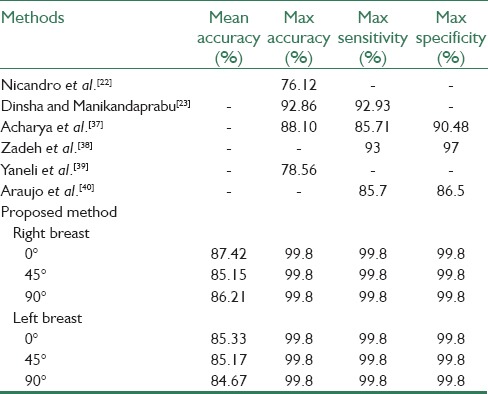
Table 5 shows the comparison results of the proposed method with other methods. The obtained results indicate the high efficiency of the presented algorithm. It should be noted that the best accuracy of mentioned methods was compared with the proposed method and also the native database was used in these methods to test their algorithm.
Table 5.
Comparing the proposed method with previous methods
CONCLUSION
In the proposed method, an imaging technique based on thermography was used to detect the early changes occurring in the breast tissue and cancer cells. The thermography is used based on higher metabolic activity and blood flow in the surrounding of the cancerous tissue than the normal tissue. Infrared thermography is a promising technology for breast cancer detection. Hence, it can be used as an imaging technique to improve the efficiency of detecting breast cancer and thus to complement the results of the mammogram. The advantages of thermal imaging than the mammography are:
Avoiding applying harmful and ionizing radiations
The first symptoms of breast cancer detection based on mammography are diagnosed about 8–10 years later than thermography. Thus, according to the importance of time in cancer treatment and because 80% of tumors and abnormalities are still in the benign stage, chance of treatment is increased about 99%
Thermography can lead to deletion of unnecessary biopsies. Studies have shown that 70–80% of all biopsies that the mammograms shown to be cancerous were unnecessary and in fact, there existed no sign of cancer. Breast thermography has an accuracy of about 90%. In addition, researches have shown that thermography could increase life expectancy rate. In addition, it is a passive method because it emits no ionizing radiation to the patient and is risk-free.
Hence, in this paper, a new method was developed for breast cancer detection based on thermography to detect suspicious areas and label-related TH. To obtain the five categories, TH1-TH5, four main steps in three degrees 0°, 45° and 90° were implemented: Preprocessing and segmentation, feature extraction, feature selection, and classification. Preprocessing and segmentation stage include ROI detection and thermal images enhancement, breast tissue segmentation, suspicious areas detection, and data normalization. Data normalization was used due to the uniqueness of temperature for each person. In this step, elements of image matrix are divided to its norm. Twenty-three features with different types were extracted from the right and left breast images and the effective features were selected by different feature selectors. Contrast, area, central moment with order 4, skewness, shape factor, kurtosis, mean value of FFT, and norm value can be marked as effective features in three degrees 0°, 45°, and 90° of breast images. The selected features were evaluated by different classifiers. Finally, to evaluate the proposed algorithm, 20-fold cross validation for left breast images and 22-fold cross validation for right breast images are used. The combination of AdaBoost with GA in breast images with 0° angle gained the best mean accuracy of 85.33% on the left breast images and the best mean accuracy of 87.42% on the right breast images. In the breast images with 45° angle, the combination of AdaBoost with GA gained the best mean accuracy of 85.17% on the left breast images and the combination of AdaBoost with mRMR gained the best mean accuracy of 85.15% on the right breast images. Finally, the combination of AdaBoost with GA in breast images with 90° angle gained the best mean accuracy of 84.67% on the left breast images and the best mean accuracy of 86.21% on the right breast images. These combinations gained the maximum accuracy near to 100%. Furthermore, obtained FPRs for the best combination of feature selection and classification methods, in 0° images, are equal to 0.0917 and 0.0786, on left and right breast images, respectively, in 45° images, are equal to 0.0927 and 0.0928, on left and right breast images, respectively, in 90° images, are equal to 0.0958 and 0.0862, on left and right breast images, respectively. It should be noted that one of the important reasons for the difference in results between different breast image degrees is how to stand the mass or lesion in breast and moreover one of the reasons to justify the difference between left and right breasts results can be inequality in TH1-TH5.
Financial Support and Sponsorship
Nil.
Conflicts of Interest
There are no conflicts of interest.
BIOGRAPHIES

AmirEhsan Lashkari received the BSc degree in Biomedical Engineering from University of Isfahan, Isfahan, Iran in 2009. He received the MSc degree in Biomedical Engineering from Institute of Electrical and Computer Engineering, University of Tehran, Tehran, Iran in 2011. He is also receiving PhD degree in Biomedical Engineering from Electrical and Information Technology Institute, Iranian Research Organization for Science and Technology (IROST), Tehran, Iran in 2016. His research interests include Digital Image Processing, Neural Networks, Pattern Recognition, Intelligent Systems, Machine Vision, Fuzzy Logic, Chaos and Fractal Phenomena, Digital Design, Artificial Intelligent, Digital Signal Processing, Network and Path Planning, Multiple Valued Function, Programmable Device.
E-mail: Lashgari.a@irost.ir.

Fatemeh Pak received MSc degree in artificial intelligent from Islamic Azad University of Qazvin, Iran, in 2013. Currently, she is working in Iranian Research Organization for Science and Technology (IROST), Tehran, Iran. Her research interests include Biometric, medical image processing, machine learning and pattern recognition.
E-mail: fatemehpak@gmail.com.

Mohammad Firouzmand received his MSc degree in Medical Engineering in 1992 and his PhD degree in signal processing in Institute National Poly- technique de Grenoble (INPG), France, in 2007. His research interests include Bio-instruments, signal processing, medical image and audio signal processing, and he has published several research papers in these areas.
E-mail: Firouzmand@irost.org.
Acknowledgments
The authors would like to thank FMG’ Co., Ltd., especially Mr. Mansoor Alidoosti and Ms. Mitra Navid, for their kind help and cooperation in technical supports and acquiring data while working on this project. Also, thank all the patients who participated in this study. This project was registered and funded by “IROST and INSF” by registration number: 92000118.
REFERENCES
- 1.Liberman L, Abramson AF, Squires FB, Glassman JR, Morris EA, Dershaw DD. The breast imaging reporting and data system: Positive predictive value of mammographic features and final assessment categories. AJR Am J Roentgenol. 1998;171:35–40. doi: 10.2214/ajr.171.1.9648759. [DOI] [PubMed] [Google Scholar]
- 2.Liberman L. Clinical management issues in percutaneous core breast biopsy. Radiol Clin North Am. 2000;38:791–807. doi: 10.1016/s0033-8389(05)70201-3. [DOI] [PubMed] [Google Scholar]
- 3.Fox SB, Leek RD, Bliss J, Mansi JL, Gusterson B, Gatter KC, et al. Association of tumor angiogenesis with bone marrow micrometastases in breast cancer patients. J Natl Cancer Inst. 1997;89:1044–9. doi: 10.1093/jnci/89.14.1044. [DOI] [PubMed] [Google Scholar]
- 4.INCA, Instituto Nacional do Câncer. [Last accessed on 2011 Mar 01]. Available from: http://www. 2.inca.gov.br .
- 5.Medical Imaging Magazine, Cover Story, Women's Health, May. 2001 [Google Scholar]
- 6.Arena F, Barone C, DiCicco T. Vol. 2. Proceedings of the 25th Annual International Conference of the IEEE; 2003. Use of digital infrared imaging in enhanced breast cancer detection and monitoring of the clinical response to treatment. Engineering in Medicine and Biology Society; pp. 1129–32. [Google Scholar]
- 7.Gautherie M. Milan, Italy: PAPUSA; 1989. Atlas of breast thermography with specific guidelines for examination andinterpretation. [Google Scholar]
- 8.Ng EY, Ung LN, Ng FC, Sim LS. Statistical analysis of healthy and malignant breast thermography. J Med Eng Technol. 2001;25:253–63. doi: 10.1080/03091900110086642. [DOI] [PubMed] [Google Scholar]
- 9.Janda M, Youl PH, Lowe JB, Elwood M, Ring IT, Aitken JF. Attitudes and intentions in relation to skin checks for early signs of skin cancer. Prev Med. 2004;39:11–8. doi: 10.1016/j.ypmed.2004.02.019. [DOI] [PubMed] [Google Scholar]
- 10.Ghayoumi Zadeh H, Haddadnia J, Hashemian M, Hassanpour K. Diagnosis of breast cancer using a combination of genetic algorithm and artificial neural network in medical infrared thermal imaging. Iran J Med Phy. 2012;9:265–74. [Google Scholar]
- 11.Williams KL, Williams FJ, Handley RS. Infra-red thermometry in the diagnosis of breast disease. Lancet. 1961;2:1378–81. doi: 10.1016/s0140-6736(61)91198-9. [DOI] [PubMed] [Google Scholar]
- 12.Parisky YR, Sardi A, Hamm R, Hughes K, Esserman L, Rust S, et al. Efficacy of computerized infrared imaging analysis to evaluate mammographically suspicious lesions. AJR Am J Roentgenol. 2003;180:263–9. doi: 10.2214/ajr.180.1.1800263. [DOI] [PubMed] [Google Scholar]
- 13.Arora N, Martins D, Ruggerio D, Tousimis E, Swistel AJ, Osborne MP, et al. Effectiveness of a noninvasive digital infrared thermal imaging system in the detection of breast cancer. Am J Surg. 2008;196:523–6. doi: 10.1016/j.amjsurg.2008.06.015. [DOI] [PubMed] [Google Scholar]
- 14.Kennedy DA, Lee T, Seely D. A comparative review of thermography as a breast cancer screening technique. Integr Cancer Ther. 2009;8:9–16. doi: 10.1177/1534735408326171. [DOI] [PubMed] [Google Scholar]
- 15.Kermani S, Samadzadehaghdam N, EtehadTavakol M. Automatic color segmentation of breast infrared using Gaussian mixture model. Int J Light Election Opt. 2015;126:3288–94. [Google Scholar]
- 16.Drastich A. Radiation in medicine III. Infradiometric detection, imaging systems. Textbooks FEI VUT in Brno. 1980 [Google Scholar]
- 17.Serrano RC, Lima R. Using Hurst Coefficient and Lacunarity to Diagnosis Early Breast Diseases. 17th International Conference on Systems, Signals and Image Processing. 2010:550–3. [Google Scholar]
- 18.Serrano RC, Motta L, Batista M, Conci A. Using a new method in thermal images of diagnosis early breast cancer. Int J Comput Appl. 2011;11:540–5. [Google Scholar]
- 19.Satoto KI, Nurhayati OD, Isnanto RR. Pattern recognition to detect breast cancer thermogram images based on fuzzy inference system method. Int J Comput Sci Telecomm. 2011;20:484–7. [Google Scholar]
- 20.Kapoor P, Prasad SV, Patni S. Automatic analysis of breast tomograms for tumor detection based on biostatistical feature extraction and ANN. Int J Trends Eng Dev. 2012;7:245–55. [Google Scholar]
- 21.Kapoor P, Prasad SV, Patni S. Image segmentation and asymmetry analysis of breast thermograms for tumor detection. Int J Comput Appl. 2012;50:40–5. [Google Scholar]
- 22.Nicandro CR, Efren MM, Yaneli AA, Enrique MD, Gabriel AM, Nancy PC, et al. Evaluation of the diagnostic power of thermography in breast cancer using bayesian network classifiers. Comput Math Methods Med 2013. 2013 doi: 10.1155/2013/264246. [DOI] [PMC free article] [PubMed] [Google Scholar]
- 23.Dinsha D, Manikandaprabu N. Breast tumor segmentation and classification using SVM and Bayesian from thermogram images. Unique J Eng Adv Sci. 2014;2:147–51. [Google Scholar]
- 24.Fanavaran Madoon Ghermez (FMG) Co., Ltd. [Last accessed on 2016 Jan 24]. Available from: http://www.fmg-med.ir .
- 25.Expanding the use of thermal imaging in the diagnosis of breast cancer. Documents 002–005, Ver 01. [Last accessed on 2015 Feb 14]; [Google Scholar]
- 26.Gautherie M, Haehnel P, Walter JP, Keith LG. Thermovascular changes associated with in situ and minimal breast cancers. Results of an ongoing prospective study after four years. J Reprod Med. 1987;32:833–42. [PubMed] [Google Scholar]
- 27.Peng H, Long F, Ding C. Feature selection based on mutual information: Criteria of max-dependency, max-relevance, and min-redundancy. IEEE Trans Pattern Anal Mach Intell. 2005;27:1226–38. doi: 10.1109/TPAMI.2005.159. [DOI] [PubMed] [Google Scholar]
- 28.Whitney AW. A direct method of nonparametric measurement selection. IEEE Trans Comput. 1971;20:1100–3. [Google Scholar]
- 29.Pudil P, Novovicova J, Kittler J. Floating search methods in feature-selection. Pattern Recognit Lett. 1994;15:1119–25. [Google Scholar]
- 30.Martin-Bautista MJ, Vila MA. A Survey of Genetic Feature Selection in Mining Issues. Proc Congress Evol Comput. 1999;2:1314–21. [Google Scholar]
- 31.Freund Y, Schapire RE. A decision-theoretic generalization of on-line learning and an application to boosting. J Comput Syst Sci. 1997;55:119–39. [Google Scholar]
- 32.Schapire RE, Singer Y. Improved boosting algorithms using confidence-rated predictions. Mach Learn. 1999;37:297–336. [Google Scholar]
- 33.Burges CJ. A tutorial on support vector machines for pattern recognition. Data Mining Knowl Discov. 1998;2:121–67. [Google Scholar]
- 34.Mitchell TM. Burr Ridge, IL: McGraw Hill; 1997. Machine learning. 1997; p. 45. [Google Scholar]
- 35.Specht DF. Probabilistic neural network for classification, map, or associative memory. In Proc IEEE Int Conf Neural Netw. 1988;1:525–32. [Google Scholar]
- 36.Amalu WC, Hobbins WB, Head JF, Elliot RL. The Biomedical Engineering Handbook. 3rd ed. Baton Rouge: Medical Devices and Systems CRC Press; 2006. Infrared imaging of the breast—An overview. [Google Scholar]
- 37.Acharya UR, Ng EY, Tan JH, Sree SV. Thermography based breast cancer detection using texture features and support vector machine. J Med Syst. 2012;36:1503–10. doi: 10.1007/s10916-010-9611-z. [DOI] [PubMed] [Google Scholar]
- 38.Ghayoumi Zadeh H, Pakdelazar O, Haddadinia J, Rezai-Rad G, Mohammad-Zadeh M. Diagnosing breast cancer with the aid of fuzzy logic based on data mining of a genetic algorithm in infrared images. Middle East J Cancer. 2011;3:119–29. [Google Scholar]
- 39.Yaneli AA, Nicandro CR, Efren MM, Enrique MD, Nancy PC, Gabriel AM. Vol. 7629. Proceedings of the 11th Mexican International Conference on Advances in Artificial Intelligence; 2012. Assessment of bayesian network classifiers as tools for discriminating breast cancer pre-diagnosis based on three diagnostic methods; pp. 419–31. [Google Scholar]
- 40.Araujo MC, Lima RC, de Souza RM. Interval symbolic feature extraction for thermography breast cancer detection. Expert Syst Appl. 2014;14:6728–37. [Google Scholar]


