

Abstract
Alzheimer's disease (AD) is one of the most expensive and fatal diseases in the elderly population. Up to now, no cure have been found for AD, so early stage diagnosis is the only way to control it. Mild cognitive impairment (MCI) usually is the early stage of AD which is defined as decreasing in mental abilities such a cognition, memory, and speech not too severe to interfere daily activities. MCI diagnosis is rather hard and usually assumed as normal consequences of aging. This study proposes an accurate, mobile, and nonexpensive diagnostic approach based on electroencephalogram (EEG) signal. EEG signals were recorded using 19 electrodes positioned according to the 10–20 International system at resting eyes closed state from 16 normal and 11 MCI participants. Nineteen Spectral features are computed for each channel and examined using a correlation based algorithm to select the best discriminative features. Selected features are classified using a combination of neurofuzzy system and k-nearest neighbor classifier. Final results reach 88.89%, 100%, and 83.33% for accuracy, sensitivity, and specificity, respectively, which shows the potential of proposed method to be used as an MCI diagnostic tool, especially for screening a large population.
Keywords: Early Alzheimer's disease, electroencephalogram spectral features, k-nearest neighbor, mild cognitive impairment, neurofuzzy
INTRODUCTION
Every 4 s, someone in the world develops dementia. Dementia is a definition for decline in various mental abilities such as memory, speech, and cognition severe enough to interfere with daily life. It mainly affects people after the age of 60; however, there are some reports of cases that start before this age. In 2013, there were an estimated 44.4 million people with dementia worldwide. This number will increase to an estimated 75.6 million in 2030, and 135.5 million in 2050. Already 62% of people with dementia live in developing countries, but by 2050, this will rise to 71%.[1,2]
Alzheimer's disease (AD) is the most common form of dementia which accounts for 60–80 percent of dementia cases and is the third most expensive disease and sixth leading cause of death in the United States.[2] It affects more than 11% of people over age 65 and about 32% of people older than 85 worldwide,[3] and it is estimated that the number of the patient will triple within the next 50 years.[4] AD is a neurodegenerative nonreversible disorder. AD has no known cure now and related medications can only delay the symptoms and slow the progression of the disease, so the most important concern is to diagnose AD as soon as possible.
As mentioned before, having great medication impact directly depends on diagnosing of AD at its early stages. The first stage of AD is mild cognitive impairment (MCI). MCI causes cognitive changes that are serious enough to be noticed by the affected subjects or to their families, but it is not severe enough to interfere with daily life or basic independent function. Because MCI does not severely affect daily life, affected subjects do not meet diagnostic guidelines for AD or dementia, so they have high risk of eventually developing AD or another type of dementia; about 15–20% of MCI patients convert to AD each year while the conversion rate for the general population is 1–2%.[5]
Since MCI is the first symptomatic stage of AD, accurate detecting of MCI is the most important tool to control this incurable disease. Medical diagnosis of MCI is hard, and symptoms are often dismissed as normal consequences of aging. Diagnosis is usually performed through a combination of extensive testing and eliminations of other possible causes. Psychological tests (e.g. Mini-Mental State Examinations [MMSE]), blood tests, spinal fluid, neurological examination, and magnetic resonance imaging (MRI)[6] are used to help diagnose the MCI.
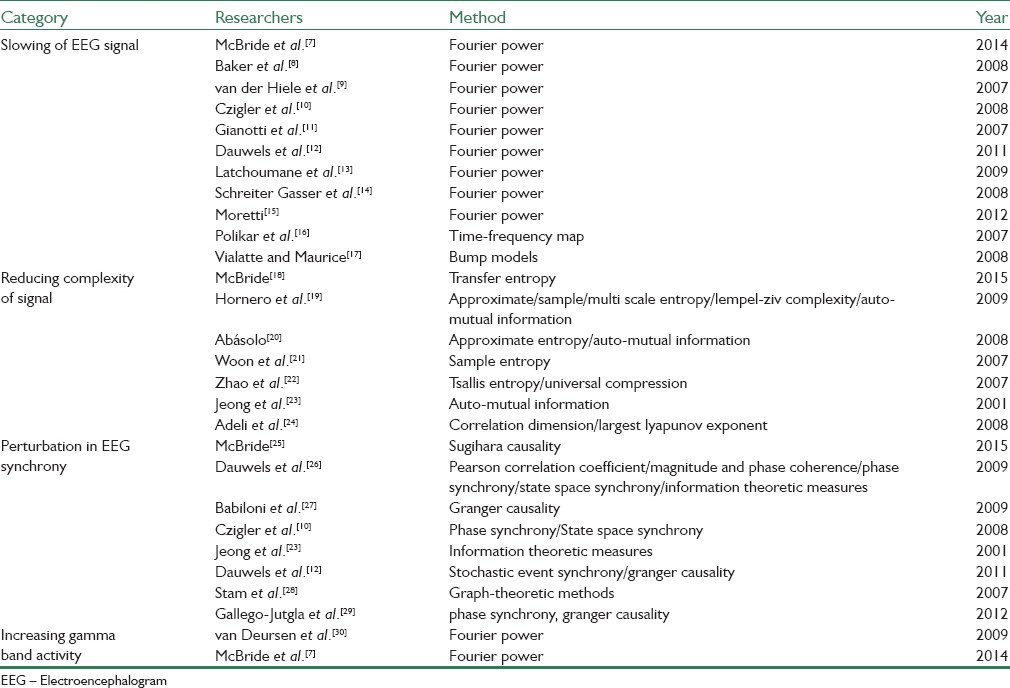
Since electroencephalogram (EEG) recording systems are noninvasive, inexpensive, and (usually) mobile, it would be very efficient and effective screening tool to detect the AD and MCI patients. In the recent years, several research groups have applied different analyzing methods to find some relations between EEG signal and AD/MCI. Their foundation shows that the effects of AD/MCI on EEG can be divided to the following categories:[4] Slowing of EEG, reducing the complexity of EEG, perturbation in EEG synchrony, and increasing gamma activity. Table 1 is a briefly categorized review of previous studies and the methods they used to extract discriminative features. Unfortunately, most of those researches have not specifically focused on diagnosis of MCI, especially to the best of our knowledge, an accurate and reliable method for classification normal versus MCI has not been reported in the literature yet.
Table 1.
Brief categorized summary of performed studies
The rest of paper is arranged as follows; the second section, materials, and methods, will illustrate MCI/normal group selection criteria, EEG recording protocol, preprocessing and feature extraction, selection, and reduction. The third section will show obtained results in figure and table format, and the last section belongs to discussion and conclusions.
MATERIALS AND METHODS
Subjects
Twenty-seven subjects (11 MCI and 16 normal) were selected from participants of previous study,[31,32] which included subjects above 60 years with elementary or higher education and history of coronary angiography during recent year. They were selected from patients who admitted to cardiac catheterization units of Sina and Nour Hospitals, Isfahan, Iran. The study design was ethically discussed and approved by the Deputy of Research and Technology, Isfahan University of Medical Sciences, Isfahan, Iran. Subjects with a history of major psychiatric disorders, substance misuse, head trauma, serious medical disease, and dementia were excluded. The study process was explained for all subjects, and written informed consent was obtained. Neuropsychiatric interview considering Peterson's criteria for MCI[33] has been done for all subjects. MMSE scores from 21 to 26 were utilized for validation of MCI diagnosis and scores more than 26, were considered normal controls.[4] Neuropsychiatry unit cognitive assessment tool (NUCOG) has been used to confirm the diagnosis of MCI and as a dependent variable.[9] The NUCOG scores more than 86.5, between 75 and 86.5, and lower than 75 were considered as normal cognitive state, MCI, and dementia, respectively, in Iranian population.[32] Subject's demographics and psychiatric test scores are summarized in Table 2.
Table 2.
Subject's demographics and psychiatric test scores

Electroencephalogram Recording
All EEG signals were recorded in the morning times while subjects resting comfortably in a quiet room with closed eyes. The EEG activity was recorded continuously from 19 electrodes positioned according to the 10–20 International system (Fp1, Fp2, F7, F3, Fz, F4, F8, T3, C3, Cz, C4, T4, T5, P3, Pz, P4, T6, O1, and O2). Figure 1 shows electrode placement and scalp zoning used in this study. Data were recorded using 32 channel digital EEG device with 256 Hz sampling rate (Galileo NT, EBneuro, Italy). Electrodes-skin impedance was set below 5 kΩ. The recording duration was 30 min because longer recordings would reduce the variability of the data and suppress noise and artifacts, but also possibly increase the slowing of EEG oscillations due to reduced vigilance. Hence, during recording procedure, subjects were been checked out continuously to keep them conscious and avoid drowsiness. After recording procedure, a notch filter was used to remove 50 Hz frequency noise amplified by background electronic devices. Artifacts due to slipping of electrodes or subject's movement were manually removed by visual inspection to obtain clean pieces of signal.
Figure 1.

Electrode placement and scalp zones: 1 = frontal, 2 = left temporal, 3 = central, 4 = right temporal, 5 = occipital
Feature Extraction and Selection
For this step, cleaned EEG signals should be divided into small segments. We tried 0.5, 1, 1.5, and 2 s length with 0%, 25%, 75%, and 50% overlap, which the best results were obtained for 1 s length with 50% overlap. About 19 spectral features[4,7] were computed for each segment and then averaged along whole EEG signal length to obtain 19 overall features for each channel. Table 3 shows those features’ name and their descriptions.
Table 3.
Names and descriptions of extracted features

As mentioned before, 19 overall features were extracted from each channel and as there are 19 EEG channels in our recordings, so a 19 × 19 feature matrix obtained for each participant. As there were no reliable evidence on which feature/features, channel/channels, or zone/zones are the best for our purpose, we started a correlation based pursuit for feature selection step. In our pursuit, we examined features and channels individually, zone-grouped and zone-group-averaged to find the best discriminative features. Tables 4 and 5 show correlations between calculated features and desired results for each channel and zone, respectively. These tables have been color filled (red for negative and blue for positive correlations) for better visualization, which color intensity is proportional to absolute value of correlation.
Table 4.
Correlation between channel features and desired results

Table 5.
Correlation between zone-averaged features and desired results

Somebody may ask why we did not use well-known, easy, and fast feature selection methods such as Principal Component Analysis (PCA) and Independent Component Analysis (ICA) to select the best features. The answer is that almost these methods combine initial features to produce new and more discriminative ones, and we did not want that because we wanted to preserve neurophysiological interpretation of selected features. However, such automated feature selection methods are very powerful and may be used in future studies, especially to build new features that can be used as MCI biomarkers.
Classification
Selected feature, we call them features vector, is now ready for classification step. We used Takagi-Sugeno neurofuzzy (NF) inference system as the main part of our classification step. NF refers to combinations of artificial neural networks and fuzzy logic which results in a hybrid intelligent system that synergizes these two techniques by combining the human-like reasoning style of fuzzy systems with the learning structure of neural networks. The main strength of NF systems is that they are universal approximators with the ability of producing interpretable IF-THEN rules. The strength of NF systems involves two contradictory requirements in fuzzy modeling: Interpretability versus accuracy. In practice, one of the two properties surpasses. The neurofuzzy in fuzzy modeling research field is divided into two areas: Linguistic fuzzy modeling that is focused on interpretability, mainly the Mamdani model; and precise fuzzy modeling that is focused on accuracy, mainly the Takagi-Sugeno model. The structure of a typical Takagi-Sugeno system is shown in Figure 2.[33] First to train NF system, feature vectors of train data were shown to NF system as inputs and their respected values as outputs (MCI = 1, normal = 2). We used two-third of our data to train NF system and gathered final output for each case to construct a k-nearest neighbor (KNN) classifier.
Figure 2.

Typical structure for Takagi-Sugeno inference system
This KNN classifier has two classes with centers specified from NF system outputs from training data and will be used as a complementary part in our classification step, so outputs of NF system will be finally labeled using that. We add this part because the outputs of NF system do not exactly match the labeled value and has, at least, two benefits; first, there is no need to use large number of iterations to force NF system's outputs come closer to exact values, and second, it plays the role of a decision making and labeling system without any time consuming or complicated rules. Block diagram of proposed method including classification step is shown in Figure 3.
Figure 3.

Block diagram of proposed method
RESULTS
As stated earlier, feature selection has been performed through a pursuit that described in section 2.3. Tables 4 and 5 show computed correlations between features and desired results that were used in our pursuit to find features vector for 1 s length segments with 50% overlap. They have been color formatted for faster and easier perception. We used 18 cases (9 MCI and 9 normal) for training NF system, but because our dataset was small, we used half-length of them for training and used other half for testing of total samples. Because of implementing KNN complementary classifier, there was no need for large number of iterations, so we set that to 5 and construct KNN based on final outputs of training step. After training phase, we cascaded KNN classifier to trained NF and began testing phase. Feature vectors of all samples are used in testing phase, but classification measure, i.e., accuracy, sensitivity, and specificity are calculated from samples that not proposed in training phase.
Repeating whole procedure for different segmenting length and different overlap showed that 1 s length segments with 50% overlap have the best results so only these results have been shown and discussed.
As can be seen in Tables 4 and 5, some features have good correlations with desired results in one or more channels but not in all, so we should find a method to select features and channels simultaneously. There were two main problems here; first, some of the good features and good channels attenuate each other when applied together. Second and the most important was that channel based methods are not so suitable in real application because they are very sensitive to noises, artifacts, or disconnection on base channels. The best solution for the last problem was using zone-based approach instead of channel-based one. Best averaged features for each zone were calculated, which are shown in Table 6, and it can be seen that some of them are consistent with recent similar work.[7] Table 6 indicates selected features and their classification results for each zone using proposed classifier. Figure 4 shows classification results before and after cascading KNN. To have a comparison, classification also has been done using a single supervised KNN classifier which Table 7 shows its results.
Table 6.
Accuracy, sensitivity, and specificity of proposed method, feature selected for each zone individually

Figure 4.

Classification results for zone individually selected features, before (left) and after cascading k-nearest neighbor (right)
Table 7.
Accuracy, sensitivity, and specificity of k-nearest neighbors method, feature selected for all zone identically

CONCLUSION
In this study, we proposed a reliable and accurate method to discriminate MCI versus normal cases using simple spectral EEG features. The proposed feature selection and classification procedure shows very promising and interesting results using these features. Tables 6 and 7 show that using NF-KNN combination has noticeably better results compared to KNN. Having accuracy above 88% proves the hypothesis that EEG signals can be used in MCI diagnosing and reaching to 100% sensitivity make the proposed method as a suitable tool for large population screening. The highest obstacle in this way is generalization problem due to small sample size of this study, so one of the most important complementary works is to increase the number of cases in both normal and MCI group, and we have it on the run currently. We also are establishing an online biomedical signal and image database to share our data with other researchers.
Another interesting aspect this way is applying well-known feature selection techniques (e.g. PCA, ICA) or using time-frequency transforms such as wavelet[5,34,35] to produce new reliable and powerful discriminative features which can be used as diagnostic biomarkers or even as measuring quantities for the degree of MCI/AD. Sparse modeling of EEG signal in MCI and normal group using overcomplete dictionaries is a new, interesting, and almost intact approach that seems to be practical because spectral changes in EEG signal due to MCI/AD has been proved and evidenced in a wide variety of recent studies. In addition, combining data from EEG signals and brain images provided via one of the standard brain imaging techniques such as positron emission tomography, computed tomography scan, fMRI, and especially MRI provides a motivating and interesting area for future works in MCI diagnosis.
Financial Support and Sponsorship
Nil.
Conflicts of Interest
There are no conflicts of interest.
BIOGRAPHIES

Masoud Kashefpoor is a PhD student in Biomedical Engineering Department, Isfahan University of Medical Sciences, Isfahan, Iran. His main research interest includes brain signal/image processing and neuroscience.
E-mail: kashefpoor@gmail.com.

Hossein Rabbani received the B.Sc. degree in Electrical Engineering (Communications) from Isfahan University of Technology, Isfahan, Iran, in 2000 with the highest honors, and the M.Sc. and Ph.D. degrees in Bioelectrical Engineering in 2002 and 2008, respectively, from Amirkabir University of Technology (Tehran Polytechnic), Tehran, Iran. In 2007 he was with the Department of Electrical and Computer Engineering, Queen's University, Kingston, ON, Canada, as a Visiting Researcher, in 2011 with the University of Iowa, IA, United States, as a Postdoctoral Research Scholar, and in 2013-2014 with Duke University Eye Center as a Postdoctoral Fellow. He is now an Associate Professor in Biomedical Engineering Department and Medical Image & Signal Processing Research Center, Isfahan University of Medical Sciences, Isfahan, Iran. Dr. Rabbani is a Senior Member of IEEE (Signal Processing Society, Engineering in Medicine and Biology Society, Circuits and Systems Society, Computer Society), and Editor in-Chief of Journal of Medical Signals and Sensors. His main research interests are medical image analysis and modeling, statistical (multidimensional) signal processing, sparse transforms, and image restoration, which more than 110 papers and book chapters have been published by him as an author or co-author in these areas.
E-mail: h_rabbani@med.mui.ac.ir

Majid Barekatain received the M.D. degree from Tehran University of Medical Sciences, Tehran, Iran, in 1994 and trained as a resident of psychiatry from 2000 to 2003 in Isfahan University of Medical Sciences, Isfahan, Iran. He has been working as academic staff of Isfahan University of Medical Sciences. He is full professor of psychiatry. He spent his fellowship in neuropsychiatry at Melbourne Neuropsychiatry Center, Melbourne, Australia, in 2007. His main area of research interest includes biomarkers of neurological diseases especially cognitive disorders and epilepsy.
E-mail: barekatain@yahoo.com
REFERENCES
- 1.Prince M, Albanese E, Guerchet M. World Alzheimer Report 2014. 2014 [Google Scholar]
- 2.Alzheimer's Association. 2015 Alzheimer's disease facts and figures. Alzheimers Dement. 2015;11:332–84. doi: 10.1016/j.jalz.2015.02.003. [DOI] [PubMed] [Google Scholar]
- 3.Hebert LE, Weuve J, Scherr PA, Evans DA. Alzheimer disease in the United States (2010-2050) estimated using the 2010 census. Neurology. 2013;80:1778–83. doi: 10.1212/WNL.0b013e31828726f5. [DOI] [PMC free article] [PubMed] [Google Scholar]
- 4.Dauwels J, Vialatte F, Cichocki A. Diagnosis of Alzheimer's disease from EEG signals: Where are we standing? Curr Alzheimer Res. 2010;7:487–505. doi: 10.2174/156720510792231720. [DOI] [PubMed] [Google Scholar]
- 5.Daliri MR. Kernel earth mover's distance for EEG classification. Clin EEG Neurosci. 2013;44:182–7. doi: 10.1177/1550059412471521. [DOI] [PubMed] [Google Scholar]
- 6.Daliri MR. Automated diagnosis of Alzheimer disease using the scale-invariant feature transforms in magnetic resonance images. J Med Syst. 2012;36:995–1000. doi: 10.1007/s10916-011-9738-6. [DOI] [PubMed] [Google Scholar]
- 7.McBride JC, Zhao X, Munro NB, Smith CD, Jicha GA, Hively L, et al. Spectral and complexity analysis of scalp EEG characteristics for mild cognitive impairment and early Alzheimer's disease. Comput Methods Programs Biomed. 2014;114:153–63. doi: 10.1016/j.cmpb.2014.01.019. [DOI] [PMC free article] [PubMed] [Google Scholar]
- 8.Baker M, Akrofi K, Schiffer R, Boyle MW. EEG patterns in mild cognitive impairment (MCI) patients. Open Neuroimag J. 2008;2:52–5. doi: 10.2174/1874440000802010052. [DOI] [PMC free article] [PubMed] [Google Scholar]
- 9.van der Hiele K, Vein AA, Reijntjes RH, Westendorp RG, Bollen EL, van Buchem MA, et al. EEG correlates in the spectrum of cognitive decline. Clin Neurophysiol. 2007;118:1931–9. doi: 10.1016/j.clinph.2007.05.070. [DOI] [PubMed] [Google Scholar]
- 10.Czigler B, Csikós D, Hidasi Z, Anna Gaál Z, Csibri E, Kiss E, et al. Quantitative EEG in early Alzheimer's disease patients – Power spectrum and complexity features. Int J Psychophysiol. 2008;68:75–80. doi: 10.1016/j.ijpsycho.2007.11.002. [DOI] [PubMed] [Google Scholar]
- 11.Gianotti LR, Künig G, Lehmann D, Faber PL, Pascual-Marqui RD, Kochi K, et al. Correlation between disease severity and brain electric LORETA tomography in Alzheimer's disease. Clin Neurophysiol. 2007;118:186–96. doi: 10.1016/j.clinph.2006.09.007. [DOI] [PubMed] [Google Scholar]
- 12.Dauwels J, Srinivasan K, Ramasubba Reddy M, Musha T, Vialatte FB, Latchoumane C, et al. Slowing and loss of complexity in Alzheimer's EEG: Two sides of the same coin? Int J Alzheimers Dis 2011. 2011 doi: 10.4061/2011/539621. 539621. [DOI] [PMC free article] [PubMed] [Google Scholar]
- 13.Latchoumane CFV, Vialatte FB, Jeong J, Cichocki A. Springer; 2009. “EEC Classification of Mild and Severe Alzheimer's Disease using Parallel Factor Analysis Method,” In Advances in Electrical Engineering and Computational Science; pp. 705–715. [Google Scholar]
- 14.Schreiter Gasser U, Rousson V, Hentschel F, Sattel H, Gasser T. Alzheimer disease versus mixed dementias: An EEG perspective. Clin Neurophysiol. 2008;119:2255–9. doi: 10.1016/j.clinph.2008.07.216. [DOI] [PubMed] [Google Scholar]
- 15.Moretti D. Scalp EEG markers in subjects with cognitive impairment and Alzheimer's disease. Int J Psychophysiol. 2012;85:350. [Google Scholar]
- 16.Polikar R, Topalis A, Green D, Kounios J, Clark CM. Comparative multiresolution wavelet analysis of ERP spectral bands using an ensemble of classifiers approach for early diagnosis of Alzheimer's disease. Comput Biol Med. 2007;37:542–58. doi: 10.1016/j.compbiomed.2006.08.012. [DOI] [PMC free article] [PubMed] [Google Scholar]
- 17.Vialatte FB, Maurice M, Cichocki A. Why sparse bump models.? Neuroimage. 2008;41:159. [Google Scholar]
- 18.McBride J, Zhao X, Munro N, Jicha G, Smith C, Jiang Y. Discrimination of Mild Cognitive Impairment and Alzheimer's Disease Using Transfer Entropy Measures of Scalp EEG. J Healthc Eng. 2015;6:55–70. doi: 10.1260/2040-2295.6.1.55. [DOI] [PMC free article] [PubMed] [Google Scholar]
- 19.Hornero R, Abásolo D, Escudero J, Gómez C. Nonlinear analysis of electroencephalogram and magnetoencephalogram recordings in patients with Alzheimer's disease. Philos Trans A Math Phys Eng Sci. 2009;367:317–36. doi: 10.1098/rsta.2008.0197. [DOI] [PubMed] [Google Scholar]
- 20.Abásolo D, Escudero J, Hornero R, Gómez C, Espino P. Approximate entropy and auto mutual information analysis of the electroencephalogram in Alzheimer's disease patients. Med Biol Eng Comput. 2008;46:1019–28. doi: 10.1007/s11517-008-0392-1. [DOI] [PubMed] [Google Scholar]
- 21.Woon WL, Cichocki A, Vialatte F, Musha T. Techniques for early detection of Alzheimer's disease using spontaneous EEG recordings. Physiol Meas. 2007;28:335–47. doi: 10.1088/0967-3334/28/4/001. [DOI] [PubMed] [Google Scholar]
- 22.Zhao P, Van-Eetvelt P, Goh C, Hudson N, Wimalaratna S, Ifeachor E. Characterization of EEGs in Alzheimer's disease using information theoretic methods. Conf Proc IEEE Eng Med Biol Soc. 2007;2007:5127–31. doi: 10.1109/IEMBS.2007.4353494. [DOI] [PubMed] [Google Scholar]
- 23.Jeong J, Gore JC, Peterson BS. Mutual information analysis of the EEG in patients with Alzheimer's disease. Clin Neurophysiol. 2001;112:827–35. doi: 10.1016/s1388-2457(01)00513-2. [DOI] [PubMed] [Google Scholar]
- 24.Adeli H, Ghosh-Dastidar S, Dadmehr N. A spatio-temporal wavelet-chaos methodology for EEG-based diagnosis of Alzheimer's disease. Neurosci Lett. 2008;444:190–4. doi: 10.1016/j.neulet.2008.08.008. [DOI] [PubMed] [Google Scholar]
- 25.McBride JC, Zhao X, Munro NB, Jicha GA, Schmitt FA, Kryscio RJ, et al. Sugihara causality analysis of scalp EEG for detection of early Alzheimer's disease, NeuroImage. Clinical. 2015;7:258–265. doi: 10.1016/j.nicl.2014.12.005. [DOI] [PMC free article] [PubMed] [Google Scholar]
- 26.Dauwels J, Vialatte F, Musha T, Cichocki A. A comparative study of synchrony measures for the early diagnosis of Alzheimer's disease based on EEG. Neuroimage. 2010;49:668–93. doi: 10.1016/j.neuroimage.2009.06.056. [DOI] [PubMed] [Google Scholar]
- 27.Babiloni C, Ferri R, Binetti G, Vecchio F, Frisoni GB, Lanuzza B, et al. Directionality of EEG synchronization in Alzheimer's disease subjects. Neurobiol Aging. 2009;30:93–102. doi: 10.1016/j.neurobiolaging.2007.05.007. [DOI] [PubMed] [Google Scholar]
- 28.Stam CJ, Nolte G, Daffertshofer A. Phase lag index: Assessment of functional connectivity from multi channel EEG and MEG with diminished bias from common sources. Hum Brain Mapp. 2007;28:1178–93. doi: 10.1002/hbm.20346. [DOI] [PMC free article] [PubMed] [Google Scholar]
- 29.Gallego-Jutglà E, Elgendi M, Vialatte F, Solé-Casals J, Cichocki A, Latchoumane C, et al. Engineering in Medicine and Biology Society (EMBC), 2012 Annual International Conference of the IEEE; 2012. Diagnosis of Alzheimer's disease from EEG by means of synchrony measures in optimized frequency bands; pp. 4266–70. [DOI] [PubMed] [Google Scholar]
- 30.van Deursen JA, Vuurman EF, Verhey FR, van Kranen-Mastenbroek VH, Riedel WJ. Increased EEG gamma band activity in Alzheimer's disease and mild cognitive impairment. J Neural Transm (Vienna) 2008;115:1301–11. doi: 10.1007/s00702-008-0083-y. [DOI] [PMC free article] [PubMed] [Google Scholar]
- 31.Barekatain M, Askarpour H, Zahedian F, Walterfang M, Velakoulis D, Maracy MR, et al. The relationship between regional brain volumes and the extent of coronary artery disease in mild cognitive impairment. J Res Med Sci. 2014;19:739. [PMC free article] [PubMed] [Google Scholar]
- 32.Basiratnia R, Amini E, Sharbafchi MR, Maracy M, Barekatain M. Hippocampal volume and hippocampal angle (a more practical marker) in mild cognitive impairment: A case-control magnetic resonance imaging study. Adv Biomed Res. 2015;4:192. doi: 10.4103/2277-9175.166153. [DOI] [PMC free article] [PubMed] [Google Scholar]
- 33.Weimer MF, Liptomn AM. Textbook of Alzheimer Disease and Other Dementias. American Psychiatric Publishing Inc; 2009. [Google Scholar]
- 34.Taghizadeh-Sarabi M, Daliri MR, Niksirat KS. Decoding objects of basic categories from electroencephalographic signals using wavelet transform and support vector machines. Brain topography. 2014;28:33–46. doi: 10.1007/s10548-014-0371-9. [DOI] [PubMed] [Google Scholar]
- 35.Sugeno M. Industrial applications of fuzzy control: North-Holland. 1985 [Google Scholar]