Abstract
Measurement of the stroke volume (SV) and its changes over time can be very helpful for diagnosis of dysfunctions in the blood circulatory system and monitoring their treatments. Impedance cardiography (ICG) is a simple method of measuring the SV based on changes in the instantaneous mean impedance of the thorax. This method has received much attention in the last two decades because it is noninvasive, easy to be used, and applicable for continuous monitoring of SV as well as other hemodynamic parameters. The aim of this study was to develop a low-cost portable ICG system with high accuracy for monitoring SV. The proposed wireless system uses a tetrapolar configuration to measure the impedance of the thorax at 50 kHz. The system consists of carefully designed precise voltage-controlled current source, biopotential recorder, and demodulator. The measured impedance was analyzed on a computer to determine SV. After evaluating the system's electronic performance, its accuracy was assessed by comparing its measurements with the values obtained from Doppler echocardiography (DE) on 5 participants. The implemented ICG system can noninvasively provide a continuous measure of SV. The signal to noise ratio of the system was measured above 50 dB. The experiments revealed that a strong correlation (r = 0.89) exists between the measurements by the developed system and DE (P < 0.05). ICG as the sixth vital sign can be measured simply and reliably by the developed system, but more detailed validation studies should be conducted to evaluate the system performance. There is a good promise to upgrade the system to a commercial version domestically for clinical use in the future.
Keywords: Hemodynamics, impedance cardiography, impedance plethysmography, stroke volume
INTRODUCTION
Stroke volume (SV) is one of the important hemodynamic parameters for assessing the function of the heart as a pump. The accurate measurement of this parameter and its changes in response to physiological or pharmacological stimuli is an important factor in evaluation of the heart mechanical efficiency, especially for hemodynamic management of critically ill patients and evaluation of postoperative treatment progress in the intensive care units.[1,2] In addition, reliable measurement of SV during transient events (e.g., in atrial fibrillation or the presence of extrasystole) could allow quantitative estimation of cardiac performance when it is difficult or even impossible to apply well established, classical methods.[1]
Techniques such as thermodilution, dye dilution, and those based on the Fick principle provide accurate results on the measurement of SV. However, they are invasive, and recently, their use has been increasingly criticized due to uncertain risk to benefit ratio and costs.[3]
Doppler echocardiography (DE) and CO2 breath analysis are widely used as noninvasive techniques for evaluating the SV although their accuracy during exercise remains debatable.[4] Unfortunately, either invasive or noninvasive methods mentioned demand a highly skilled investigator to measure SV and furthermore, are not suitable for long-term continuous monitoring of cardiac activity.[3]
About 70 years ago, Kubicek et al.[5,6] proposed impedance cardiography (ICG) as a noninvasive technique for continuous measurement of SV, cardiac output, and other hemodynamics for aerospace applications. In this method, pulsatile changes in the impedance of thorax are measured, which are mainly caused by the variation of aorta blood volume.[7] Other tissues in the thorax region either have almost constant volume or have at least 2 times higher resistivity than of the blood.[8] ICG is a simple and low-cost technique for noninvasive and continuous measurement of SV, which does not need a highly skilled examiner.
In ICG systems, a high-frequency sine wave current, I, is applied between two electrodes on the thorax and the resulted voltage signal, V, is recorded from the same electrodes (bipolar method) or two other electrodes (tetrapolar method) on the chest. The impedance information, V/I, consists of a baseline component, Z0, and a time varying component, ΔZ. The latter is in the order of 0.5% of the former, and it is challenging to measure it precisely. The first derivative of ΔZ is known as ICG signal [Figure 1]. Many useful hemodynamic parameters can be determined from ICG signal including pre-ejection period (PEP), left ventricular ejection time (LVET), SV, and thoracic fluid content (TFC).
Figure 1.
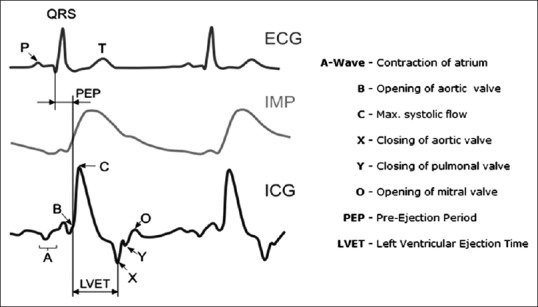
Left: Electrocardiography, impedance variation (ΔZ), and impedance cardiography signals. Right: Waves, notches, and intervals of impedance cardiography signal and corresponding events
Furthermore, ICG method has been used in many research and clinical trial studies, including for explanation of orthostatic syncope mechanism,[9] monitoring the cardiac rehabilitation process,[10] optimization of Atrioventricular (AV) node delay in multi-chamber pacemakers,[11] monitoring of hemodynamics during hemodialysis,[12] and in pharmacological,[13] physiological,[14] and sleep[15] studies.
In the last two decades, many research-based and several commercial ICG systems have been introduced. Nakagawara and Yamakoshi[16] developed a portable polyphysiograph for noninvasive monitoring of hemodynamics based on measurement of electrical admittance and a specific volume-compensation technique. Willemsen et al.[17] have developed an ICG monitoring system named Vrije Universiteit Ambulatory Monitoring System (VU-AMS) to be used in psychophysiological laboratories. Cybulski et al.[18] constructed a Holter-type ICG device called ReoMonitor. Panfili et al.[19] explored the possibility of implementation of a low power wearable system for continuous monitoring of SV based on ICG. Pinheiro et al.[20] developed a contactless ICG system using embedded sensors in a wheelchair backrest. Skin-electrode coupling in this design was capacitive. Ulbrich et al.[21] developed an ICG system with integrated textile electrodes and textile wiring, as well as with portable, miniaturized hardware named IMPACT (IMPedAnce Cardiography Textile) shirt. Weyer et al.[22] developed a wearable multi-frequency ICG system. The impedance phase relative to the applied current also includes information about the hemodynamic parameters and can be used to estimate the SV. This is usually called as “Bioreactance.”[23]
The commercially available devices include BioNex Impedance Cardiograph (Mindware Technologies LTD, USA), BioZ (CardioDynamics, USA), NICO 100C (BIOPAC Systems, USA), Niccomo (Medis, Germany), Hotman System (Hemo Sapiens Medical Inc., USA), IQ2™ (Noninvasive Medical Technologies Inc., USA), NICOM (Cheetah Medical, Inc., Israel), and Task Force® Monitor (CNSystem, Austria).
Several studies have compared the results from ICG technique with other techniques for estimating the SV.[24,25,26,27] In some studies, ICG is suggested as a reliable method to determine both the value of SV and its changes over time or in different conditions.[3,28,29,30] While in the others, the validity of ICG has been approved only for measuring the changes in the value of SV.[31,32,33]
In this paper, development of a simple but carefully designed ICG system for precise, noninvasive, and continuous measurement of SV is described. The system is evaluated by measuring SV in several participants and comparing these measurements with the results from DE. A discussion is also provided on the possible sources of error in SV estimation using ICG method.
METHODS
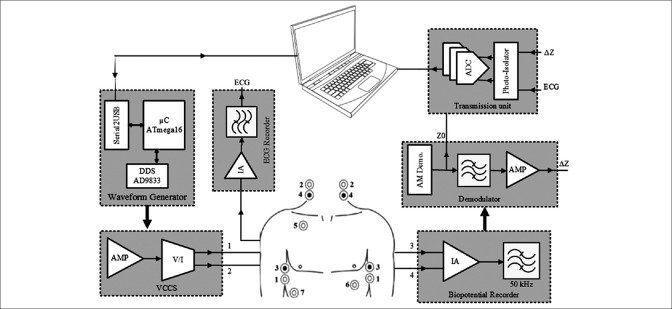
In this study, a portable, high-performance ICG system is developed. The top view of the proposed system is illustrated in Figure 2. It consists of six major blocks.
Figure 2.
Simplified block diagram of the designed impedance cardiography system
Waveform generator (WG) includes the microcontroller and a direct digital synthesizer (DDS)
Precise voltage-controlled current source (VCCS) converts the generated waveform to a current-controlled stimulus
Precise biopotential recorder includes a fast instrumentation amplifier (IA) and a band-pass filter
Demodulator includes a sensitive envelope detector and an antialiasing filter
One-lead electrocardiography (ECG) recording unit
Transmission unit insulates the ICG signal from ECG signal, converts them into digital, and transmits them via a Bluetooth link to a computer or laptop.
For recording the ICG signal, different electrode configurations have been proposed in the literature.[34] In this study, the tetrapolar method for injecting current and recording potential is used as shown in Figure 2.[35] The current source injects a 50 kHz, 2 mA sine wave through electrodes #1 and #2 to the thorax area. Electrodes #3 and #4 pick up the modulated voltage using an IA.
Demodulation unit extracts low-frequency impedance information from the recorded high-frequency signal. A standard ECG lead is also recorded through electrodes #5, #6, and #7 [according to Figure 2] to be used for measuring PEP. After isolation and digitization, the recorded signals are transmitted to a laptop or computer wirelessly using a Bluetooth module, ensuring the safety of using the battery powered system. On the laptop side, a program based on MATLAB software (Mathworks, USA) was developed to process the gathered data and estimate the SV.
Excitation Unit
Since ICG signal is significantly weaker than the raw measured impedance recorded from the body, a very precise and stable excitation source is required to measure the hemodynamics with appropriate accuracy, and this is the most challenging part of the system to be designed. In bioimpedance measurements, a current-controlled excitation is more commonly used than a voltage-controlled one because the safety can be maintained more easily with the current amplitude.[36] Here, the excitation system is comprised two parts, a WG and a Howland VCCS.
Waveform Generator
To generate high-frequency sine wave, different circuits have been used in the literature. This includes the use of voltage controlled oscillator ICs (e.g. XR2206),[37,38] analog WG ICs (e.g. MAX038),[39] and arbitrary WG cards.[40] However, DDS ICs can provide superior performance since the waveform can be generated with the exact parameters as needed.[41,42,43] In this design, AD9833 was programmed for a 50 kHz sine wave output.
Voltage-controlled Current Source
The output impedance of the current source, as well as its frequency response and the voltage compliance, is very important specifications to achieve the desired high performance in impedance measurement.[44] Many types of current source topologies have been proposed in the literature, but the Howland VCCS has remained a popular choice.[43,44,45,46] The Howland circuit can be constructed using a single operational amplifier (op-amp) and a handful of passive components and can supply bi-directional currents to the load.[43,44] A well-designed Howland current pump (HCP) is necessary to meet the performance criteria for bioelectrical impedance (BEI) measuring systems, which includes high and stable output impedance at the high operating frequency used in these systems.
There are various configurations of HCP including basic, standard, bridge (or differential), and HCP with buffered feedback path.[47] According to Mahnam et al.,[47] standard HCP [Figure 3] shows superior performance with less components for BEI measuring systems because in this structure, load is not float, and output impedance and compliance of the circuit are higher.
Figure 3.
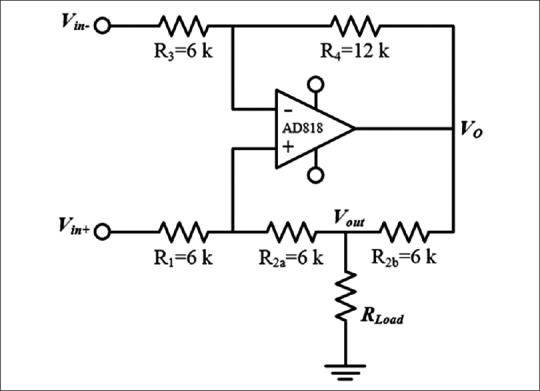
Standard Howland current pump
There is an overall consensus in the use of sinusoidal currents with amplitudes between 1 and 5 mA and frequencies in the range of 20–100 kHz for ICG applications (at these ranges no significant electrical shock hazard exists).[7] The lower current amplitude limit is necessary to obtain sufficient signal to noise ratio (SNR) and at frequencies above 100 kHz, the effect of stray capacitances make the design difficult. On the other hand, the electrode-tissue impedance is reduced at higher frequencies, which helps reducing its disturbing impact on the cardiac signal.[7] In this study, a standard Howland circuit was designed to generate a 4 mA (peak to peak) 50 kHz sinusoidal current [Figure 3].
In practice, two independent effects can significantly degrade the ideal performance of the HCP: Resistors tolerance that causes an imbalance between the positive and negative feedback paths and the op-amp's finite open-loop gain. Eq. 1 models these effects on the output impedance of HCP:

where T is the resistors tolerance and AOL (jω) is the op-amp's open-loop gain.[47]
The parasitic or stray capacitances at the output of the current pump also reduces the effective output impedance of the pump. Appropriate design of the PCB was tried to reduce this effect.
Also by assuming Vin− = 0, the maximum load for a constant output current can be determined by:

where Vo(max) is the maximum output voltage of the op-amp. Note that RLoad(max) is improved for Vin−>0.[47]
According to Eq. 1, Zout can be improved by using tightly matched resistors, large R1/(R1+R2), large R2b, large resistors in the design, and high AOL (jω). Thus, in this design, R1/(R1+R2) was considered 1/3, and R2a and R2b were 6 kΩ with 0.1% tolerance. AD818 op-amp was used in this design with 70 dB open loop gain at 50 kHz. By these values, Eq. 1 predicts Zout = 1.107 MΩ.
The supply voltage of the circuit was set to ±15 V. For an output current amplitude of 2 mA, the sine wave voltage generated by DDS was amplified to 12 Vp-p using an inverting amplifier based on AD844 and then was fed to negative input of HCP while the positive input of HCP was grounded. According to Eq. 2 by these parameters, the RLoad(max) is 660 Ω.
The designed HCP was carefully constructed on a double-layer printed circuit board. It was tried to keep the length of positive and negative feedback traces short and the same, so that the trace impedance become much smaller than the resistor tolerances (0.1% precision). The symmetrical layout was used to achieve excellent matching. The generated voltage by DDS was fed to HCP through an inverting amplifier (AD844). The output impedance of the AD844 (0.2 Ω at 50 KHz) was noted to be small enough to maintain the matching between positive and negative feedback loops. These considerations helped to achieve a practically high output impedance and, therefore, precise measurements.
The other factor that was considered in the design of HCP was that in long-term operation, the total charge injected to the body must be zero which means that the DC error of the current source must be as small as possible. To achieve this, a large R2b was used, and the resistors for negative and positive feedback loops were set equal.[47] Further, the input bias current and offset voltage of the op-amp was small.
Voltage Measurement
The safety standards for the patient necessitate that the applied current as the stimulus for measuring the thorax impedance is kept as low as possible. This results in a very low response voltage on the tissue and necessitates very precise and stable measurement block. IAs are usually used for biopotential measurements. However, the measured potential here is at 50 kHz which requires a very high slew rate for IA. Its bandwidth must also be at least one decade higher than 50 kHz for avoiding signal attenuation. The other factor is the input impedance of the IA, which must be significantly higher than the electrode-tissue impedance.
INA111 is a high speed, FET-input IA offering excellent performance at kHz frequencies.[48] The high CMRR above 60 dB at 50 kHz minimizes common mode interferences and eliminates the effect of any DC residual component that may arise. To avoid DC drift, low-frequency noise, and degradation of the SNR and CMRR, the output of INA111 was fed to a band-pass filter with a center frequency of 50 kHz. This filter consists of a 40 kHz second order Butterworth high pass filter and a 60 kHz fourth order Chebyshev1 low pass filter. These filters were designed in FilterPro (Texas Instrument, USA) software.
Demodulator and Antialiasing Filter
A precise AM demodulator (or peak detector) is needed to extract the ICG signal that is an amplitude-modulated signal on the 50 kHz carrier. The extracted signal consists of two important components: The constant component that reflects the base thoracic impedance (Z0 = V0/Iout, where V0 is the constant component of the demodulated voltage and Iout is the amplitude of HCP output current), and the time varying component that reflects changes in the volume of blood mainly in the aorta (ΔZ = ΔV/Iout, where ΔV is the time varying component of the demodulated voltage). The typical ranges of Z0 and ΔZ are 20–35 Ω and 0.1–0.4 Ω, respectively.[7]
Figure 4 shows the schematic of the envelope detector used in this design. The circuit is a precise half-wave rectifier and an RC low pass filter. Since the frequency of Vin is high (50 kHz), diode D must be a high-speed diode. To remove high-frequency components and maintain the desired envelope, Tcarrier<<τ=RC<Tmin, heart (Tmin, heart was considered 300 ms, corresponding to a maximum heart rate of 180 beat/s).
Figure 4.
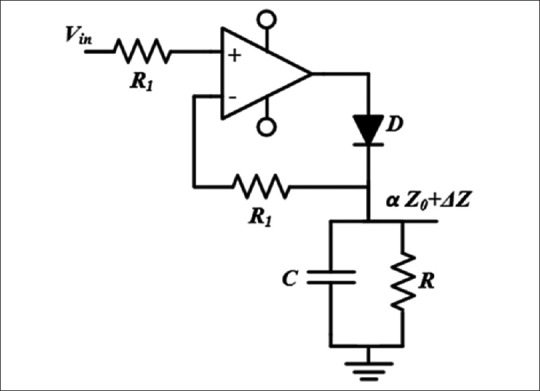
Schematic of the envelope detector used in this design
The output of the envelope detector is a signal proportional to Z0+ΔZ. The Z0 component in this signal is about 200 times greater than ΔZ which makes it difficult for ΔZ to be extracted and amplified. This was accomplished by a 0.1 Hz second order Butterworth high-pass filter. Then, a 20 Hz fourth-order Butterworth low-pass filter was used for antialiasing. With this filter, it was insured that the error due to aliasing is less than −87 db for the sampling rate of 500 samples. Both Z and ΔZ signals are then digitized and sent to the transmission unit.
The derivate of ΔZ is known as ICG signal [dZ/dt, Figure 1]. To estimate the SV, Z0 and the maximum of ICG signal (point C) are required.
As mentioned, ΔZ amplitude is typically in the range of 0.5% of Z0 (20 log 200 = 46 dB); therefore, the excitation system and the recording blocks must have SNRs much higher than 46 dB to allow detection of this signal.
Electrocardiography Recording
To calculate some hemodynamic intervals such as PEP [Figure 1], it is necessary to record the electrocardiogram simultaneously with ICG.[7] The ECG electrodes are placed on the chest as shown in Figure 2 (electrodes #5, #6, and #7) and the signal is recorded by AD620 IA followed by a band-pass filter.
Transmission Unit
In the transmission unit, the ICG signal is isolated from ECG to avoid interference between them. This was performed by IL300 IC which is a linear photo-isolator with high gain stability and wide bandwidth [Figure 5].[49] Then, both signals are digitized and sent to a computer using a Bluetooth module.
Figure 5.
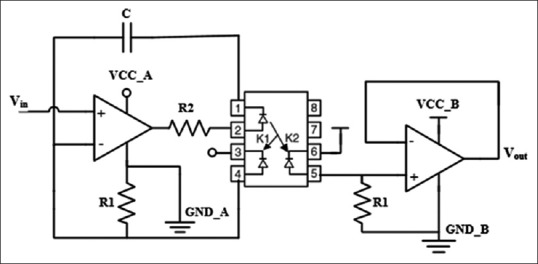
Isolation circuit based on IL300 to avoid interference of electrocardiography signal on the impedance cardiography signal
The ECG, impedance variation (ΔZ), and value of the basic thoracic impedance (Z0) are digitized using 10 bit A/D modules of ATmega16 microcontroller at the sampling frequency of 500 samples. This results in an SNRQ = 6 × 10 − 1.25 = 58.75 dB due to the quantization error. The data are then transmitted to a laptop wirelessly at the baud rate of 115,200 bps.
Processing
The received data at the computer were processed offline in MATLAB software to calculate hemodynamic parameters. The preprocessing stage consists of moving average filters for smoothing Z0, ΔZ, and ECG signals [Figure 7]. The following equation was used to obtain the derivate of ΔZ signal:
Figure 7.
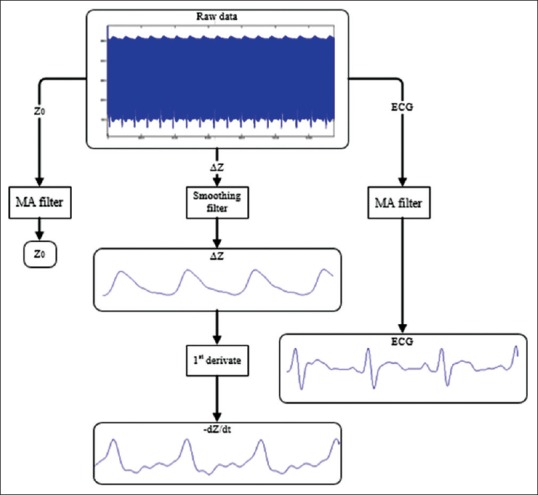
Simplified diagram of data preprocessing

which can provide a very good estimate of ideal derivative in the DC to 30 Hz frequency range.[50] Figure 7 shows a simplified diagram of the preprocessing steps.
Stroke Volume Calculation
To compute SV, Kubicek formula[6] was used which is the most commonly adopted relationship in the literature,

where ρ is the resistivity of blood in Ω.cm, L is the distance between the electrodes #3 and #4 in cm, Z0 is the basic impedance in Ω, dZ/dtmax is the maximum of ICG signal in Ω/s, and LVET is the left ventricular ejection time in seconds. As seen in Figure 1, detection of C wave is necessary to determine dZ/dtmax, and B and X waves to determine LVET. C wave is the peak of the ICG curve and X wave is the first minimum after C wave. A simple algorithm was used to determine the maximum of the ICG signal at certain intervals and the minimum after for C and X waves. Detection of the B wave is more difficult, but it is considered in the ascending part of the ICG curve before the C wave, where the signal crosses the baseline.[7] The SV value was calculated in each beat of the recorded ICG, and then the average on five beats was calculated.
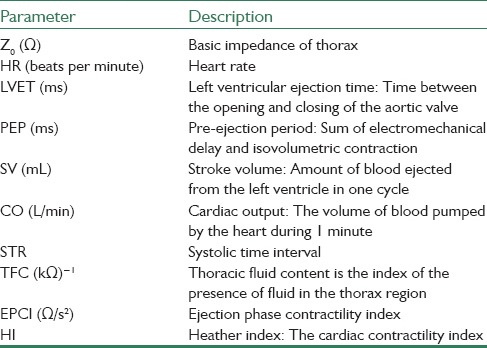
The proposed system can also be used to compute and display parameters that are listed in Table 1.[7]
Table 1.
Hemodynamic parameters that can be computed by the proposed system
Experiments
Five subjects were enrolled in this study (two males and three females, in the range of 25–65 years old). The experiment procedure was explained clearly to all participants, and the informed consent was obtained before their participation. Each subject took supine position, and electrodes were placed on the body according to Figure 2. Disposable ECG electrodes with solid gel were used for this purpose in accordance with previous studies.[51] For each subject, the ICG signal was recorded for 30 s and then immediately, absolute value of SV was measured by an expert physician using DE.
RESULTS
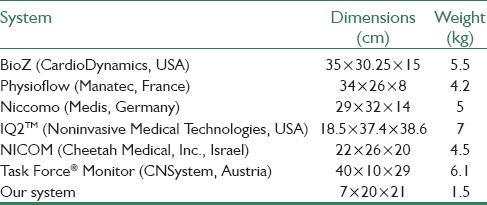
The implemented system [Figure 6] is a portable battery-based system 7 cm × 20 cm × 21 cm in size and 1.5 kg in weight which can operate for 9 h continuously. Table 2 compares the dimension and weight of the system designed in this study with some commercial systems.
Figure 6.
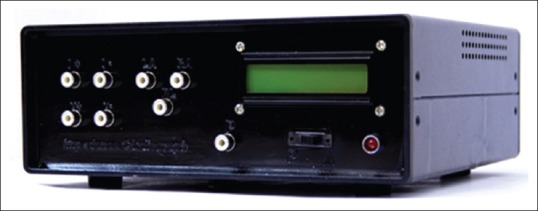
The implemented system used for its basic performance evaluation
Table 2.
Comparison of dimension and weight of the proposed system with several other impedance cardiography systems
Basic performance evaluation
In this section, the performance of the designed current pump and the biopotential recorder, as the most important parts of the system, is presented. Then, the result from assessment of system's accuracy is reported, and its measurements are compared with the values obtained from DE on 5 patients.
Current Pump
The output impedance of the designed HCP was measured in practice using drop technique[47] with a GDS-2304A digital storage oscilloscope. Table 3 shows the measured output impedance in practice at 50 kHz, compared with Eq. 1. The difference is mainly due to the stray capacitances at the output of HCP, the input capacitance of the measurement device probe, and the limited resolution of the available measurement devices. This difference is equal to 3.5 pF stray capacitance. About 1.7 pF of this capacitance can be considered the input capacitance of the measuring probe while the rest can be due to the tracks on the board.
Table 3.
Comparison of the output impedance of Howland Current Pump measured in practice, in theory with or without considering the stray capacitances

With this output impedance, the error is limited to 0.08% in obtaining the tissue impedance (caused by finite output impedance of the current pump) and to 0.16% in obtaining the tissue impedance variations.[51]
The maximum load without distortion, RLoad(max) was 670 Ω in practice (which is close to the predicted value of 660 Ω as obtained from Eq. 2) and met the required criteria of >500 Ω.[51] The SNR of the designed HCP was measured 50 dB using the FFT mode of oscilloscope while the current pump was driving a 50 Ω load.
Biopotential Recorder
The measured SNR of biopotential recorder was 57 dB at 50 kHz. Lower cut-off frequency and higher cut-off frequency of biopotential recorder were 19 kHz and 67 kHz, respectively. The overall gain of this block was 11, and the slew rate was 422 V/mS.
Experiments
Figure 8 shows the recorded signals by the implemented impedance cardiograph for one subject.
Figure 8.
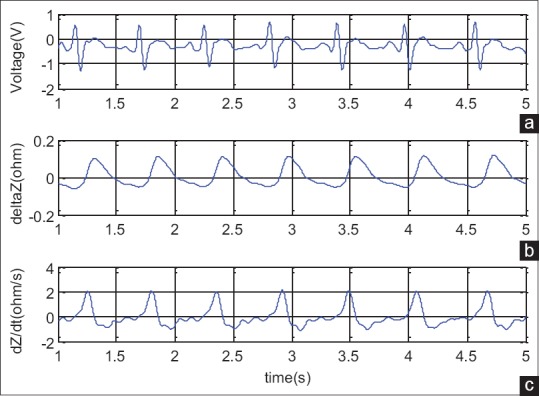
Signals recorded by the implemented impedance cardiography for a subject. (a) Electrocardiography, (b) impedance variation, (c) impedance cardiography
The values of SV measured by ICG and DE methods for five patients are illustrated in Table 4. Pearson correlation coefficient for data presented in Table 4 was calculated by SPSS software (IBM Corporation, USA). There was no significant difference between these two sets of data (paired t-test, 95% confidence interval was (−8.26, 10.10), t = 0.28, P = 0.795, df = 4). In addition, the Pearson correlation coefficient was high (r = 0.89, P < 0.05).
Table 4.
Stroke volume values obtained from Doppler echocardiography and impedance cardiography measurement by the developed system. The latter is an average from five heart beats
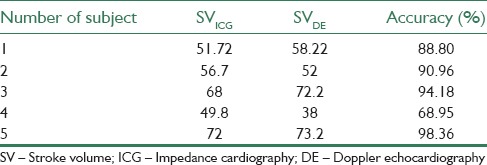
The accuracy, defined as (1–|(SVDE–SVICG)/SVDE|) × 100, was calculated for each subject and is presented in Table 4. The average accuracy was 88.25 ± 11.37%.
As seen in Figure 9, SVs obtained from ICG measurements appropriately track the values by DE method except for subject number 4. In next section, possible sources of error seen between these methods are discussed.
Figure 9.
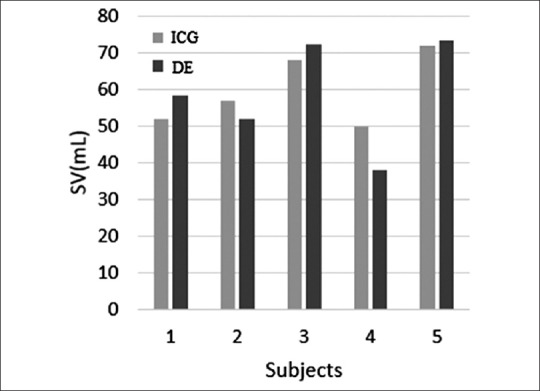
Comparison of the measured stroke volume values from impedance cardiography and Doppler echocardiography methods demonstrate a close correlation between values in five examined subjects
CONCLUSION
After ECG, blood pressure, respiration, temperature, and noninvasively measured saturated oxygen, ICG is considered the sixth vital sign which can have an effective role in the prevention, prognosis, and diagnosis of cardiovascular diseases.[52]
The major goal of this study was to develop a precise and convenient system for monitoring the ICG signal. Different blocks of the system were designed based on the required SNR. The current pump was specially designed for very high output impedance at the high working frequency. The final portable battery-based impedance cardiography system can operate for 9 h continuously with each charge. The prototype system was tested on five subjects. The average accuracy for SV extracted from ICG method in comparison with SV extracted from DE method was 88.25 ±11.37%. There was no statistically significant difference between SV values obtained by the two methods.
There are some known sources of error in the measurement of ICG signal and calculation of SV from that. According to Eq. 4, the SV is directly proportional to LVET and dZ/dtmax. The correct detection of B, C, and X points [Figure 1] affects the accuracy of LVET and dZ/dtmax in turn. Noisy, distorted, or abnormal signals in some disease conditions (such as in patients with pulmonary edema)[53] cause errors in detection of characteristic points of ICG which results in estimation of significantly lower SV values. Detecting the position of the B point in the ICG signal is sometimes difficult because the characteristic upstroke that serves as a marker of this point is not always apparent. Lozano et al. have suggested a reliable method for B point identification based on relation between R-B interval (R wave of ECG and B wave of ICG) and R-C interval[54] that can be used for more reliable identification of B point in future studies.
Moreover, the value of blood resistivity is considered constant in this study equal to 145 Ω.cm whereas the actual value is in the range of 130–150 Ω.cm. The exact value can be determined as the second order or exponential function of hematocrit.[7] Apart from errors due to indirect measurement and the method's technical limitations, other sources of errors are associated with the methodology employed, including the simplified model of the chest, the disturbing influence of breathing, poor electrode-tissue contact, and error in measurement of distance between electrodes. A detailed study is required on these factors to eliminate or compensate their effects on the measurement. On the other hand, hemodynamic parameters are usually stated as indexes by normalizing their values with the body surface area of the patient. It is necessary to obtain more information from patients in future studies including the height, weight, and body mass index to better evaluate and compare the performance of the developed system.
Hemodynamic parameters that can be derived from ICG method are not limited to SV and cardiac output. Other parameters including LVET, PEP, TFC, systemic vascular resistance, maximum aortic blood velocity, and left cardiac work can be extracted from ICG signal. Regarding this vast potential of ICG to provide estimation of many different hemodynamic parameters, it is recommended to perform strong research studies to enhance the precision of the method using more complicated models of the thorax. Such methods can be established as a promising technology for decision making in clinical management, adopting the treatment method, and estimating the prognosis of many patients with cardiovascular disorders.
Financial Support and Sponsorship
Nil.
Conflicts of Interest
There are no conflicts of interest.
BIOGRAPHIES

Hassan Yazdanian received his B.Sc. degree in Electrical Engineering and M.Sc. degree in Biomedical Engineering from Birjand University and Isfahan University, Iran, in 2011 and 2014, respectively. He is currently a PhD candidate in Department of Biomedical Engineering at K.N.Toosi University of Technology, Tehran, Iran. His research interests include medical instrumentation and bioimpedance.
E-mail: hassanyazdanian@gmail.com

Amin Mahnam is assistant professor of Biomedical Engineering at the University of Isfahan, Isfahan, Iran, since 2008. His field of research includes neural engineering, and human and brain computer interfaces.
E-mail: mahnam@eng.ui.ac.ir

Mehdi Edrisi is currently an assistant professor at the Electrical Engineering Department, University of Isfahan, Iran. He received his B.S. from Isfahan University of Technology, M.Sc. from University of New South Wales, Australia and PhD form University of South Australia. He has been in Biomedical Engineering department from 2000 to 2012. He served as the chairman of IT Department for seven years. He has been the Chair of the Intelligent Systems Research Group at the University of Isfahan since 2012. He is now the head of Processing and Intelligent Systems Research Center. His main research fields are robotics and fuzzy control.
E-mail: edrisi@eng.ui.ac.ir

Morteza Abdar Esfahani received his MD degree and Cardiology board from Tehran University of Medical Sciences. He passed 3D Echocardiography fellowship from Rene Descartes University in France. He has published more than 65 papers and is now full professor of medicine at Isfahan University of medical sciences.
E-mail: abdariranian@yahoo.com
REFERENCES
- 1.Cybulski G, Strasz A, Niewiadomski W, Gasiorowska A. Impedance cardiography: Recent advancements. Cardiol J. 2012;19:550–6. doi: 10.5603/cj.2012.0104. [DOI] [PubMed] [Google Scholar]
- 2.Konings MK, Goovaerts HG, Roosendaal MR, Rienks R, Koevoets FM, Bleys RL, et al. A new electric method for non-invasive continuous monitoring of stroke volume and ventricular volume-time curves. Biomed Eng Online. 2012;11:51. doi: 10.1186/1475-925X-11-51. [DOI] [PMC free article] [PubMed] [Google Scholar]
- 3.Scherhag A, Kaden JJ, Kentschke E, Sueselbeck T, Borggrefe M. Comparison of impedance cardiography and thermodilution-derived measurements of stroke volume and cardiac output at rest and during exercise testing. Cardiovasc Drugs Ther. 2005;19:141–7. doi: 10.1007/s10557-005-1048-0. [DOI] [PubMed] [Google Scholar]
- 4.Charloux A, Lonsdorfer-Wolf E, Richard R, Lampert E, Oswald-Mammosser M, Mettauer B, et al. A new impedance cardiograph device for the non-invasive evaluation of cardiac output at rest and during exercise: Comparison with the “direct” Fick method. Eur J Appl Physiol. 2000;82:313–20. doi: 10.1007/s004210000226. [DOI] [PubMed] [Google Scholar]
- 5.Kubicek WG, Karnegis JN, Patterson RP, Witsoe DA, Mattson RH. Development and evaluation of an impedance cardiac output system. Aerosp Med. 1966;37:1208–12. [PubMed] [Google Scholar]
- 6.Kubicek W, Patterson R, Witsoe D. Impedance cardiography as a noninvasive method of monitoring cardiac function and other parameters of the cardiovascular system. Ann N Y Acad Sci. 1970;170:724–32. [Google Scholar]
- 7.Cybulski G. Ambulatory Impedance Cardiography. Heidelberg: Springer; 2011. [Google Scholar]
- 8.Geddes LA, Baker LE. The specific resistance of biological material – A compendium of data for the biomedical engineer and physiologist. Med Biol Eng. 1967;5:271–93. doi: 10.1007/BF02474537. [DOI] [PubMed] [Google Scholar]
- 9.Tahvanainen A, Koskela J, Leskinen M, Ilveskoski E, Nordhausen K, Kähönen M, et al. Reduced systemic vascular resistance in healthy volunteers with presyncopal symptoms during a nitrate-stimulated tilt-table test. Br J Clin Pharmacol. 2011;71:41–51. doi: 10.1111/j.1365-2125.2010.03794.x. [DOI] [PMC free article] [PubMed] [Google Scholar]
- 10.Gielerak G, Piotrowicz E, Krzesinski P, Kowal J, Grzeda M, Piotrowicz R. The effects of cardiac rehabilitation on haemodynamic parameters measured by impedance cardiography in patients with heart failure. Kardiol Pol. 2011;69:309–17. [PubMed] [Google Scholar]
- 11.Braun MU, Schnabel A, Rauwolf T, Schulze M, Strasser RH. Impedance cardiography as a noninvasive technique for atrioventricular interval optimization in cardiac resynchronization therapy. J Interv Card Electrophysiol. 2005;13:223–9. doi: 10.1007/s10840-005-2361-z. [DOI] [PubMed] [Google Scholar]
- 12.Wynne JL, Ovadje LO, Akridge CM, Sheppard SW, Vogel RL, Van de Water JM. Impedance cardiography: A potential monitor for hemodialysis. J Surg Res. 2006;133:55–60. doi: 10.1016/j.jss.2006.03.004. [DOI] [PubMed] [Google Scholar]
- 13.Scherhag AW, Pfleger S, de Mey C, Schreckenberger AB, Staedt U, Heene DL. Continuous measurement of hemodynamic alterations during pharmacologic cardiovascular stress using automated impedance cardiography. J Clin Pharmacol. 1997;37(1 Suppl):21S–8S. doi: 10.1177/009127009703700118. [DOI] [PubMed] [Google Scholar]
- 14.Tank J, Baevsky RM, Weck M. Hemodynamic regulation during postural tilt assessed by heart rate- and blood-pressure variability combined with impedance cardiography. Wien Med Wochenschr. 1995;145:616–25. [PubMed] [Google Scholar]
- 15.Balachandran JS, Bakker JP, Rahangdale S, Yim-Yeh S, Mietus JE, Goldberger AL, et al. Effect of mild, asymptomatic obstructive sleep apnea on daytime heart rate variability and impedance cardiography measurements. Am J Cardiol. 2012;109:140–5. doi: 10.1016/j.amjcard.2011.07.071. [DOI] [PMC free article] [PubMed] [Google Scholar]
- 16.Nakagawara M, Yamakoshi K. A portable instrument for non-invasive monitoring of beat-by-beat cardiovascular haemodynamic parameters based on the volume-compensation and electrical-admittance method. Med Biol Eng Comput. 2000;38:17–25. doi: 10.1007/BF02344683. [DOI] [PubMed] [Google Scholar]
- 17.Willemsen GH, De Geus EJ, Klaver CH, Van Doornen LJ, Carroll D. Ambulatory monitoring of the impedance cardiogram. Psychophysiology. 1996;33:184–93. doi: 10.1111/j.1469-8986.1996.tb02122.x. [DOI] [PubMed] [Google Scholar]
- 18.Cybulski G, Kozluk E, Michalak E, Niewiadomski W, Piatkowska A. Holter-type impedance cardiography device. A system for continuous and non-invasive monitoring of cardiac haemodynamics. Kardiol Pol. 2004;61:138–46. [PubMed] [Google Scholar]
- 19.Panfili G, Piccini L, Maggi L, Parini S, Andreoni G. A wearable device for continuous monitoring of heart mechanical function based on impedance cardiography. Conf Proc IEEE Eng Med Biol Soc. 2006;1:5968–71. doi: 10.1109/IEMBS.2006.260250. [DOI] [PubMed] [Google Scholar]
- 20.Pinheiro E, Postolache O, Girao P. Contactless impedance cardiography using embedded sensors. Meas Sci Rev. 2013;13:157–64. [Google Scholar]
- 21.Ulbrich M, Mühlsteff J, Sipilä A, Kamppi M, Koskela A, Myry M, et al. The IMPACT shirt: Textile integrated and portable impedance cardiography. Physiol Meas. 2014;35:1181–96. doi: 10.1088/0967-3334/35/6/1181. [DOI] [PubMed] [Google Scholar]
- 22.Weyer S, Menden T, Leicht L, Leonhardt S, Wartzek T. Development of a wearable multi-frequency impedance cardiography device. J Med Eng Technol. 2015;39:131–7. doi: 10.3109/03091902.2014.990161. [DOI] [PubMed] [Google Scholar]
- 23.Squara P. Berlin, Heidelberg: Springer; 2008. Bioreactance: A new method for non-invasive cardiac output monitoring. Yearbook of Intensive Care and Emergency Medicine; pp. 619–30. [Google Scholar]
- 24.Gujjar AR, Muralidhar K, Banakal S, Gupta R, Sathyaprabha TN, Jairaj PS. Non-invasive cardiac output by transthoracic electrical bioimpedence in post-cardiac surgery patients: Comparison with thermodilution method. J Clin Monit Comput. 2008;22:175–80. doi: 10.1007/s10877-008-9119-y. [DOI] [PubMed] [Google Scholar]
- 25.McFetridge-Durdle JA, Routledge FS, Parry MJ, Dean CR, Tucker B. Ambulatory impedance cardiography in hypertension: A validation study. Eur J Cardiovasc Nurs. 2008;7:204–13. doi: 10.1016/j.ejcnurse.2007.10.003. [DOI] [PubMed] [Google Scholar]
- 26.Burlingame J, Ohana P, Aaronoff M, Seto T. Noninvasive cardiac monitoring in pregnancy: Impedance cardiography versus echocardiography. J Perinatol. 2013;33:675–80. doi: 10.1038/jp.2013.35. [DOI] [PMC free article] [PubMed] [Google Scholar]
- 27.Kim JY, Kim BR, Lee KH, Kim KW, Kim JH, Lee SI, et al. Comparison of cardiac output derived from FloTrac™/Vigileo™ and impedance cardiography during major abdominal surgery. J Int Med Res. 2013;41:1342–9. doi: 10.1177/0300060513487649. [DOI] [PubMed] [Google Scholar]
- 28.Yung GL, Fedullo PF, Kinninger K, Johnson W, Channick RN. Comparison of impedance cardiography to direct Fick and thermodilution cardiac output determination in pulmonary arterial hypertension. Congest Heart Fail. 2004;10(2 Suppl 2):7–10. doi: 10.1111/j.1527-5299.2004.03406.x. [DOI] [PubMed] [Google Scholar]
- 29.Brown CV, Shoemaker WC, Wo CC, Chan L, Demetriades D. Is noninvasive hemodynamic monitoring appropriate for the elderly critically injured patient? J Trauma. 2005;58:102–7. doi: 10.1097/01.ta.0000105990.05074.4a. [DOI] [PubMed] [Google Scholar]
- 30.Schmidt C, Theilmeier G, Van Aken H, Korsmeier P, Wirtz SP, Berendes E, et al. Comparison of electrical velocimetry and transoesophageal Doppler echocardiography for measuring stroke volume and cardiac output. Br J Anaesth. 2005;95:603–10. doi: 10.1093/bja/aei224. [DOI] [PubMed] [Google Scholar]
- 31.Boer P, Roos JC, Geyskes GG, Mees EJ. Measurement of cardiac output by impedance cardiography under various conditions. Am J Physiol. 1979;237:H491–6. doi: 10.1152/ajpheart.1979.237.4.H491. [DOI] [PubMed] [Google Scholar]
- 32.Milsom I, Sivertsson R, Biber B, Olsson T. Measurement of stroke volume with impedance cardiography. Clin Physiol. 1982;2:409–17. doi: 10.1111/j.1475-097x.1982.tb00047.x. [DOI] [PubMed] [Google Scholar]
- 33.Fellahi JL, Fischer MO. Electrical bioimpedance cardiography: An old technology with new hopes for the future. J Cardiothorac Vasc Anesth. 2014;28:755–60. doi: 10.1053/j.jvca.2013.12.026. [DOI] [PubMed] [Google Scholar]
- 34.Woltjer HH, Bogaard HJ, de Vries PM. The technique of impedance cardiography. Eur Heart J. 1997;18:1396–403. doi: 10.1093/oxfordjournals.eurheartj.a015464. [DOI] [PubMed] [Google Scholar]
- 35.Sramek BB, editor . Tokyo, Japan: Fifth International Conference on Electrical Bioimpedance; 1981. Noninvasive Technique for Measurement of Cardiac Output by Means of Electrical Impedance. [Google Scholar]
- 36.Webster J. Medical Instrumentation: Application and Design. Hoboken, New Jersey: Wiley; 2009. [Google Scholar]
- 37.Khalighi M, Vahdat BV, Mortazavi M, Mikaeili M. Design and implementation of precise hardware for electrical impedance tomography (eit)*. Iran J Sci Technol Trans Electr Eng. 2014;38:1. [Google Scholar]
- 38.Engineering in Medicine and Biology Society. 26th Annual International Conference of the IEEE. 2004;1:2386–9. doi: 10.1109/IEMBS.2004.1403691. [DOI] [PubMed] [Google Scholar]
- 39.Casas O, Rosell J, Bragós R, Lozano A, Riu PJ. A parallel broadband real-time system for electrical impedance tomography. Physiol Meas. 1996;17(Suppl 4A):A1–6. doi: 10.1088/0967-3334/17/4a/002. [DOI] [PubMed] [Google Scholar]
- 40.Sanchez B, Louarroudi E, Jorge E, Cinca J, Bragos R, Pintelon R. A new measuring and identification approach for time-varying bioimpedance using multisine electrical impedance spectroscopy. Physiol Meas. 2013;34:339–57. doi: 10.1088/0967-3334/34/3/339. [DOI] [PubMed] [Google Scholar]
- 41.Shi Q, Heinig A, Kanoun O. Design and evaluation of a portable device for the measurement of bio-impedance cardiography. International Workshop on Impedance Spectroscopy. Chemnitz. 2011 [Google Scholar]
- 42.Dastjerdi HM, Soltanzadeh R, Rabbani H. Designing and implementing bioimpedance spectroscopy device by measuring impedance in a mouse tissue. J Med Signals Sens. 2013;3:187–94. [PMC free article] [PubMed] [Google Scholar]
- 43.Tucker AS, Fox RM, Sadleir RJ. Biocompatible, high precision, wideband, improved Howland current source with lead-lag compensation. IEEE Trans Biomed Circuits Syst. 2013;7:63–70. doi: 10.1109/TBCAS.2012.2199114. [DOI] [PubMed] [Google Scholar]
- 44.Yazdanian H, Mosayebi Samani M, Mahanm A, editors. Biomedical Engineering (ICBME) 2013 20th Iranian Conference on IEEE; 2013. Characteristics of the Howland Current Source for Bioelectric Impedance Measurements Systems. [Google Scholar]
- 45.Liu J, Qiao X, Wang M, Zhang W, Li G, Lin L. The differential Howland current source with high signal to noise ratio for bioimpedance measurement system. Rev Sci Instrum. 2014;85:055111. doi: 10.1063/1.4878255. [DOI] [PubMed] [Google Scholar]
- 46.Bouchaala D, Kanoun O, Derbel N. High accurate and wideband current excitation for bioimpedance health monitoring systems. Measurement. 2016;79:339–348. [Google Scholar]
- 47.Mahnam A, Yazdanian H, Samani MM. Comprehensive study of Howland circuit with non-ideal components to design high performance current pumps. Measurement. 2016;82:94–104. [Google Scholar]
- 48.High Speed FET-Input Instrumentation Amplifier. INA111. Burr-Brown Corporation. Mar. 1998 [Google Scholar]
- 49.Linear Optocoupler, High Gain Stability, Wide Bandwidth. IL300. Rev. 1.8. Vishay Semiconductors. Jun. 2014 [Google Scholar]
- 50.Pan J, Tompkins WJ. A real-time QRS detection algorithm. IEEE Trans Biomed Eng. 1985;32:230–6. doi: 10.1109/TBME.1985.325532. [DOI] [PubMed] [Google Scholar]
- 51.Swanson DK, Webster JG. Errors in four-electrode impedance plethysmography. Med Biol Eng Comput. 1983;21:674–80. doi: 10.1007/BF02464029. [DOI] [PubMed] [Google Scholar]
- 52.Cybulski GP. Dynamic Impedance Cardiography-the system and its applications. Polish Soc Med Phys. 2005;11:127–209. [Google Scholar]
- 53.Marik PE. Noninvasive cardiac output monitors: A state-of the-art review. J Cardiothorac Vasc Anesth. 2013;27:121–34. doi: 10.1053/j.jvca.2012.03.022. [DOI] [PubMed] [Google Scholar]
- 54.Lozano DL, Norman G, Knox D, Wood BL, Miller BD, Emery CF, et al. Where to B in dZ/dt. Psychophysiology. 2007;44:113–9. doi: 10.1111/j.1469-8986.2006.00468.x. [DOI] [PubMed] [Google Scholar]


