

Abstract
Aim:
The aim was to develop a novel excipient from Pleurotus tuber-regium (PT)-cornstarch (CS) mixture and evaluate its multifunctional characteristics in tablet formulation.
Materials and Methods:
Composites were generated from dephytochemicalized PT and CS combined at 1:1 to 4:1 ratios and pregelatinized in a hot water bath at 65°C ± 2°C for 5 min. The paste was dried, pulverized, and screened through 150-μm sieve. PT-CS physical mixtures were prepared and their characteristics/functionalities in tableting chloroquine were compared to those of composites and microcrystalline cellulose (Avicel®).
Results:
PT ash value was 0.40 ± 0.09% and heavy metal contents were below official limits. PT's differential scanning calorimetric (DSC) thermogram depicted broad melting peak at 329.5°C; this peak was attenuated by the presence of CS. Fourier transform infrared (FTIR) spectra predicted compatibility between PT and CS. Composites consolidated better and also flowed better than physical mixtures and Avicel®. Increasing PT content enhanced the excipients’ swellabilities, and composites possessed significantly (P < 0.05) better swelling indices than Avicel®. The composites underwent fragmentation before plastic deformation with yield pressures significantly (P < 0.05) higher than those of the physical mixtures, which exhibited only plastic deformation. The mechanical properties of chloroquine tablets were acceptable, with the 1:4 (PT:CS) imparting the best properties. Mean disintegration times for the commercial comparator and Avicel® -containing tablets were significantly higher (P < 0.05) than those of composites. Drug release from tablets formulated with composites were similar to the commercial comparator, but significantly higher (P < 0.05) than those of Avicel®.
Conclusion:
The novel composites are excellent multifunctional excipients, the best (PT:CS 1:4) one showcasing potentially better mechanical functionality than Avicel®, a popular multifunctional excipient.
Keywords: Avicel®, better mechanical functionality, chloroquine tablets, direct compression, novel excipient, Pleurotus tuber-regium (PT)-cornstarch (CS) composite
INTRODUCTION
The production of affordable pharmaceutical dosage forms, which incidentally are generics, involves careful selection of not only effective and cheap active ingredients but also cheap and functional excipients. It is even more desirable that the excipient be multifunctional in order to realize more cost-effective products. In sub-Saharan Africa, where safe natural products for pharmaceutical industry use exist in abundance and with continuous decline in the affordability of even generic products manufactured by many multinationals, the need for our indigenous manufacturers to look inward for excipients (especially multifunctional ones) is urgent. This informs the exploration of native Pleurotus tuber-regium (PT) sclerotia as an excipient in solid dosage forms. Pleurotus tuber-regium (FR) Singer is a mushroom (basidiomycete) that grows wild in the tropical and subtropical regions of the world. It has also been deliberately cultivated for food, medicine, and scientific research purposes.[1,2] Its nutritional requirements for growth are very simple, such as decaying wood, sawdust, and other cellulosic materials.[3,4] It is one of the numerous understudied natural resources in Nigeria, although its potential applications for nutritional, medicinal, and industrial purposes are multifarious. Pleurotus species do not produce toxins generally associated with some mushrooms;[3] hence the associated aversion to mushroom consumption by some people should not be extended to them. PT fruit bodies are rich in protein, while sclerotia are rich in fiber, composed mainly of nonstarch polysaccharides.[5] Deliberate cultivation of PT in Nigeria is very uncommon, so that the exploitation of this wonderful resource depends entirely on wild sources.[6] The amount of PT harvested annually in Nigeria is yet to be quantified but a careful observation of many local markets reveals that the produce is highly underutilized, poorly stored, and with associated high wastages. It has been advocated that the commercial production of this mushroom be embarked upon by farmers, as its growth requirements are simple and interest in its medicinal and nutritive values is increasing. The major use of the tuber in Nigeria is as a thickening agent in soups and sometimes it is mixed with melon or peanut and boiled or baked to form a cake. Preliminary work on PT sclerotia powder revealed that it is a good disintegrant in tablets, a functionality that was attributed to its ability to swell upon imbibition of aqueous fluid.[7] Its water-soluble and alkali-soluble polysaccharides have been characterized and used in functionalizing nanoselenium particles for synergistic anticancer activity.[8,9]
It is common knowledge to those trained in the art of pharmaceutical dosage form formulations that corn starch (CS) is a disintegrant and when partially pregelatinized, it functions as a binder as well. In the present study, PT sclerotia powder depleted of all phytochemical constituents (hence the term dephytochemicalized) was coprocessed with corn starch British Pharmacopoeia (BP) and evaluated for its multifunctionality as binder-filler-disintegrant in tablet dosage form.
MATERIALS AND METHODS
PT sclerotia were purchased from Oseokwaodu market in Onitsha Anambra State, Nigeria; authenticated by Prof. BA Ayinde of the University of Benin and Nnamdi Azikiwe University (UNIZIK) Awka, and a sample was deposited in the herbarium of the Department of Pharmacognosy and Traditional Medicine, UNIZIK with the voucher specimens number PCG474/A/038 attached. Acetone, methanol, ethanol, concentrated HCl (Sigma-Aldrich, Hamburg, Germany), Avicel® PH 101 (Sigma-Aldrich, Germany), chloroquine phosphate powder (TNN Development Ltd., China), commercial chloroquine phosphate (Evans Pharma Nigeria PLC, Nigeria), and all other reagents were of analytical grade.
Exhaustive maceration of sclerotia powder
The sclerotia were carefully peeled and washed several times with distilled water. They were cut into small pieces and shed-dried at room temperature (34 ± 2°C) for 14 days. Thereafter, they were milled using a blender (Panasonic MX 337N, Japan), sieved through aperture size of 150 μm, and 500 g of the resulting powder was soaked in 2000 mL of methanol for 72 h with intermittent shaking. After 72 h, the methanol was drained; the marc was dried at room temperature, resoaked in 2000 mL of acetone and left for another 72 h with intermittent shaking. Finally, the acetone was expressed and the resulting marc was washed four times with 4000 mL of distilled water each time, dried to a constant weight at 50°C (chromatograph oven Coslab AN, ISO 9001-2000, India), passed through sieve (150 μm) and stored in a desiccator over silica gel.
Phytochemical screening of sclerotia powder
The phytochemical screening of the exhaustively washed powder was conducted according to previously published protocols.[10,11]
Determination of ash value and heavy metal content of sclerotia powder
Ashing of the sclerotia powder was done as reported previously,[12] while heavy metal content was investigated according to the methods of Adrian (1973)[13] and the American Public Health Association (1995)[14] using an atomic absorption spectrometer (Varian AA 240, Netherlands).
Determination of pH of sclerotia powder dispersion
A dispersion of 1.0% w/v was prepared with distilled water and allowed to hydrate for 4 h before pH determination using a digital pH meter (Corning, model 10, England). Triplicate determinations were carried out and the mean recorded at room temperature (35 ± 2°C).
Generation of sclerotia powder (PT)-cornstarch BP (CS) composites
PT was mixed with CS in ratios of 1:1, 2:1, 3:1, 4:1, 1:2, 1:3, and 1:4 to generate 20 g powder mix. Each powder mix was dispersed in 60 mL of water and the resulting slurry was heated in a hot water bath (Karl Kolb D-6072 Dreieich, West Germany) and regulated at 65°C ± 2°C for 5 min. The paste formed was thinly spread on flat stainless steel trays, air-dried under forced convection to a constant weight, milled with the blender, sieved through 150-μm aperture, dried in hot-air oven (Unitemp LTE Scientific Ltd., Great Britain,) at 50°C for 2 h, and stored in airtight containers over silica gel.
Preparation of the physical mixtures of PT and CS
Two types of physical mixtures were prepared: Treated physical mixtures (TPM), i.e., those containing PT sclerotia powder and CS powder separately treated as composite above; and untreated physical mixtures (UPM), i.e., those containing PT sclerotia powder and CS powder mixed in ratios of 1:1, 2:1, 3:1, 4:1, 1:2, 1:3, and 1:4, respectively to generate 20 g powder mix. Each powder mix was mixed for 15 min using a tumbler mixer (Karl Kolb, D. 6072 Dreieich, Germany) and sieved through 150-μm aperture and dried in the hot-air oven at 50°C for 2 h to generate the physical mixtures, which were stored in airtight containers over silica gel.
Characterization of PT-CS composites and the physical mixtures of PT and CS
Micromeritic indices determination
Particle density, bulk density, tapped density, flow rate, angle of repose (AR), Carr's index (CI), and Hausner's ratio (HR) were evaluated using methods reported previously.[15] Triplicate determinations were carried out for each parameter.
Swelling index
The method described in BP (2009) was utilized, with slight modification. Briefly, 1 g of each powder of particle size less than 150 μm was accurately weighed and carefully transferred into a 50-mL measuring cylinder. It was moistened with 1 mL of ethanol 96% and 25 mL of distilled water was added. The cylinder was firmly closed and shaken vigorously every 10 min for 1 h, and then allowed to stand undisturbed for 24 h. The volume occupied by the material under test after the entire 24 h was measured. The mean of triplicate determinations was used to evaluate the swelling index by applying the equation:[16]

where SI = swelling index; Vt = final volume of hydrated powder; Vo = initial volume of powder
Fourier transform infrared (FTIR) spectroscopy
The FTIR analysis of each powder sample was carried out using the apparatus FTIR-8400S spectrometer (Shimadzu Corporation, Japan). Two milligrams (2 mg) of each sample and 200 mg KBr were powdered with an agate mortar and pestle and compressed into a pellet using the pellet press. The resulting pellet was mounted on the sample holder and the system was purged with nitrogen gas. Scanning was conducted in the range of 400-4000 cm-1 with a resolution of 1 cm-1. Duplicate measurements were made and the spectrum with the clearer peaks was chosen.
Differential scanning calorimetric (DSC) analyses
DSC characterization of each powder sample was carried out using the apparatus Nietzsche DSC 204 F1 Phoenix (Nietzsche, Germany). Four milligrams (4 mg) of each sample was carefully weighed using the analytical balance (Mettler Toledo AB54, Switzerland) and sealed in aluminium pan. Calibration of the calorimeter was done with indium and the purge gas was nitrogen. Heating of the sample was carried out at the rate of 5°C/min from 30°C to 400°C under a nitrogen flow rate of 20 mL/min, followed by cooling back to 30°C at the same rate.
Compaction study
Three hundred milligrams (300 mg) of each excipient composite or its equivalent physical mixture was accurately weighed and manually filled into one prelubricated die of a 12-station rotary press (JC - RT - 24H, Jenn Chiang Machinery Co., LTD, Feng Yuan, Taiwan) equipped with 10-mm flat faced punches, after 11 of the dies were blinded.[17] Compression of the samples was carried out manually at pressure range of 5-35 KN. Immediately after ejection, the resulting tablet's weight was determined with an analytical balance (Mettler Toledo AB54 GmbH, USA), and its diameter and thickness were measured using a digital micrometer gauge (Mitutoyo: Model 10c-1012EB, Japan). Six tablets were made for each sample at each compression pressure and the mean values utilized in the relevant compaction study calculations. The resulting tablets were stored in airtight containers over silica gel for 7 days to allow relaxation to take place. Thereafter, their dimensions and hardness values were measured using the digital micrometer and the Erweka hardness tester (Karl Kolb Erweka, Germany), respectively. The mean values derived from these measurements were used to evaluate the following:
Tablet relative density (D)
The relative density (packing fraction) values of the various tablet batches were evaluated using the following equation:

where ρa = compact apparent density; ρs = particle density of the powder from which the compact was made.
Heckel analysis
This was conducted using Heckel's equation:

where D is the relative density of the powder compact at pressure P; the constant K is a measure of the plasticity of the compressed material; the constant A is related to the die filling and particle rearrangement before deformation and bonding of the discrete particles. K, is estimated from the slope of the straight portion of the curve resulting from the plot of In[1/(1-D)] as a function of P, while the intercept of the straight portion on the y-axis estimates the constant A. Relative density (DA), which represents the total degree of packing at zero and low pressure, can be calculated from the constant, A, using the equation:

Subtraction of the relative density at zero pressure (D0) from DA yields the relative density due to particle rearrangement at low pressure (DB):

The slope is also related to the yield strength, Y, of the material by equation 6:[18]

The reciprocal of K is termed the mean yield pressure, PY. PY gives indication whether the fragmentation of particles was the predominant compaction mechanism of powders.
Formulation and evaluation of chloroquine phosphate tablets with the excipients
After some preliminary studies on the mixing ratios of chloroquine and the multifunctional excipients for tablet formulation, the 4:1 ratio of drug to excipients was selected. Twenty grams (24.0 g) of chloroquine phosphate and 6.0 g of each of the excipients or microcrystalline cellulose (Avicel®) were mixed using benchtop planetary mixer (Kenwood, model OWHM400020, Yokohama, Japan) for 10 min. Thereafter, the flow properties of the mixtures were evaluated, before the addition of 0.5% w/w magnesium stearate and further mixing for 5 min.[7] Subsequently, 500 mg of each drug excipient mixture was weighed and carefully poured into the die and compressed with a force of 17.5 KN using the tablet press (JC - RT - 24H, Jenn Chiang Machinery Co., LTD, Feng Yuan, Taiwan) equipped with 13-mm flatfaced punches. The resulting tablets were stored in airtight containers over silica gel for 72 h before tablet hardness, friability, and disintegration time tests were carried out on them using the standard protocol.[19]
Dissolution study on chloroquine tablets
Dissolution test was carried out according to United States Pharmacopoeia (USP) XXIII basket method with an eight-chambered dissolution test machine (Erweka Germany Type: DT 80) operated at 100 rpm for 45 min in 900 mL of distilled water, maintained at 37 ± 0.5°C. Five milliliters (5 mL) of dissolution fluid was withdrawn and replaced with 5 mL of fresh medium at the following intervals: 5 min, 10 min, 15 min, 20 min, 25 min, 30 min, 35 min, 40 min, and 45 min. Each withdrawn sample was made up to 20 mL with fresh medium, filtered, and its absorbance determined with ultraviolet (UV)-visible spectrophotometer (UV - 160A, Shimadzu Corporation, Japan) at 323 nm and distilled water as blank. Triplicate determinations were conducted and the mean values used to evaluate the percentage drug released using the Beer's plot for chloroquine (y = 0.0365x - 0.0034, R2 = 0.9934) and applying the appropriate dilution factor.
Statistical analysis
The results of the experiment were analyzed with regression analysis (GraphPad Prism 5, California, USA) and one-way analysis of variance (ANOVA) (Microsoft Excel 2007, California, USA), with level of significance fixed at P < 0.05.
RESULTS AND DISCUSSION
Residual phytochemicals in macerated sclerotia powder
The qualitative phytochemical analysis of macerated (dephytochemicalized) sclerotia powder showed that the marc has been rid of alkaloids, flavonoids, terpenes, tannins, etc. [Table 1] Carbohydrates including cellulose were also not detected, but protein was present. Various authors on the proximate composition of PT sclerotia reported the presence of different phytochemicals including carbohydrates;[20,21,22,23] it is thus obvious that the maceration technique employed in this study succeeded in ridding the sclerotia powder of the phytochemicals, except protein(s). Acid hydrolysis of the marc, and subsequent tests for reducing sugars also gave a negative result for cellulose. Incidentally, this implies that the fibrous marc might be predominantly or completely composed of protein.
Table 1.
Physicochemical and phytochemical characteristics of macerated sclerotia powder

Ash value, heavy metal content, and pH of macerated sclerotia powder
The total ash value for the macerated sclerotia powder was 0.40 ± 0.09%. This parameter gives information about physiological ash, which is derived from the plant tissues and nonphysiological ash, which is often from environmental contaminations.[24,25] The low value indicated the low level of contamination with inorganic compounds, including heavy metals. The contents of heavy metals in the marc were evaluated from their calibration curves and were found to be below the acceptable limits,[26,27] with some being entirely absent [Table 1]. Selenium and cobalt are generally portrayed as being medicinal; both, however, belong to class 2A (toxicity depends on route of intake but contamination level must be determined due to their higher relative natural abundance) under International Conference on Harmonization (ICH) guidelines.[28]
Fourier transform infrared spectroscopy
The spectrum of the macerated sclerotia powder is shown in Figure 1a. The band frequency at 539 cm−1 most probably indicates the presence of phosphate or sulfite bond as C-P-O-or C-S stretch;[29] 831 cm−1 suggests an aromatic C-H out-of-plane bend, while 934 cm−1 indicates vinyl C-H out-of-plane bend. In addition, 1271 cm−1 may be assigned to aromatic primary amine C-N stretching vibration. The peaks at 1478 cm−1 and 1615 cm−1 might have emanated from C = C-C aromatic ring stretch.[30] C = O stretching vibration from a carbonyl group, probably from an acyclic ketone, may be assigned to 1711 cm−1, while 2480 cm−1 may likely be either from N-H stretching vibration of an amide group or that of C = O from a carbonyl group. While 2701 cm−1 was from C-H stretching of a terminal aldehydic group, 3011 cm−1 suggests the presence of C-H stretching vibration from a terminal vinyl group. N-H stretching vibration from an aliphatic primary amine is indicated by 3351 cm−1, whereas 3536 cm−1 points to the presence of O-H stretching vibration on an aryl group.[29,31] For CS [Figure 1b], alcohol O-H out-of-plane bend was seen as the peak at 578 cm−1, 1025 cm−1 pointed to the C-C skeletal vibration from a cyclohexane ring.[29,32] C-H symmetrical bend from a CH3 group was depicted by the peak at 1376 cm−1. Adsorbed water on the starch was seen as an O-H peak at 1647 cm−1.[33] The peak at 2169 cm−1 is due to the combination of a C-H and a C-C stretching vibrations from an asymmetrical aliphatic group, whereas 2356 cm−1 was assigned to C-H stretch of the -CH2.[34] The C-H stretching vibration from a methylene (C-CH2 -C) group is shown by 2927 cm−1; 3393 cm−1 is the peak for H bonded O-H stretching vibration from a polymeric -OH group.[34] The spectrum of PTCS (PCS 1:1) is shown in Figure 1c, which reveals that majority of the peaks in the CS spectrum were retained in the composite. None of the peaks seen in the spectrum of sclerotia powder was displayed in the PCS composite, and this could be attributed to the occlusive nature of the starch gel, which might have coated the particles of sclerotia powder, thereby preventing their interaction with the infrared wave. Additionally, two peaks (1376 cm−1 and 2356 cm−1) in CS spectrum disappeared and two new ones (1420 cm−1 and 1528 cm−1), assigned respectively to vinyl C-H in-plane bend (C = C-H) and aromatic N-H bending or C-N stretching vibrations, were observed.[34] The disappearance of the peaks may be attributed to some interactions between the -OH in the starch molecules and the N-H in the sclerotia powder, and/or the -OH in the sclerotia powder and -CH3 in the starch.[34]
Figure 1.

FTIR spectra of PT: Pleurotus tuber-regium (a) CS: Cornstarch (b) and PT-CS (c)
Differential scanning calorimetry
The thermograms of the macerated PT sclerotia powder and some of the composites with CS are shown in Figure 2, while the values of the thermodynamic parameters for the excipients are summarized in Table 2. The dehydration temperature of PT was 55.8°C with heat of dehydration of 362.8 J/g. Its peak melting point was 329.5°C and was relatively broad, an indication of polymeric and amorphous nature of the material.[34,35] Some of the thermal properties of the coprocessed excipients are shown in Table 2 and it is obvious that the copregelatinization of CS and PT as well as increase in the CS content gave rise to higher dehydration temperatures and heats of dehydration. This may be ascribed to the copregelatinized excipient's ability to bind water molecules more tightly than both the TPM and UPM. The implication of this is that the composites (PCSs) are much less likely to release their bound water during tableting, thus may be more suitable for the formulation of moisture-sensitive drugs if other factors such as packaging and acid-base interaction have been addressed. The melting point of PT was relatively attenuated by the presence of CS, which may be accounted for by the water content of the starch, which often acts as an impurity in starch and a plasticizer in excipient blends, thereby lowering the melting point of starch or starch-containing excipients.[35,36] There was good similarity in the thermograms of the 1:1 combination of the excipients [Figure 2a-d] and this suggests very good miscibility between the excipients. The attenuation of melting point of the composites is technologically advantageous because it will enhance their processibility (compactibility, plasticity).[37,38] An anomalous behavior in the peak melting point of the coprocessed excipients and the physical mixtures is evident as a higher proportion of starch gave rise to the elevation of peak melting points and the depression of heats of fusions [Table 2]. This may be linked to the alteration of the crystallinity of the blends caused by interaction between the -OH group of CS and the amide N-H group of PT, thereby leading to cross-linking. Previous workers have reported that a change in the crystalline structure of polymer blends may result from polymer/polymer interactions in the amorphous phase, which ultimately creates disorder in crystals and reduce the enthalpy of the phase change.[39,40,41] Furthermore, the thermograms of 1:4 (PT:CS) excipient mixtures revealed two thermal events: Two endothermic events for PCS 1:4 and UPM 1:4; one exothermic and one endothermic events for TPM 1:4. The biphasic endothermic event has been previously reported for starches that were heat/moisture-treated and those with relatively high moisture content.[42] The exothermic event (crystallization) and subsequent melting/decomposition seen in TPM 1:4 is attributable to the second stage that takes place in the process of starch gelatinization, which derives from the formation of starch-solvent -OH bond to complete the gelatinization process and then subsequently melting/decomposition of the starch granules.[43]
Figure 2.

DSC thermograms of PT (a) PCS 1:1 (b) TPM 1:1 (c) UPM 1:1 (d) PCS 1:4 (e) TPM 1:4 (f) and UPM 1:4 (g)
Table 2.
Thermodynamic parameters of macerated sclerotia powder and some composites

Micromeritic and swelling properties of composites and physical mixtures
The particle densities of macerated untreated sclerotia powder (UPT), heat-treated macerated sclerotia powder (TPT), untreated corn starch (UCS), heat-treated corn starch (TCS), and Avicel® PH 101 (AVI) are 1.172 ± 0.015 g/mL, 1.385 ± 0.018 g/mL, 1.395 ± 0.030 g/mL, 1.322 ± 0.025 g/mL, and 1.463 ± 0.079 g/mL respectively [Table 3]. The particle densities of composites ranged from 1.246 ± 0.015 g/mL (PCS 4:1) to 1.428 ± 0.034 g/mL (PCS 1:1); for treated physical mixtures the range was 1.190 ± 0.070 g/mL (TPM 2:1) to 1.435 ± 0.039 g/mL (TPM 1:4), while those for the untreated physical mixture ranged from 1.205 ± 0.038 g/mL (UPM 1:1) to 1.412 ± 0.035 g/mL (UPM 1:4) [Table 3]. The particle density of UPT is lower than that of TPT, probably as a result of the pregelatization during which water was retained by the powder. It is also lower than the previously reported value of 1.20 g/mL,[7] which may be because of the maceration process employed in the generation of UPT. The particle densities of the composites (PCSs) were higher than those of their corresponding physical mixtures (both TPMs and UPMs) except for the 1:4 combinations of PT and CS, where PCS possessed lower particle density than TPM or UPM. The reasons for these observed differences were not immediately apparent, but they might not be unconnected with the moisture contents of the PCSs: The interaction between the two excipients during pregelatinization might have led to the entrapment of more moisture within. Bulk or loose density and tapped density give valuable information about the packing and flow characteristics of powders. Bulk and tapped densities of a powdered material change easily depending on the packing character of the particles, hence their values vary for the same material under different conditions. Where uniform conditions are relatively maintained, however, they can be used as tools for assessment of powder flow quality. The bulk and tapped densities of the PCSs are higher than those of the physical mixtures (TPM and UPM) [Table 3]. This implies that under similar packing conditions, the composites will be more densely packed than the physical mixtures and may require smaller packaging material as they possess smaller values of bulkiness (inverse of bulk density). When expressed as packing fraction (tapped density/particle density) as shown in Figure 3, it is very obvious that the consolidation characteristics of the composites are better than those of physical mixtures (especially untreated ones) and even that of Avicel. Packing of powders is a very important consideration in the production of solid dosage forms.[44,45] Figure 3 shows that increase in the concentration of PT in the composites decreased their packing fractions. This may be attributed to the fluffy nature of PT, a property that CS was unable to attenuate effectively at low concentration. The packing fractions of the composites and their physical mixtures were higher than that of Avicel. A high packing fraction is desirable in the compaction of powders to tablets and in capsule-filling operations. In contrast, powders that display high packing fractions during routine tapping operations usually flow poorly,[46] and this was observed in this study.
Table 3.
Micromeritic and swelling properties of the excipients

Figure 3.

Packing fraction of composites, physical mixtures, and controls
Empirical evaluation of powder flow will not cease to be relevant in the production of tablets, capsules, bulk, and divided powders. The common parameters employed in such evaluation purposes are CI, HR, AR, and flow through an orifice. The CI, HR, and AR for the composites respectively ranged from 25.00% (PCS 1:2) to 44.26% (PCS 1:1), 1.33 (PCS 1:2) to 1.81 (PCS 1:2), and 36.74° (PCS 1:4) to 48.91° (PCS 4:1), as shown in Table 3. The values for TPMs were 39.60% (TPM 3:1) to 57.54% (TPM 4:1), 1.66 (TPM 3:1) to 2.36 (TPM 4:1) and 41.74° (TPM1:4) to 51.68° (TPM3:1); whereas the UPMs displayed values in the range of 51.43% (UPM 1:1) to 56.00% (UPM 2:1), 2.06 (UPM 1:1) to 2.27 (UPM 2:1) and 53.60° (UPM 2:1) to 45.34° (UPM 1:4) with respect to CI, HR, and AR [Table 3]. These parameters, which still remain the compendial specifications for powder flow evaluation, have enjoyed popularity because of their simplicity of experimentation and the numerous limitations of the new methods (such as shear cell, avalanching, dielectric imaging, atomic force microscopy, and penetrometry).[47] The composites (PCSs) had flow characteristics within the passable scale of CI, HR, and AR indices when viewed holistically. The TPMs’ flow properties were largely within the poor and very poor grades, while those of the UPMs were located within the very poor and very very poor range.[48] Untreated sclerotia powder (UPT), untreated cornstarch (UCS), and treated sclerotia powder (TPT) all displayed very poor flow, whereas the flow of treated cornstarch, i.e., partially pregelatinized corn starch (TCS) was within fair flow range. It is evident that the copregelatinization of PT and CS improved the flow properties of both powders, especially PT, which was of very poor flow when pregelatinized alone. This inference was reinforced by the flow properties of the physical mixtures. For the TPMs, PT and CS powders were separately pregelatinized and then mixed in the appropriate ratios thereafter. On the other hand, the UPMs were not pregelatinized. Both types of physical mixtures exhibited significantly (P < 0.05) poorer flow properties in comparison to the composites. It is therefore evident that the copregelatinization of the powders to generate the composites positively impacted the flow characteristics of the composites. Among the composites, PCS 1:2 exhibited the best flow when a tapping experiment was employed, while PCS 1:4 was the best under free fall and rearrangement technique (AR). Under free fall, it appears that increase in CS concentration improved flow [Table 3]. This observation may be explained by the ability of starch to reduce (as was observed in the laboratory) the fluffy nature of sclerotia powder upon copregelatinization. Better flow was thus realized as the content of CS was increased and the ability CS to improve flow was also apparent among the physical mixtures, especially the TPMs, in which the explanation given above may still be true, whereas for the UPM, it may be ascribed to the lubricant and glidant properties of starch.[49,50] The flow characteristics of Avicel® PH 101 were generally similar to those of PCSs (except PCS 1:2), as can be seen from Table 3. Avicel has been reported to possess poor flow properties,[51] and this was observed in this work to be the case of the new composites. The composite PCS 1:2 possessed the best flow property.
The swelling indices of excipients are pointers to their ability to act as disintegrants in tablet or capsule dosage forms. This is informed by the fact that one of the mechanisms through which disintegration occurs is the imbibitions of fluid, swelling, and exertion of pressure within the matrix of the dosage form, causing its rupture. Treated and untreated PT sclerotia powder exhibited significantly (P < 0.05) better swelling property in comparison to treated and untreated CS BP [Table 3]. Additionally, the swelling index of the composites (except PCS 4:1 and PCS 1:2) are lower than those of TPT and UPT. The swelling indices of composites and their treated and untreated physical mixtures reveal that as the proportion of PT was increased, the swellability of the excipients also increased. In contrast, increment in CS concentration in the mixture caused reduction in excipient swellability. This observation was, however, very different in PCS 1:2, which displayed the greatest swelling index of 112%. An explanation of this observation may be that copregelatinization of the two excipients at 1:2 ratio caused more physical cross-linking between them and incidentally gave rise to better swellability. As the proportion of CS was increased, however, there was increase in the plasticizing ability of the composites and reduction in their swelling indices. In comparison to Avicel, the new composites possess very significantly (P < 0.05) better swelling indices, and this may likely play out in their disintegrant properties, as the functionality of most disintegrants has been linked to their ability to swell.[52,53]
Heckel analysis of the composites and the physical mixtures of their components
The degree of initial packing in the die due to filling with powder is represented by D0. The addition of CS to PT to form composite resulted in increment in the values of D0. In the same vein, raising the percentage content of CS in the composites and their physical mixtures gave rise to increased D0 values, while increment in PT concentration resulted in reduction in D0[Table 4]. This implies that initial packing due to die filling was positively influenced by increment in CS concentration and negatively affected by that of PT increment.[19,54] This appears to contradict the observation under packing fraction; however, it is worth noting that D0 reflects packing at zero pressure before any type of tapping. The relative density of powder bed at low pressure, DB, was observed to be higher for excipients (both composites and their physical mixtures) containing higher proportions of PT than those with high proportions of CS. This implies that consolidation of the powders at low pressure was better in composites and physical mixtures containing more PT. This observation corroborates the result of packing fraction discussed above. The total degree of packing (DA) also revealed that the consolidation of the excipients was higher in ones with higher proportions of PT than CS. Furthermore, the consolidation properties of the UPMs were not significantly different from those of TPMs or the composites. This seems to suggest that under low pressure, the consolidation characteristics of the excipients were similar irrespective of prior treatment given to them. This characteristic must have been imparted by PT because previous reports indicated that the consolidation of pregelatinized CS was better than that of unpregelatinized CS at low pressure.[55,56,57] The yield pressure, PY, is the reciprocal of the slope, K, of the linear portion on Heckel plot [Figure 4]. It gives information on the deformation characteristics of a powder. Low PY values indicate that deformation was predominantly plastic in nature, while high values imply fragmentation prior to plastic deformation.[55] The PY values for composites were significantly (P < 0.05) higher than those of physical mixtures and UPT [Table 4]. The low PY values of UPT and TPMs imply that they deformed plastically, whereas the PCSs that displayed high PY values underwent fragmentation before plastic deformation. The compaction behavior of PCSs might have derived from their physical interaction as coprocessed materials, in which the compaction pressure first caused the breakdown of the bridges between the two materials before plastic deformation of the composite began. This characteristic is advantageous in compaction: Such an excipient will be less lubricant-sensitive as new surfaces will be available for plastic formation after fragmentation, even in the presence of a lubricant. The cumulative energy thus required to achieve these steps in the compaction process of the composites necessitated the impartation of higher pressure, as observed in this study. The PY values of UPMs were relatively higher than those of TPMs. This may be attributed to the presence of unmodified starch, which is well known to possess unsatisfactory compaction characteristics. The plastic deformation noted for the physical mixtures could therefore be ascribed to mainly the presence of PT powder. It is, however, pertinent to note that a low PY value does not necessarily imply that the resulting compact has acceptable tensile strength.[57,58]
Table 4.
Heckel analysis parameters

Figure 4.

Heckel plots for excipients: Composites (a) Treated physical mixtures (TPMs) (b) and untreated physical mixtures (UPMs) and untreated Pleurotus tuber-regium powder (UPT) (c)
Packing and flow properties of chloroquine-excipient binary mixtures
Table 5 shows the functional densities with corresponding flow characteristics and ARs of the binary mixtures. Chloroquine phosphate powder is free-flowing, as can be seen from its flow indices. With the exception of PCS 1:2, PCS 1:3, and PCS 1:4, the incorporation of the other excipients (including Avicel) reduced the flowability of chloroquine powder. Grading flow using flowability indices (CI, HR, and AR), the flow of chloroquine powder was within the very good flow class, whereas its binary mixture with Avicel was within the good flow range. The composites PCS 1:2, PCS 1:3, PCS 1:4 and the physical mixture TPM 1:4 maintained the very good flowability of chloroquine, while the other excipients dragged it into fair flow range. This observation does not imply that the excipients may ultimately negatively affect the properties of chloroquine tablets formulated with them, because taking other factors that play out during formulation into consideration, these excipients may be useful in retarding flow responsibly by preventing flooding of powders from hopper to die cavities during tableting in a rotary press. In general, it is evident that the flowability of chloroquine-excipient binary mixtures was influenced by the flow properties of the excipients, a corroboration of a previous finding.[59]
Table 5.
Packing and flow properties of chloroquine-excipient binary mixtures

Mechanical properties of chloroquine phosphate tablets
Tablets are powder compacts that are expected to possess a certain level of mechanical strength in order to withstand postcompaction handling and transportation. In this study, the tablets’ hardness values, of all formulations studied, were greater than the accepted minimum (4 KgF).[60] The hardness of the Evans brand was approximately 4 KgF [Table 6]. These acceptable values notwithstanding, some formulations had tablet friability values (friability >1%) that negate their ability to withstand transport and other postformulation handling. With the exception of PCS 1:1 CQ, all tablets formulated with the composites possessed acceptable friabilities (i.e., < 1%),[61] while virtually all the UPMs failed to impart good friability to the tablets. This is not unexpected, as the friabilities of tablets formulated with untreated CS or PT were above the accepted limit [Table 6]. The friability of the commercial product was similar to those of tablets formulated with composites or TPMs, and that of AVICQ was superior to them. Tablets of CQ powder had the high friability of 4%, which was effectively reduced to the acceptable minimum by the composites at a low content level of one-fifth weight ratio to chloroquine phosphate powder. This result is encouraging: As the composite is intended to be multifunctional (filler-binder-disintegrant), evident effectiveness at low concentration is of immense advantage.
Table 6.
Mechanical properties of chloroquine tablets
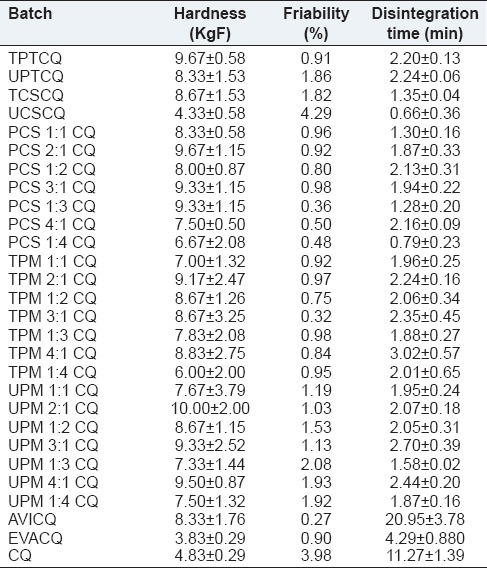
The disintegration time of chloroquine tablets as shown in Table 6 reveal that except those formulated with Avicel, the tablets disintegrated in less than 15 min, the maximum acceptable time for conventional tablets.[62] Mean disintegration time for the Evans brand was 4.29 min, which was significantly higher (P < 0.05) than the mean disintegration time of tablets formulated with the composites (PCS 1:4). Reference to swelling index of these excipients [Table 3] shows that tablet disintegration times were influenced by the swellability of the excipients. Composites and TPMs, which possessed higher swellability potential, also caused faster tablet disintegration. It may thus be suggested that the disintegrant property of the excipients is executed by the swelling mechanism, and this is similar to previously reported findings.[63,64]
Dissolution profile of chloroquine tablets
Dissolution study of solid dosage forms is a key quality control test, especially where drug solubility in aqueous media is a challenge. Chloroquine phosphate, however, does possess very good aqueous solubility, so its dissolution from tablets may be influenced mostly by the ability of the disintegrant to rupture the tablet and release granules or chloroquine-excipient particles, which will commence the process of dissolution. The dissolution profiles of representative tablet batches are shown in Figure 5, from which it is very obvious that the new excipient composites are suitable multifunctional candidates for chloroquine and probably other drug powders. The amount of drug released in 45 min[65] from tablets formulated with the excipient composites ranged from 86.43 ± 12.61% (PCS 3: 1CQ) to 97.63 ± 10.99% (PCS 1:4), while that from tablets formulated with Avicel® PH101 was 60.43 ± 9.69% (AVICQ) and that from the Evans product was 104.91 ± 10.58% (or, EVACQ). The amount of chloroquine that dissolved in the dissolution medium from tablets formulated with the new excipient composites was significantly higher (P < 0.05) than the amount that dissolved from AVICQ tablets. For the commercial comparator (EVACQ), the amount of drug dissolved was initially (in less than 40 min from T0) significantly higher (P < 0.05) than the amounts released from the PCSCQs, but at 45 min, the difference between them was not significant, especially for PCS 1:4 CQ. A close inspection of Table 6 will reveal that among the PCSCQs, PCS 1:3 CQ and PCS 1:4 CQ possessed the best mechanical properties based on friability and disintegration time as indices for quality determination. This informed their selection and comparison with the TPMs and UPMs [Figure 5b]. No significant difference was seen in the amount of drug dissolved from PCSCQs, TPMCQs, and UPMCQs. Other properties of the tablets, however, had showcased the PCSCQs as possessors of higher qualities. These results suggest that all the batches except AVICQ met the pharmacopeial requirement of ≥75% chloroquine release in 45 min.[66,67,68,69] An assessment of the quality of a new formulation of chloroquine phosphate (A-CQ 100) submitted to the Medicine Evaluation Board, Netherlands for marketing approval reported that the amount of drug released (Q) from the innovator product (Nivaquine®) was of the order: 80% < Q < 100% within 30 min in dissolution media of pH values 1.2, 4.5, and 6.4.[68] The commercial product (comparator) that was used in this study released up to 103% in 30 min, a performance that is better than that reported for the innovator product, although the medium used in this study was distilled water. The commercial product in this study is therefore a more stringent comparator to the tablets formulated in this study than the innovator product; yet, there was no significant difference between the amount of drug it released and those from the PCSCQs samples at 45 min. This is worth noting and points to the novel excipient composite as a suitable multifunctional excipient for the formulation of difficult to compact powders that chloroquine phosphate represents.[70]
Figure 5.

Dissolution profile of chloroquine tablets: Composites, commercial comparator, and AVICQ (a) Selected composites, physical mixtures, commercial comparator, and AVICQ (b)
CONCLUSION
Coprocessing of dephytochemicalized PT sclerotia powder and CS yielded novel composites that have shown promise as excellent multifunctional excipients. The combination ratio of PT to CS with the best multifunctional characteristics in chloroquine tablet was 1:4 (PCS 1:4). The functional properties of this composite and even those of the other composites were better than those of their physical mixture counterparts, and they showcased potentially better mechanical functionality than Avicel®, a popular multifunctional tablet excipient.
Financial support and sponsorship
Nil.
Conflicts of interest
There is no conflict of interest from any person, group, or organization.
REFERENCES
- 1.Ikewuchi CC, Ikewuchi JC. Chemical profile of Pleurotus tuberregium (Fr) Sing's sclerotia. Pacific J Sci Technol. 2008;10:295–9. [Google Scholar]
- 2.Afieroho OE, Lawson L, Adedokun OM, Emenyonu N. Antituberculosis and phytochemical investigation of the dichloromethane extract pleurotus tuber-regium (fries) singer sclerotium. Int Res J Pharm. 2013;4:255–7. [Google Scholar]
- 3.Kuforiji OO, Fasidi IO. Biodegradation of agro-industrial wastes by a edible mushroom Pleurotus tuber-regium (Fr.) J Environ Biol. 2009;30:355–8. [PubMed] [Google Scholar]
- 4.Chen L, Xu W, Lin S, Cheung PC. Cell wall structure of mushroom sclerotium (Pleurotus tuber regium): Part 1. Fractionation and characterization of soluble cell wall polysaccharides. Food Hydrocoll. 2014;36:189–95. [Google Scholar]
- 5.Huang HY, Korivi M, Chaing YY, Chien TY, Tsai YC. Pleurotus tuber-regium polysaccharides attenuate hyperglycemia and oxidative stress in experimental diabetic rats. Evid Based Complement Alternat Med. 2012;2012:856381. doi: 10.1155/2012/856381. [DOI] [PMC free article] [PubMed] [Google Scholar]
- 6.Okhuoya JA, Akpaja EO, Osemwegie OO, Oghenekaro AO, Ihayere CA. Nigerian mushrooms: Underutilized non-wood forest resources. J Appl Sci Environ Manage. 2010;14:43–54. [Google Scholar]
- 7.Iwuagwu MA, Onyekweli AO. Preliminary investigation into the use of Pleurotus tuber-regium powder as a tablet disintegrant. Trop J Pharm Res. 2003;1:29–37. [Google Scholar]
- 8.Chen T, Wong KH, Wu H, Zheng W, Wong MK, Man WY. Pleurotus Tuber-Regium Polysaccharide Functionalized Nano-Selenium Hydrosol with Anti-Tumor Activity and Preparation Method Thereof. United States Patent No: US9072669 B2. 2013:1–16. [Google Scholar]
- 9.Zhang M, Zhang L, Cheung PC, Ooi VE. Molecular weight and anti-tumor activity of the water-soluble polysaccharides isolated by hot water and ultrasonic treatment from the sclerotia and mycelia of Pleurotus tuber-regium. Carbohydr Polym. 2004;56:123–8. [Google Scholar]
- 10.Yadav RN, Agarwala M. Phytochemical analysis of some medicinal plants. J Phytol. 2011;3:10–4. [Google Scholar]
- 11.Anowi Cf, Uzondu AL, Onyeriri LO, Okoye EI. Phytochemical and elemental analyses of gum obtained from Treculia Africana seeds. Int J Adv Pharma Sci. 2014;5:1711–6. [Google Scholar]
- 12.Okoye EI, Onyekweli AO, Kunle OO. Solid state characterization of Anacardium occidentale gum. Res J Appl Sci Eng Technol. 2012;4:3709–16. [Google Scholar]
- 13.Adrian WJ. A comparison of a wet pressure digestion method with other commonly used wet and dry-ashing methods. Analyst. 1973;98:213–6. [Google Scholar]
- 14.Standard Methods for the Examination of Water and Waste Water. 20th ed. New York: AWWA/NPCF; 1998. American Public Health Association (APHA) pp. 5–24. [Google Scholar]
- 15.Ebere O, Titilope A, Teresita M. Comparative study of the functionality of povidone, gelatin and corn starch on Moringa oleifera leaf granule and capsule formulations. Am J Pharm Tech Res. 2013;3:778–99. [Google Scholar]
- 16.Meka VS, Nali RS, Songa AS, Kolapalli VR. Characterization and in vitro drug release studies of a natural polysaccharide Terminalia catappa gum (Badam gum) AAPS PharmSciTech. 2012;13:1451–64. doi: 10.1208/s12249-012-9873-5. [DOI] [PMC free article] [PubMed] [Google Scholar]
- 17.Palmieri GF, Joiris E, Bonacucina G, Cespi M, Mercuri A. Differences between eccentric and rotary tablet machines in the evaluation of powder densification behaviour. Int J Pharm. 2005;298:164–75. doi: 10.1016/j.ijpharm.2005.04.033. [DOI] [PubMed] [Google Scholar]
- 18.Emeje MO, Kunle OO, Ofoefule SI. Compaction characteristics of ethylcellulose in the presence of some channelling agents: Technical note. AAPS PharmSciTech. 2006;7:58. doi: 10.1208/pt070358. [DOI] [PubMed] [Google Scholar]
- 19.British Pharmacopoeia. Vol. 4. London: Her Majesty Stationery Office; 2009. p. A449. [Google Scholar]
- 20.Apetorgbor AK, Dzomeku M, Apetorgbor MM. Growth factors and cultivation of Pleurotus tuber-regium on selected plant wastes. Int Food Res J. 2013;20:3387–93. [Google Scholar]
- 21.Oranusi US, Ndukwe CU, Braide W. Production of Pleurotus tuber-regium (Fr.) Sing Agar, chemical composition and microflora associated with sclerotium. Int J Curr Microbiol App Sci. 2014;3:115–26. [Google Scholar]
- 22.Chiejina NV, Olufokunbi JO. Effects of different substrates on the yield and protein content of Pleurotus tuber regium. Afr J Biotechnol. 2010;9:1573–7. [Google Scholar]
- 23.Motey GA, Odamtten GT, Akaho EH, Opata NS. Elemental and mycochemical profile, antimicrobial activities and uses of the sclerotium of Pleurotus tuber-regium, a medicinal mushroom in Ghana. Canadian J Pure Appl Sci. 2015;9:3535–40. [Google Scholar]
- 24.Rao Y, Xiang B. Determination of total ash and acid-insoluble ash of Chinese herbal medicine Prunellae Spica by near infrared spectroscopy. Yakugaku Zasshi. 2009;129:881–6. doi: 10.1248/yakushi.129.881. [DOI] [PubMed] [Google Scholar]
- 25.Kunle OF, Egharevba HO, Ahmadu PO. Standardization of herbal medicines — a review. Int J Biodivers Conserv. 2012;4:101–12. [Google Scholar]
- 26.Heavy Metals: Analysis and Limits in Herbal Dietary Supplements. [Last accessed on 2015 Jun 6]. Available from: http://www.naturalhealthresearch.org/wpcontent/uploads/2013/02/09_1214_AHPA_Heavy-Metals-White-Paper-Revised.pdf .
- 27.Elemental Impurities: Standards-Setting Record. [Last accessed on 2015 Jun 6]. Available from: http://www.usp.org/sites/default/files/usp_pdf/EN/USPNF/2012-12 20_elemental_impurities_standards-setting_record-full.pdf .
- 28.International Conference on Harmonization of Technical Requirements for Registration of Pharmaceuticals for Human Use. Draft Consensus Guideline for Elemental Impurities. Q3D Current Step 2b version. 2013 [Google Scholar]
- 29.Coates J. Interpretation of infrared spectra: A practical approach. In: Meyers RN, editor. Encyclopaedia of Analytical Chemistry. Chichester: John Wiley & Sons Ltd; 2000. pp. 10815–37. [Google Scholar]
- 30.Infrared Spectroscopy. [Last accessed on 2015 Jun 29]. Available from: http://www2.chemistry.msu.edu/faculty/reusch/VirtTxtJmL/Spectrpy/InfraRed/infrared.htm .
- 31.Larkin PJ. General outline and strategies for IR and Raman spectral interpretation. In: Larkin P, editor. IR and Raman Spectroscopy: Principles and Spectral Interpretation. Oxford, UK: Elsevier; 2011. pp. 117–34. [Google Scholar]
- 32.Stuart B. Infrared Spectroscopy: Fundamentals and Applications. UK: John Wiley & Sons Ltd; 2004. pp. 71–93. [Google Scholar]
- 33.Maiti M, Kaith BS, Jindal R, Jana AK. Synthesis and characterization of corn starch based green composites reinforced with Saccharum spontaneum L graft copolymers prepared under micro-wave and their effect on thermal, physio-chemical and mechanical properties. Polym Degrad Stab. 2010;95:1694–703. [Google Scholar]
- 34.Raju CL, Rao JL, Reddy BC, Brahmam KV. Thermal and IR studies on copper doped polyvinyl alcohol. Bull Mater Sci. 2007;30:215–8. [Google Scholar]
- 35.Gabott P. Principles and Applications of Thermal Analysis. [Last accessed on 2015 Jul 9]. Available from: http://www.uobabylon.edu.iq/uobcoleges/ad_downloads/6_28118_901.pdf .
- 36.Othman N, Azahari NA, Ismail H. Thermal properties of polyvinyl alcohol (PVOH)/Corn Starch Blend Film. Malaysian Polym J. 2011;6:147–54. [Google Scholar]
- 37.Zhang Q, Zhang Y, Wang F, Liu L. Thermal properties of PHB/PEG blends. J Mater Sci Technol. 1998;14:95–6. [Google Scholar]
- 38.Juneja P, Kaur B, Odeku OA, Singh I. Development of Corn Starch-Neusilin UFL2 conjugate as tablet superdisintegrant: Formulation and evaluation of fast disintegrating tablets. J Drug Deliv. 2014;2014:827035. doi: 10.1155/2014/827035. [DOI] [PMC free article] [PubMed] [Google Scholar]
- 39.Guirguis O, Moselhey M. Thermal and structural studies of poly (vinyl alcohol) and hydroxypropyl cellulose blends. Nat Sci. 2012;4:57–67. [Google Scholar]
- 40.Gill P, Moghadam TT, Ranjbar B. Differential scanning calorimetry techniques: Applications in biology and nanoscience. J Biomol Tech. 2010;21:167–93. [PMC free article] [PubMed] [Google Scholar]
- 41.Shete G, Puri V, Kumar L, Bansal AK. Solid state characterization of commercial crystalline and amorphous atorvastatin calcium samples. AAPS PharmSciTech. 2010;11:598–609. doi: 10.1208/s12249-010-9419-7. [DOI] [PMC free article] [PubMed] [Google Scholar]
- 42.Lim ST, Chang EH, Chung HJ. Thermal transition characteristics of heat-moisture treated corn and potato starches. Carbohydr Polym. 2001;46:107–15. [Google Scholar]
- 43.Buleon A, Colonna P. Physicochemical behaviour of starch in food applications. In: Belton P, editor. The Chemical Physics of Food. Singapore: Blackwell Publishing Ltd; 2007. pp. 33–40. [Google Scholar]
- 44.Fu X, Dutt M, Bentham AC, Hancock BC, Cameron RE, Elliott JA. Investigation of particle packing in model pharmaceutical powders using X-ray microtomography and discrete element method. Powder Technol. 2006;167:134–40. [Google Scholar]
- 45.Zhou D, Qiu Y. Understanding material properties in pharmaceutical product development and manufacturing: Powder flow and mechanical properties. J Validat Technol. 2010:65–77. Spring. [Google Scholar]
- 46.Hao T. Tap density equations of granular powders based on the rate process theory and the free volume concept. Soft Matter. 2015;11:1554–61. doi: 10.1039/c4sm02472a. [DOI] [PubMed] [Google Scholar]
- 47.Shah RB, Tawakkul MA, Khan MA. Comparative evaluation of flow for pharmaceutical powders and granules. AAPS PharmSciTech. 2008;9:250–8. doi: 10.1208/s12249-008-9046-8. [DOI] [PMC free article] [PubMed] [Google Scholar]
- 48.Lumay G, Boschini F, Traina K, Bontempi S, Remy JC, Cloots R, et al. Measuring the flowing properties of powders and grains. Powder Technol. 2012;224:19–27. [Google Scholar]
- 49.Chowhan ZT, Yang IC. Powder flow studies IV: Tensile strength and orifice flow rate relationships of binary mixtures. Int J Pharm. 1983;14:231–42. [Google Scholar]
- 50.Crouter A, Briens L. The effect of moisture on the flowability of pharmaceutical excipients. AAPS PharmSciTech. 2014;15:65–74. doi: 10.1208/s12249-013-0036-0. [DOI] [PMC free article] [PubMed] [Google Scholar]
- 51.Bolhuis GR, de Waard H. Compaction properties of directly compressible materials. In: Celik M, editor. Pharmaceutical Powder Compaction Technology. 2nd ed. London: Informa Healthcare; 2011. p. 154. [Google Scholar]
- 52.Zhao N, Augsburge LL. The influence of swelling capacity of superdisintegrants in different pH media on the dissolution of hydrochlorothiazide from directly compressed tablets. AAPS PharmSciTech. 2005;6:E120–6. doi: 10.1208/pt060119. [DOI] [PMC free article] [PubMed] [Google Scholar]
- 53.Pabari R, Ramtoola Z. Effect of a disintegration mechanism on wetting, water absorption, and disintegration time of orodispersible tablets. J Young Pharm. 2012;4:157–63. doi: 10.4103/0975-1483.100021. [DOI] [PMC free article] [PubMed] [Google Scholar]
- 54.Adetunji OA, Odeniyi MA, Itiola OA. Compression, mechanical and release properties of chloroquine phosphate tablets containing corn and trifoliate yam starches as binders. Trop J Pharm Res. 2005;5:589–96. [Google Scholar]
- 55.Alebiowu G, Itiola OA. Compressional characteristics of native and pregelatinized forms of sorghum, plantain, and corn starches and the mechanical properties of their tablets. Drug Dev Ind Pharm. 2002;28:663–72. doi: 10.1081/ddc-120003857. [DOI] [PubMed] [Google Scholar]
- 56.Rojas J, Uribe Y, Zuluaga A. Powder and compaction characteristics of pregelatinized starches. Pharmazie. 2012;67:513–7. [PubMed] [Google Scholar]
- 57.van der Voort Maarschalk K, Bolhuis GK. Improving properties of materials for direct compression. Pharm Technol Europe. 1998;10:28–36. [Google Scholar]
- 58.Adeoye O, Alebiowu G. Flow, packing and compaction properties of novel coprocessed multifunctional directly compressible excipients prepared from tapioca starch and mannitol. Pharm Dev Technol. 2014;19:901–10. doi: 10.3109/10837450.2013.840843. [DOI] [PubMed] [Google Scholar]
- 59.Odeniyi MA, Onyenaka CC, Itiola OA. Powder properties of binary mixtures of chloroquine phosphate with lactose and dicalcium phosphate. Braz J Pharm Sci. 2010;46:531–7. [Google Scholar]
- 60.Rudnic EM, Schwartz JD. Oral solid dosage forms. In: Gennaro AR, editor. Remington: The Science and Practice of Pharmacy. 20th ed. Vol. 1. Philadelphia: Lippincott, Williams & Wilkins; 2000. pp. 858–93. [Google Scholar]
- 61.United States Pharmacopoeia National Formulary. Rockville: US Pharmacopoeial Convention Inc; 2004. p. 2621. [Google Scholar]
- 62.British Pharmacopoeia. Vol. 4. London: Her Majesty Stationery Office; 2009. p. A281. [Google Scholar]
- 63.Goel H, Tiwary AK, Rana V. Fabrication and optimization of fast disintegrating tablets employing interpolymeric chitosan-alginate complex and chitin as novel superdisintegrants. Acta Pol Pharm. 2011;68:571–83. [PubMed] [Google Scholar]
- 64.Malik K, Arora G, Singh I, Arora S. Lallemantia reylenne seeds as superdisintegrant: Formulation and evaluation of nimesulide orodispersible tablets. Int J Pharm Investig. 2011;1:192–8. doi: 10.4103/2230-973X.85973. [DOI] [PMC free article] [PubMed] [Google Scholar]
- 65.Chloroquine phosphate Tablets. [Last accessed on 2015 Jun 25]. Available from: http://www.pharmacopeia.cn/v29240/usp29nf24s0_m16110.html .
- 66.Verbeeck RK, Junginger HE, Midha KK, Shah VP, Barends DM. Biowaiver monographs for immediate release solid oral dosage forms based on biopharmaceutics classification system (BCS) literature data: Chloroquine phosphate, chloroquine sulfate, and chloroquine hydrochloride. J Pharm Sci. 2005;94:1389–95. doi: 10.1002/jps.20343. [DOI] [PubMed] [Google Scholar]
- 67.Saad B, Zin ZM, Jab MS, Rahman IA, Saleh MI, Mahsufi S. Flow-through chloroquine sensor and its applications in pharmaceutical analysis. Anal Sci. 2005;21:521–4. doi: 10.2116/analsci.21.521. [DOI] [PubMed] [Google Scholar]
- 68.Sawadogo CW, Amood Al-Kamarany M, Al-Mekhlafi HM, Elkarbane M, AL-Adhroey AH, Cherrah Y, et al. Quality of chloroquine tablets available in Africa. Ann Trop Med Parasitol. 2011;105:447–53. doi: 10.1179/1364859411Y.0000000030. [DOI] [PMC free article] [PubMed] [Google Scholar]
- 69.Public Assessment Report of the Medicines Evaluation Board in the Netherlands. A-CQ 100: Chloroquine 100 mg Tablets ARTECEF B.V. The Netherlands Chloroquine (As Phosphate) [Last accessed on 2015 Jul 24]. Available from: http://db.cbg-meb.nl/Pars/h106659.pdf .
- 70.Okunlola A, Odeku OA. Evaluation of starches obtained from four Dioscorea species as binding agent in chloroquine phosphate tablet formulations. Saudi Pharm J. 2011;19:95–105. doi: 10.1016/j.jsps.2011.01.002. [DOI] [PMC free article] [PubMed] [Google Scholar]