Abstract
Photoacoustic microscopy (PAM) is a high-contrast, high-resolution imaging modality, used primarily for imaging hemoglobin and melanin. Important applications include mapping of the microvasculature and melanoma tumor margins. We demonstrate a novel PAM design that markedly simplifies the implementation by separating the optical illumination from the acoustic detection path. This modification enables the use of high-quality commercial optics and transducers, and may be readily adapted to commercial light microscopes. The designed PAM system is only sensitive to signals generated in the overlap of the illumination and detection solid angles, providing the additional benefit of quasi-dark-field detection. An off-axis PAM system with a lateral resolution of 26 μm and a modest axial resolution of 410 μm has been assembled and characterized using tissue samples. The axial resolution is readily scaled down to tens of micrometers within the same design, by utilizing commercially available high-frequency acoustic transducers.
Index Terms: Dark field, off-axis, photoacoustic microscopy (PAM)
I. Introduction
Photoacoustic microscopy (PAM) is a hybrid optical and ultrasonic modality that combines optical absorption contrast with optically limited lateral resolution and ultrasonic limited axial resolution. PAM is well suited to mapping microvasculature and other micrometer-scale structures containing strongly absorbing tissue chromophores. PAM is based on the photoacoustic effect, in which pulsed, incident light is absorbed, causing a pressure wave to emit from the absorber due to thermal expansion. These pressure waves can then be detected using a focused ultrasonic transducer to provide depth-encoded absorption contrast signals [1].
The ability of PAM to resolve the morphology of the microvasculature deep inside the living tissue currently has few rivals. With resolutions approaching the size scale of capillaries [2], it has the potential to be the method of choice for interrogating the microvasculature. At this stage in the development of PAM, it is largely limited to laboratories specializing in photoacoustic imaging, in part due to the challenge of implementing the coaxial designs currently in the literature.
Over the past decade, PAM has emerged as a high-contrast imaging modality with applications primarily in the field of biological imaging. PAM has been used to image acute thermal burns 3 mm deep in tissue in order to demarcate burn margins [3]. It has been used to image microvasculature deep beneath the tissue surface for monitoring tumor angiogenesis [4], [5]. Gold nanoshells have been imaged, demarcating the boundaries of tumors in the rat brain [6]. Other implementations of PAM include a dark field design [7] that achieved an estimated lateral and axial resolution of 45 and 15 μm, respectively, and a bright field design [2] using a similar 100 MHz bandwidth ultrasonic transducer that achieved lateral and axial resolutions of 5 and 15 μm, respectively.
Conventional PAM systems, such as the aforementioned systems, use a coaxial configuration for light delivery and ultrasonic detection [2]–[6]. A coaxial configuration requires custom light and acoustic optics that allow the light and pressure waves to travel the same path. We propose and demonstrate a PAM system design with off-axis ultrasonic detection. Off-axis detection enables the separation of the optical illumination and ultrasonic detection paths. Readily available, high-quality optics and ultrasonic transducers may then be used to construct a photoacoustic microscope. An additional benefit of off-axis detection is that chromophores excited outside the numerical aperture (NA) of the acoustic lens will not be detected, thus, providing a quasi-dark-field. The price of off-axis detection is a reduction in axial resolution. An ultrasonic detector capable of 15 μm axial resolution with a coaxial geometry would be reduced to 21 μm with off-axis detection at a 45° angle.
II. Methods and Materials
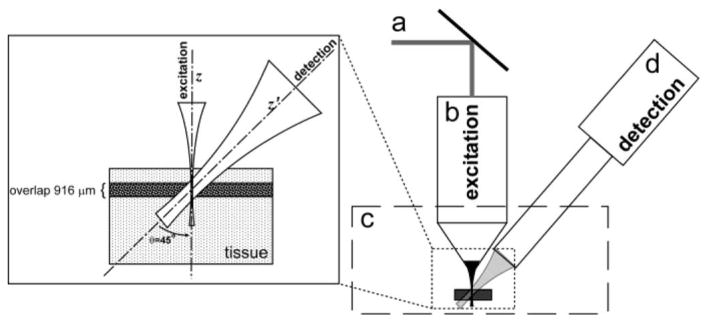
The off-axis PAM system employed a Q-switched, 1064 nm, diode-pumped solid-state laser (SPOT 20–355, Elforlight), frequency tripled to 355 nm. Laser pulses (pulse duration ~ 1.5 ns, repetition rate = 1 kHz) were focused to ~26 μm by underfilling the aperture of a 0.3 NA objective lens (CFI W Plan Fluor 10X/.30 3.5 mm WD, Nikon). The corresponding depth of focus was 3 mm. The laser pulse energy directly after the objective lens was measured to be 700 nJ. The photoacoustic signals were collected using a 6-MHz focused ultrasonic transducer (V310-SU, Olympus NDT) with a 6 mm element size, 80 % (−6 dB) bandwidth, and a NA of 0.23. The ultrasonic transducer was fixed at a 45° angle to the optical axis, as shown in Fig. 1. The resulting photoacoustic signal from the transducer was then amplified through a RF amplifier (ZFL-500LN, Mini-Circuits), providing ~13 dB total amplification. The amplified signal was digitized with a high-speed digital oscilloscope (DPO-7254, Tektronix). An automated microstepping stage (M-562, Newport Corporation) was employed to collect 2-D images and 3-D volumes. Custom software synchronized the microstepping of the stage and the acquisition of data from the oscilloscope for the collection of volumes and cross sections. The data were then stored as photoacoustic B-scan (vertical cross-sectional) images.
Fig. 1.
Schematic diagram of off-axis PAM system. (a) Excitation illumination, 355 nm. (b) 0.3 NA, water immersion optical objective. (c) Water tank with sample. (d) Focused ultrasonic transducer. Inset shows the focal overlap of the excitation and detection.
The maximum permissible exposure for skin set by the American National Standards Institute in the ultraviolet range is 3.5 mJ/cm2. The 355-nm pulses used in this experiment resulted in a surface fluence of 0.99 mJ/cm2, averaged over the 3.5 mm limiting aperture of skin. This fluence approaches, but does not exceed, the permissible limit. Signal averaging could be done in order to lower the fluence of the excitation illumination on the tissue without lowering the SNR. Additionally, if the excitation wavelength was moved to 532 nm, less pulse energy would be required to deposit the same amount of energy into the absorber at a given depth due to the strong wavelength dependence of scattering.
The short excitation wavelength and ultrasonic transducer bandwidth used for these proof of principle experiments was not ideal for most biomedical imaging applications; however, they are adequate to demonstrate the salient features of the off-axis PAM design.
There are several consequences to using off-axis detection. For coaxial detection, converting the time-dependent signal from the detector to axial distance is accomplished by multiplication with the sound velocity in tissue (1.5 mm/μs [2]). However, if the detector is moved off-axis by an angle θ relative to the optical axis (45° as shown in Fig. 1), the distance traveled in the axial dimension (z) is the measured distance traveled (z′) divided by the projection of z onto z′, i.e.,
| (1) |
The axial resolution is similarly affected. Nominally, the axial resolution [full-width at half-maximum (FWHM)] of an ultrasonic transducer can be calculated by dividing the material sound velocity (v) by the transducer bandwidth (BW). Combining this relationship with the angle dependence of z noted earlier yields the axial resolution of an off-axis photoacoustic microscope
| (2) |
Clearly, the highest resolution is achieved in a coaxial geometry (θ= 0). At 30° and 45°, there is a 15 % and 41% reduction in resolution, respectively.
While resolution is negatively affected by off-axis detection, the ability to measure weak signals at depth is enhanced. Off-axis detection has an inherent dark field quality; chromophores excited outside the NA of the ultrasonic detector will not be detected. Strong signals generated at shallow depths will not mask weaker signals deep in the tissue.
The area in the tissue, where signal may be generated and detected is the region of overlap of the laser excitation and the focused detection labeled in the inset of Fig. 1. The overlap region of the transducer along the optical axis is the projection of the transducer beam waist onto the optical axis. The beam waist of a focused transducer can be approximated using an approach analogous to the Gaussian optics approximations for determining beam waist, in which the ratio of focal length to source diameter dictates the beam waist resulting from the focusing lens [8]. The projection of the detection waist at the focus is then
| (3) |
where F is the focal length of the acoustic optics, f is the transducer center frequency, and D is the transducer element diameter. In order to maintain lateral resolution, the overlap region should not exceed the depth of focus of the laser excitation. Within this constraint, overlap may be maximized to improve cross-sectional imaging speed or reduced for improved sensitivity by reducing or increasing the detector NA, respectively.
We should note that (2) and (3) are related by the transducer center frequency. Increasing the BW will nominally increase the center frequency (f). We cannot arbitrarily increase the bandwidth to improve axial resolution while maintaining the same overlap without compensating by modifying the transducer focal length and/or element diameter. A reasonable compromise between imaging speed and sensitivity would be a transducer that yielded an overlap of 5 times the axial resolution; hence, 5 axial pixels would be acquired per A-line. In order to maintain this relationship, the ratio of F/D would need to be ~4.5, a ratio that is readily achieved even in standard high-frequency commercial transducers.
As illustrated by the dark horizontal band in the inset of Fig. 1, a B-scan recorded with off-axis PAM has an axial dimension (or size) defined by the overlap of the laser excitation and the ultrasonic detection. Consequently, if the overlap region is smaller than the depth to be imaged, B-scans at various depths would need to be acquired in order to build up a full cross-sectional image. The number of B-scans required for one cross-sectional image is a function of the desired imaging depth and the excitation/detection overlap.
The angle between the excitation objective and ultrasonic transducer was set to 45° ± 3° using a protractor. The angle was verified by measuring the signal from a human hair at two known axial positions and calculating the angle based upon (1). The axial resolution and overlap were calculated to be 424 and 916 μm, respectively, based upon a 45° angle and the transducer specifications.
III. Results and Discussion
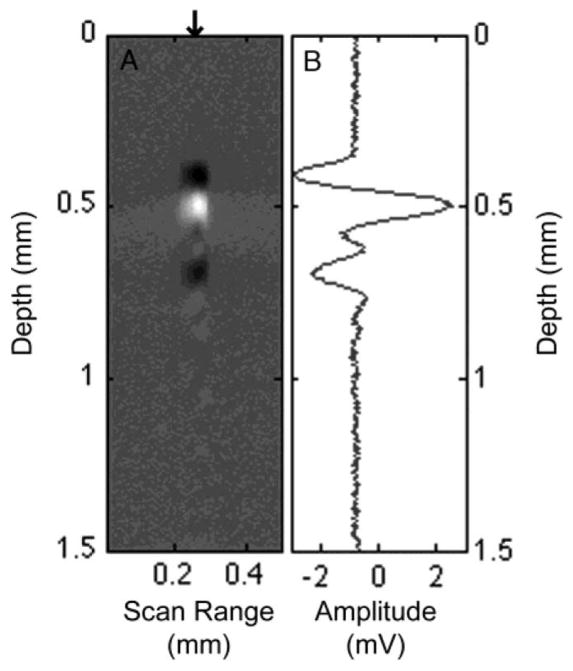
The off-axis PAM system was tested and evaluated by measuring cross-sectional images of a contrived biological sample. The sample consisted of a black (melanin containing) hair as a photoacoustic source embedded in raw chicken breast. The hair was embedded in the chicken breast using a hypodermic needle inserted at an angle into the tissue to allow continuous depth variation of the absorber. The sample was submerged in water to act as a coupling medium for the ultrasonic detector. The diameter of the black hair was estimated to be 65 μm under a light microscope. A raw B-scan of the hair embedded at a depth of ~500 μm in the chicken breast is shown in Fig. 2(a). The B-scan was obtained by translating the sample orthogonal to the excitation and collecting an A-line at each lateral position separated by 3 μm. The A-lines were then combined to form a 2-D B-scan image.
Fig. 2.
(a) B-scan image of a 65 μm human hair embedded ~500 μm in chicken breast tissue. (b) A-scan corresponding to the center of the hair sample indicated by the arrow in (a).
The FWHM of the hair in the lateral dimension of the PAM image [see Fig. 2(a)] was 70 μm, in good agreement with the light microscope measurement. The FWHM of the hair in the axial dimension was 410 μm, estimated by measuring the FWHM of the envelope of the photoacoustic signal collected from a single A-line. Given the known diameter of the hair (65 μm), the measured axial FWHM should be a reasonable approximation of the axial resolution. The measured FWHM in both dimensions are consistent with our expected lateral (26 μm) and axial (424 μm) resolutions. The axial resolution can readily be improved by utilizing higher frequency transducers. Using a 50-MHz center frequency transducer (V358-SU, Olympus NDT), with an 80% bandwidth and nominal element size of 0.25 in, would provide an axial resolution of 53 μm in the current system. Similarly, using a 100-MHz transducer, as in [2] and [7], would yield an axial resolution of 21 μm.
As we move to higher frequency transducers, acoustic attenuation will become an important issue. The acoustic attenuation in water (and presumably water-based acoustic coupling gel) is ~0.15 dB/mm at 25 MHz and ~2 dB/mm at 100 MHz [9]. The physical geometry of off-axis PAM enables the placement of the ultrasonic transducer at the minimum distance from the sample with no obstructions between the sample and transducer. This may prove to be an additional advantage of off-axis PAM over designs that incorporate long-working distance ultrasonic transducers and/or require the propagation of the acoustic wave through the laser excitation optics to achieve coaxial detection.
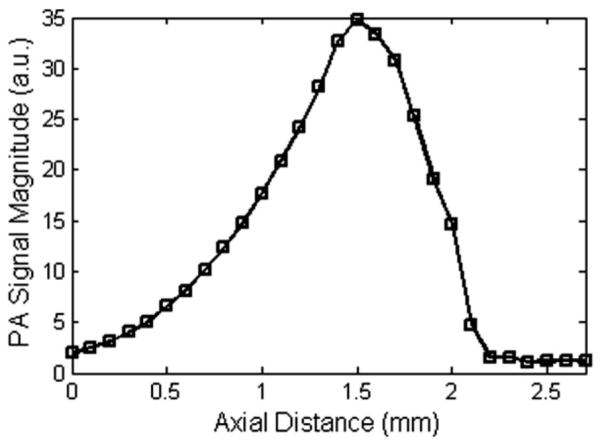
A series of measurements have been made to map out the excitation/detection overlap region and to illustrate the quasi-dark-field property inherent to off-axis PAM. A black human hair (diameter ~100 μm) submerged in water was translated in the axial dimension through the focus of the ultrasonic transducer. Photoacoustic B-scans were recorded at 100 μm axial increments. Each point in Fig. 3 represents the maximum amplitude in each B-scan plotted against the axial position. Since the hair diameter was approximately an order of magnitude smaller than the theoretical overlap and the depth of focus of the excitation was 3 mm, we expect the line shape in Fig. 3 to be a good approximation to the excitation/detection overlap. The FWHM of the measured overlap was ~900 μm, which was in good agreement with the theoretical overlap of 916 μm derived from (3). Our results verify the quasi-dark-field property of off-axis PAM.
Fig. 3.
Map of the excitation/detection overlap. Maximum signal intensity was measured as a function of axial distance. The FWHM of the overlap was 900 μm.
In the design of an off-axis PAM system, the overlap region may be tuned by changing the NA and/or changing the center frequency of the ultrasonic transducer. For instance, using a 25 MHz center frequency transducer with a similar NA would yield an overlap of 219 μm in the current system. For the fastest imaging speed, a large overlap would be desirable in order to maximize the depth region probed in a single B-scan. For high sensitivity, the overlap region should be reduced in order to strongly attenuate photoacoustic signals away from the center of the overlap.
IV. Conclusion
In conclusion, we have developed a novel photoacoustic microscope design, which substantially simplifies construction by enabling the use of unmodified commercial optics and ultrasonic transducers. Moreover, the simple design may be readily incorporated into a standard light microscope, thus, providing a familiar imaging platform for clinical researchers. We have derived the appropriate equations to describe the relevant design parameters and verified the equations via measurements made on our prototype off-axis PAM system. A consequence of the simple design is a reduction in axial resolution compared to coaxial designs. The reduction is inversely proportional to the cosine of the angle between excitation and detection and equal to 15% and 41% for angles of 30° and 45°, respectively. In addition to design simplicity, the off-axis geometry may provide enhanced sensitivity from quasi-dark-field detection and a reduced sample to transducer distance that will help mitigate the problem of high acoustic attenuation inherent to high-resolution, high-frequency transducers.
Acknowledgments
This work was supported in part by the National Institutes of Health under Grant R21EB007729.
The authors would like to thank J. Jo for the use of the laser system.
Contributor Information
Ryan L. Shelton, Email: shelton8r@gmail.com, Department of Biomedical Engineering, Texas A&M University, College Station, TX 77843 USA
Brian E. Applegate, Email: apple@tamu.edu, Department of Biomedical Engineering, Texas A&M University, College Station, TX 77843 USA.
References
- 1.Wang LV, Wu H-i. Biomedical Optics: Principles and Imaging. Hoboken, NJ: Wiley-Interscience; 2007. [Google Scholar]
- 2.Maslov K, Zhang HF, Hu S, Wang LV. Optical-resolution photoacoustic microscopy for in vivo imaging of single capillaries. Opt Lett. 2008 May 1;33:929–931. doi: 10.1364/ol.33.000929. [DOI] [PubMed] [Google Scholar]
- 3.Zhang HF, Maslov K, Stoica G, Wang LV. Imaging acute thermal burns by photoacoustic microscopy. J Biomed Opt. 2006 Sep-Oct;11:054033-1–054033-5. doi: 10.1117/1.2355667. [DOI] [PubMed] [Google Scholar]
- 4.Oh JT, Li ML, Zhang HF, Maslov K, Stoica G, Wang LV. Three-dimensional imaging of skin melanoma in vivo by dual-wavelength photoacoustic microscopy. J Biomed Opt. 2006 May-Jun;11:034032-1–034032-4. doi: 10.1117/1.2210907. [DOI] [PubMed] [Google Scholar]
- 5.Zhang HF, Maslov K, Stoica G, Wang LV. Functional photoacoustic microscopy for high-resolution and noninvasive in vivo imaging. Nat Biotechnol. 2006 Jul;24:848–851. doi: 10.1038/nbt1220. [DOI] [PubMed] [Google Scholar]
- 6.Li ML, Wang JC, Schwartz JA, Gill-Sharp KL, Stoica G, Wang LV. In-vivo photoacoustic microscopy of nanoshell extravasation from solid tumor vasculature. J Biomed Opt. 2009 Jan-Feb;14:010507-1–010507-3. doi: 10.1117/1.3081556. [DOI] [PMC free article] [PubMed] [Google Scholar]
- 7.Maslov K, Stoica G, Wang LV. In vivo dark-field reflection-mode photoacoustic microscopy. Opt Lett. 2005 Mar 15;30:625–627. doi: 10.1364/ol.30.000625. [DOI] [PubMed] [Google Scholar]
- 8.Olympus NDT. Ultrasonic Transducers Technical Notes. 2006 Nov 6; [Online]. Available: http://www.olympusims.com/data/File/panametrics/UT-technotes.en.pdf.
- 9.Daft CM, Briggs GA, Obrien WD. Frequency dependence of tissue attenuation measured by acoustic microscopy. J Acoust Soc Amer. 1989 May;85:2194–2201. doi: 10.1121/1.397868. [DOI] [PubMed] [Google Scholar]


