Abstract
Background:
As herbal medicines have an important position in health care systems worldwide, their current assessment, and quality control are a major bottleneck. Cortex Phellodendri chinensis (CPC) and Cortex Phellodendri amurensis (CPA) are widely used in China, however, how to identify species of CPA and CPC has become urgent.
Materials and Methods:
In this study, multivariate analysis approach was performed to the investigation of chemical discrimination of CPA and CPC.
Results:
Principal component analysis showed that two herbs could be separated clearly. The chemical markers such as berberine, palmatine, phellodendrine, magnoflorine, obacunone, and obaculactone were identified through the orthogonal partial least squared discriminant analysis, and were identified tentatively by the accurate mass of quadruple-time-of-flight mass spectrometry. A total of 29 components can be used as the chemical markers for discrimination of CPA and CPC. Of them, phellodenrine is significantly higher in CPC than that of CPA, whereas obacunone and obaculactone are significantly higher in CPA than that of CPC.
Conclusion:
The present study proves that multivariate analysis approach based chemical analysis greatly contributes to the investigation of CPA and CPC, and showed that the identified chemical markers as a whole should be used to discriminate the two herbal medicines, and simultaneously the results also provided chemical information for their quality assessment.
SUMMARY
Multivariate analysis approach was performed to the investigate the herbal medicine
The chemical markers were identified through multivariate analysis approach
A total of 29 components can be used as the chemical markers.
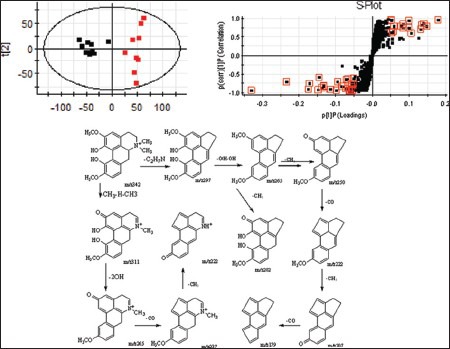
UPLC-Q/TOF-MS-based multivariate analysis method for the herbal medicine samples
Abbreviations used: CPC: Cortex Phellodendri chinensis, CPA: Cortex Phellodendri amurensis, PCA: Principal component analysis, OPLS-DA: Orthogonal partial least squares discriminant analysis, BPI: Base peaks ion intensity
Keywords: Constituents, Cortex Phellodendri amurensis, Cortex Phellodendri chinensis, herbal medicine, multivariate analysis approach
INTRODUCTION
In traditional medicine, herbal medicines have been practiced for hundreds, even thousands of years in the prevention, and treatment of human diseases.[1] Up to date, herbal medicines still attract the interest of both patients and scientists. Cortex Phellodendri (Huangbai in traditional Chinese Medicine) has been used as an herbal medicine to treat dysentery, jaundice, urinary infection, and rheumatoid arthritis for more than a 1000 years in China.[2] It is derived from the dried bark of Phellodendron chinensis Schneid. or Phellodendron amurense Rupr. (Family Rutaceae). Correspondingly, the two species of herbs are known as Cortex Phellodendri chinensis (CPC, Chuanhuangbai in Southwest China) and Cortex Phellodendri amurensis (CPA, Guanhuangbai in Northeast China), respectively. In clinical applications, the two herb species are used interchangeably because they are believed to share the similar clinical efficacy and were officially included under the name “Huangbai” in Chinese Pharmacopoeia until the 2005 edition. CPA as a plant medicine has been paid more attentions to prevent prostate cancer and osteoarthritis.[3,4] However, the chemical studies about these herbal medicines have demonstrated that the contents of the major quaternary alkaloids between CPC and CPA were significantly different.[5] It has begun to raise doubts about the bioequivalence of the two herbal species.[6,7] Nowadays, CPC and CPA have been included in the 2010 edition of Chinese Pharmacopoeia in their respective monograph, respectively.[8] Therefore, how to identify species and control the quality of CPA and CPC has become urgent.
The World Health Organization has accepted fingerprint analysis as a methodology for the assessment of herbal medicines. Because of the complexity of herbal medicines, a problem that minor differences between strongly related species may not be observed but can largely affect the health of the patient, can successfully be solved by multivariate methods such as principal component analysis (PCA) and orthogonal partial least squares discriminant analysis (OPLS-DA) that visualize the information in the phytochemical fingerprints.[9,10,11] Plant metabolomics analyzes globally the diverse metabolites produced in cell and organisms and further performs the selection and identification of marker metabolites based on the nontargeted or widely targeted metabolite fingerprints and the multivariate analysis[12,13] This technology has been increasingly applied to the evaluation of the qualities of herbal medicines[14] and the discrimination of species,[15] locations,[16] parts of a plant,[17] collection period,[18] and processing methods.[19] Therefore, metabolomics has a great potential as a reasonable and suitable approach for comprehensive analysis of chemical profiling and identification of discrimination markers in herbal medicines.
Previous studies on chemical analysis and differences between CPC and CPA had been reported,[9,10] and a few major marker compounds have been used to evaluate their quality. In this paper, the plant metabolomics approach based on ultra-performance liquid chromatography-quadrupole/time-of-flight high-definition mass spectrometry (UPLC-Q/TOF-HDMS) and multivariate analysis was used to comprehensively analyze and compare the wide spectrum of compositions with diverse chemical characteristics and varied concentration of CPA and CPC. The obtained results should provide the thorough chemical markers of CPA and CPC for further establishing their quality discrimination methods.
MATERIALS AND METHODS
Solvents and chemicals
Acetonitrile (HPLC grade) and methanol (HPLC grade) were purchased from Merck Company (Darmstadt, Germany). Formic acid (FA) (HPLC grade) was purchased from Tianjin Kemio Chemical Agent Company (Tianjin, China). The distilled water was purchased from Watson Group Ltd. (Hong Kong, China). Leucine enkephalin, which was used as the reference substance in the TOF-mass spectrometry (MS) detection, was purchased from Sigma (St. Louis, MO, USA). The standards (>98%) including phellodendrine, magnoflorine, jatrorrhizine, palmatine, berberine, limonene, and obacunone were purchased from the National Institute for Pharmaceutical and Biological Products (Beijing, China).
Plant materials
Ten batches of herbal samples of CPA were purchased from the herbal medicine markets in Heilongjiang Province of China, and eight batches of herbal samples of CPC from the herbal medicine markets in Sichuan Province of China. All of the herbal samples of CPA and CPC were identified as authentic species according to the 2010 edition of Chinese Pharmacopoeia. A sample of each batch was kept in the National TCM Key Lab of Serum Pharmacochemistry, Heilongjiang University of Chinese Medicine.
Extraction of plant samples
Each herbal sample was pulverized, and the powder was sieved through 200 m sieves. 0.10 g of the powdered sample was ultrasonically extracted using 10.0 mL 75% methanol at room temperature for 80 min. The resulting solution was then filtered through a 0.22 μm filter membrane, and 3.0 μL aliquot of the solution was injected for UPLC-MS analysis in negative mode. The solution was diluted 10-folds, and 3.0 μL was injected for analysis in positive mode.
Liquid chromatography conditions
The chromatographic separation was carried out using a Waters ACQUITY UPLC™ system (Waters Corp., Milford, USA).. An ACQUITY HSS T3 chromatography column (2.1 mm × 100 mm, 1.7 μm) was used and maintained at 25°C. The mobile phase was composed of phase A (water with 0.1% FA) and phase B (acetonitrile containing 0.1% FA), and the flow rate was set at 0.3 mL/min. The gradient elution program was as follows: 0–5 min, 10–20% B; 5–8 min, 20–25% B; 8–11 min, 25–35% B; 11–14 min, 35–99% B; 14–15 min, 99% B; 15–15.5 min, 99–10% B; and 15.5–18 min, 10% B. The eluent was introduced directly to the mass spectrometry without a split.
Mass spectrometer conditions
A Waters SYNAPT™ HDMS™ system (Waters Corp., Milford, USA). equipped with an electrospray ionization (ESI) source and hybrid Q/TOF-MS was utilized. The full-scan MS data with accurate mass measurement was acquired at positive and negative ion mode from 50 Da to 1000 Da with a 0.3 s scan time, respectively. The optimal capillary voltage was set at 3000 V for ESI+ and 2600 V for ESI−, and the sample cone voltage at 40 V, the extraction cone voltage at 4 V. Nitrogen was used as the dry gas; the desolvation gas flow rate was set at 500 L/h, and the con gas flow rate was maintained at 50 L/h. The desolvation temperature was set at 350°C and the source temperature at 110°C. All the data were acquired using an independent reference lock mass via the LockSpray™ interface to ensure accuracy and reproducibility during the MS analysis. Leucine enkephalin was used as the reference compound ([M + H]+ =556.2771 at the positive ion mode and [M − H]− =554.2615 at the negative ion mode) at a concentration of 0.2 ng/mL under a flow rate of 100 μL/min. The data were collected in the centroid mode, and the LockSpray frequency set at 10 s and averaged over 10 scans for the correction.
Data analysis
The UPLC-TOF/MS data of all determined samples were processed by the Markerlynx XS software (Waters Corporation, Milford, USA) for peak selection and peak alignment. The obtained three-dimensional datasets comprising tR-m/z pair, ion intensity, and sample code were subjected to the PCA to generate the scores plot in which the observations representing the determined samples were clustered to evaluate the separation of the chemical profiling of the two species. Subsequently, the OPLS-DA was used to mine the potential chemical markers significantly contributing to discrimination of CPA and CPC. The potential markers were identified either by comparing the retention time (RT) and mass spectrometry data with that of reference compounds or by mass spectrometry analysis and retrieving the reference literatures.
The parameters for data processing were set as follows: RT range 0.5–14.0 min, mass range 100–1000 Da, RT tolerance 0.2 min, mass tolerance 0.02 Da, and peak intensity threshold 100. The peak width at 5% height and the peak-to-peak baseline noise were automatically determined. Smoothing was not applied during the deconvolution procedure. Noise elimination was automatically applied. Isotopic peaks were excluded for analysis. No specific mass or adduct was excluded. Pareto scaling of data was performed prior to PCA, which generated the less noise level than other scaling method such as mean centering and dividing by standard deviation.
RESULTS AND DISCUSSION
Selection of extraction methods
Extraction conditions were optimized to obtain more and higher chromatographic peaks. By testing the different concentrations of methanol solvents (50%, 75%, 100%) and the time of ultrasonic extraction (30 min, 45 min, 60 min), the method of extracting ultrasonically for 30 min with 75% methanol showed the greatest number of detectable components.
Optimization of chromatographic and mass spectrometric conditions
0.1% of FA was added to the mobile phase to achieve higher and narrower peaks. Besides, using the slower flow rate of 0.3 mL/min and the lower column temperature of 25°C, the chromatographic peaks were well separated. To obtain the global chemical profiling of the herbal medicine, MS spectra were acquired in both positive and negative ion modes. The effects of capillary voltage, sample cone voltage, extraction cone voltage, source temperature, desolvation temperature, and desolvation gas flow rate on the intensity of total ion current of the sample solution were examined (see materials and method).
Multivariate analysis of chemical profiling
Ten batches of CPA samples and eight batches of CPC samples were processed and the resulting solutions were determined according to the chromatographic and mass spectrometric conditions described above. The typical base peaks ion intensity (BPI) chromatograms of CPA and CPC were displayed in Figure S1. Visually comparing the BPI chromatograms of CPA and CPC, it was found that the chemical profiling of the two herbal medicines was significantly different. Obviously, the peak of m/z 336.1232 at tR 9.99 min (identified as berberine) was higher in CPC, and the peak of m/z 352.1222 at tR 9.11 min (identified as palmatine) was higher in CPA, which had been well-known previously. In this report, the multivariate analysis methods including PCA and OPLS-DA were applied to obtain the comprehensive information on the chemical markers of CPA versus CPC for discrimination of the two herbal medicines and establishment of efficient quality control method. The multiple analyses of the CPA and CPC samples by UPLC-Q/TOF-MS analysis were showed in Figure 1. After Pareto scaling, the data were analyzed with PCA. The PCA scores plot in the (+) ESI mode displayed in Figure 1a showed that the determined samples clearly clustered into two groups. The PCA scores plot in the (−) ESI mode displayed in Figure 1b also showed the clear separation between the CPA group and the CPC group. Further, OPLS-DA was performed to mine the variables for discriminating the two groups. In the OPLS-DA S-plot [Figure 1c–e], each variable point represents an ion pair tR-m/z; the X-axis represents variable contribution, where the farther away the variable from the original point, the greater the contribution to the separation of groups; the Y-axis represents variable confidence, where the further away the variable from the original point, the higher the confidence level of the ion to the separation of groups. Thus, the variables at the two ends of the “S” sharp are the ones of interest, namely the potential characteristic chemical markers. In this report, the variables with the confidence more than 0.5 and the contribution more than 0.05 were selected for the potential chemical markers contributing most to the difference between the two herbal medicines. It had been well-known that berberine and palmatine are significantly different between CPA and CPC, which can be also observed easily in the chromatograms of CPA and CPC shown in Figure 1c. In order to thoroughly understand the difference in chemical components of the two herbal medicines, the two variables representing berberine and palmatine were removed to exclude the effect of the two components on separation of the groups. Besides, the variable importance parameter (VIP) value was also an important parameter for the separation of the groups, and the variables whose value more than three was believed to be the potential markers, the VIP plot in (−) ESI mode was showed in Figure 1f. As a result, in the (+) ESI mode, 13 variables were selected; of them, nine variables located at the bottom of the “S” sharp had higher MS responsive values in CPA, while four variables located at the top of the “S” sharp had higher responsive values in CPC. In the (−) ESI mode, 19 variables were selected; 12 of them were higher in CPA while seven of them were higher in CPC. The relative information of the selected variables was listed in Table S1.
Figure S1.
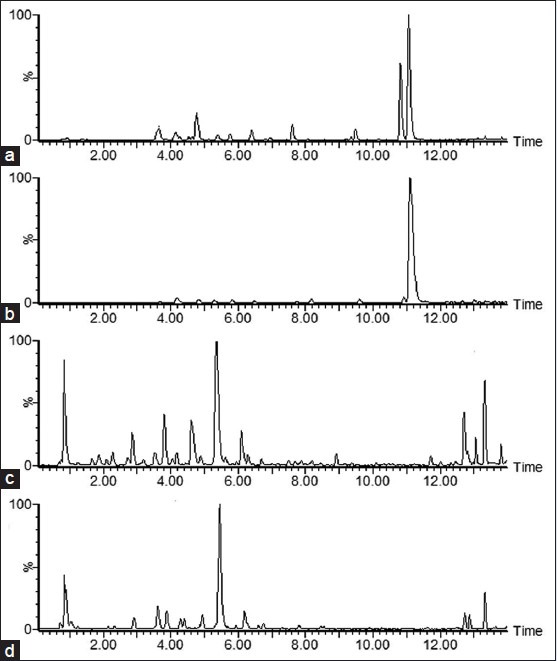
The typical base peaks ion intensity chromatograms in positive mode ([a] Cortex Phellodendri amurensis; [b] Cortex Phellodendri chinensis) and in negative mode ([c] Cortex Phellodendri amurensis; [d] Cortex Phellodendri chinensis)
Figure 1.
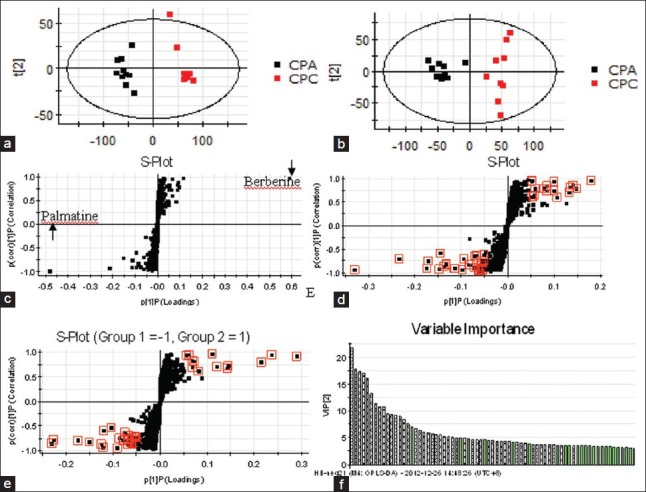
The multiple analyses of the Cortex Phellodendri amurensis and Cortex Phellodendri chinensis samples by ultra-performance liquid chromatography-quadrupole/time-of-flight mass spectrometry analysis (a) principal component analysis scores plots in (+) ESI mode; (b) principal component analysis scores plots in (−) ESI mode; (c) the S-plot in (+) ESI mode; (d) the S-plot in (+) ESI mode when the ions were except m/z 336 and m/z 352; (e) the S-plot in (−) ESI mode; and (f) the variable importance parameter column plot of the ions whose variable importance parameter value is more than three in (−) ESI mode. The ions in red box were choose to be the potential markers in S-plots, and the white columns in variable importance parameter plot were present the corresponding ions in S-plot. ESI: Electrospray ionization
Table S1.
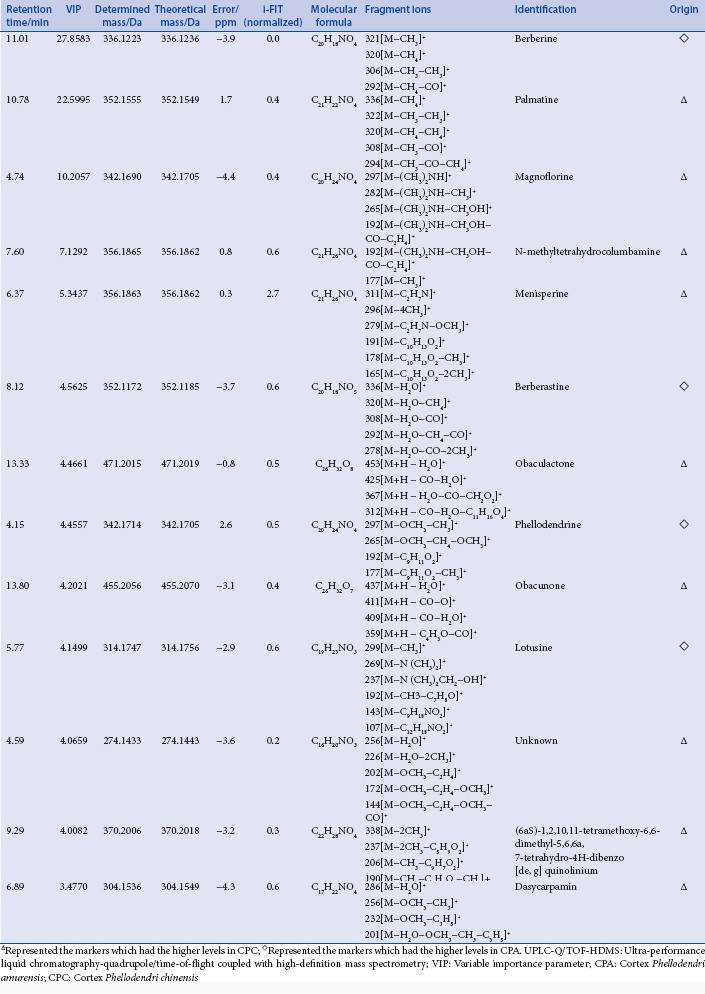
The candidate ions and identification results in the positive ion mode by UPLC-Q/TOF-HDMS
Identification of chemical markers
The SYNAPT HDMS system in this study was equipped with the ESI source and hybrid Q/TOF-MS. Utilizing this system, the mass accuracy for all acquired ions was almost less than 5 ppm, and their isotopic pattern could be determined exactly. The latter was regarded as the more efficacious method to confirm the elemental composition. Normally, the normalized i-FIT score (the likelihood that the isotopic pattern of the elemental composition matches a cluster of peaks in the spectrum) of an accurate elemental composition which was generated with the elemental composition tool of the Mass Lynx software (Waters Corporation, Milford, USA) was close to 0, while that of other elemental compositions generated were usually more than 1.0. Thus, through determining the exact mass difference and the normalized i-FIT score, molecular formula of each candidate ion was confirmed. Further, by elucidating carefully their MS/MS spectra and comparing their fragment ions with those of the reference compounds or those reported in the reference literatures, the candidate ions were identified tentatively. For example, using the elemental composition tool, the elemental composition of the candidate ion of m/z 342.1695 at 4.16 min and 4.76 min was calculated to be C20H24NO4 with the mass difference of −2.9 ppm or 1.5 ppm and the normalized i-FIT score of 0.2. Its molecular formula was identical to that of phellodenrine and magnoflorine which were both known components found in CP. Further, the fragment ions of m/z 192 and m/z 177 which were characteristic fragment ions of phellodenrine were observed in the MS/MS spectrum. Some candidate ions had the same RT, such as the three ions of m/z 409.1998, m/z 477.1902, m/z 455.2056 at 13.83 min. In the MS/MS spectrum of the ion of m/z 455.2056, the fragment ion of m/z 409.1998 could be observed [Figure 2]. Thus the candidate ion of m/z 409.4998 was generated because of the in-source collision-induced dissociation, and identified as the fragment ion of the ion of m/z 455.2056, while the ion of m/z 477.19025 was identified as the (M + Na)+ ion of the ion of m/z 455.2056. After the fragment or adduct ions generated were removed, 13 candidate marker ions in positive ionization mode including palmatine and berberine and 19 candidate marker ions in negative ionization mode were identified. The identification results were shown in Tables S1 and S2. However, the molecule ions of phellodendrine and the quasimolecule ions of obaculactone and obacunone were determined simultaneously in positive and negative ionization modes. Thus, altogether 28 components were identified as chemical markers to discriminate and differentiate CPA and CPC. Phellodendrine, magnoflorine, obacunone, menisperine, berberine, and obaculactone were confirmed by comparing with their authentic substances while other marker ions were identified tentatively.
Figure 2.
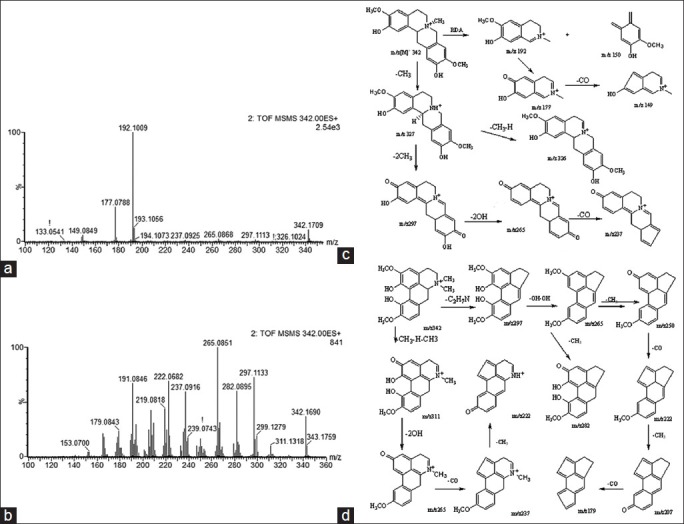
Mass spectra of phellodenrine and magnoflorine in positive mode. (a) Product ion spectrum of biomarker phellodenrine in positive ion mode; (b) product ion spectrum of biomarker magnoflorine; (c) the proposed mass spectrometry fragmentation mechanism of phellodenrine; and (d) the proposed mass spectrometry fragmentation mechanism of magnoflorine
Table S2.
The candidate ions and identification results in the negative ion mode by UPLC-Q/TOF-HDMS
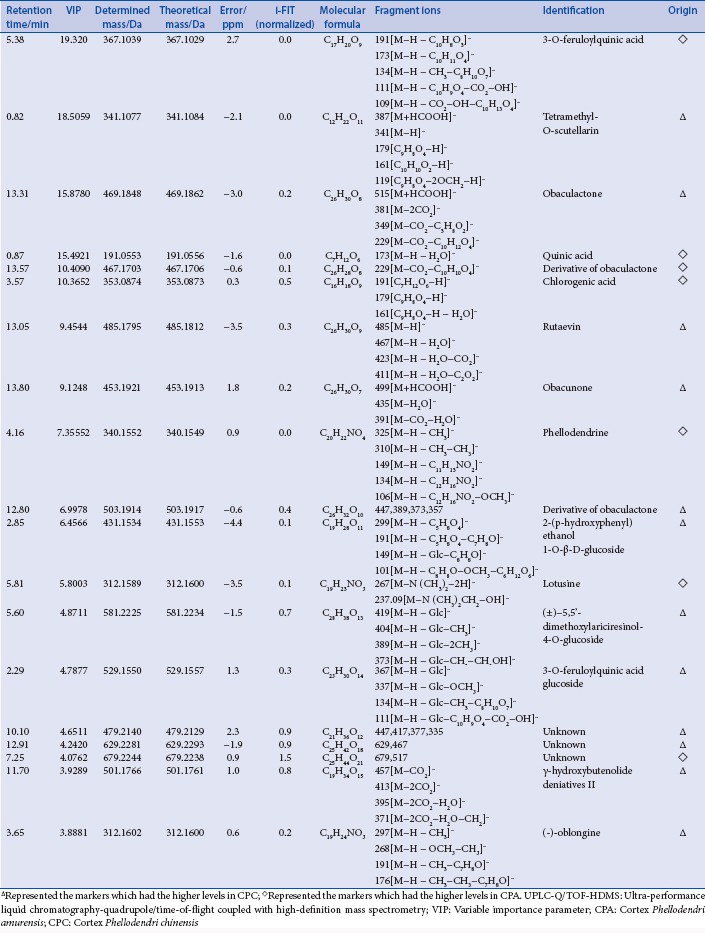
Changes of relative intensity of chemical markers
Metabolomics employs multivariate analysis to statistically process the massive amount of metabolite data resulting from high-throughput and nontargeted or widely targeted metabolite analysis. One advantage of the methodology is that medicinal plants are evaluated based not only on the limited number of metabolites that are important chemicals in the content but also on the fingerprints of minor metabolites and bioactive chemicals.[20,21,22,23,24] PCA based on the metabolite accumulation patterns clearly showed differences between CPA and CPC by UPLC-HDMS analysis, and palmatine and barberine are major components for discrimination of the two species, and used for quality control of the two herbal medicines. However, it has been long recognized that the efficacy of Chinese herbal medicines is usually attributed to multiple compounds, but not a single compound. In order to more clearly characterize the action of the two herbs, the expression level of markers identified was analyzed to illustrate the reason of clinical application. The peak intensity ratios of the marker ions between CPA and CPC were shown in Figure 3, and were significantly different (P < 0.01).
Figure 3.
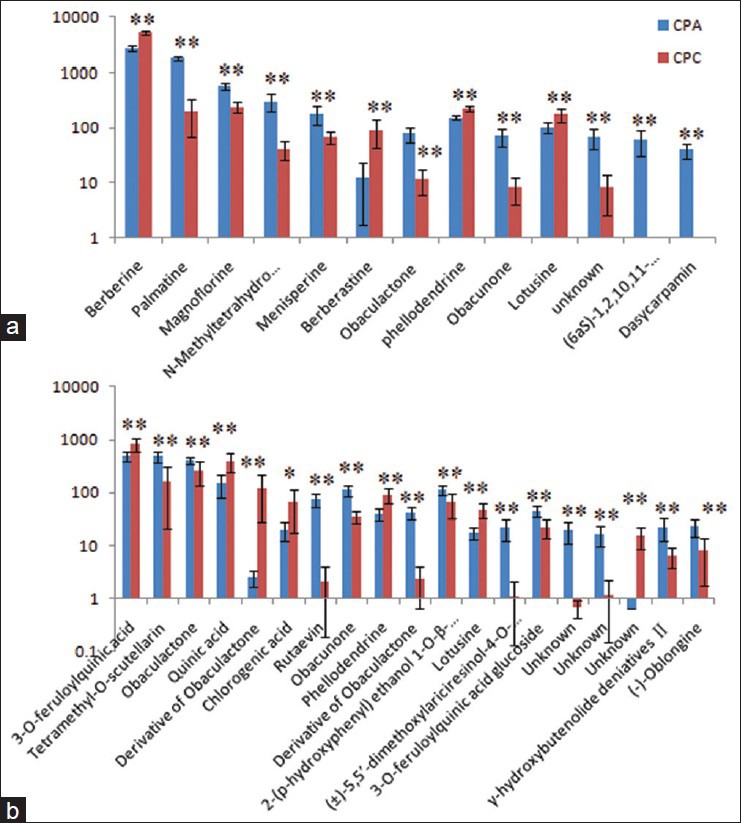
Graphical representation of relative intensity of markers between Cortex Phellodendri amurensis and Cortex Phellodendri chinensis. The graph displays significant changes in the metabolite level (relative changes; data are standardized). (a) In positive mode (b) in negative mode
In this study, the higher contents of berberine, berberastine, phellodendrine, and chlorogenic acid were found in CPC, whereas CPA showed the higher levels of palmatine, tetramethyl-o-scutellarin, and limonoids. Traditionally, CPC and CPA are used interchangeably because they are believed to share the same clinical efficacy. However, CPC and CPA are from two different plant species, and the former grows usually in Southwest China, while CPA in Northeast China and Korean Peninsula. The great differences at growing locations and climate conditions as well as species result in the significant variation of chemical phenotype inevitably. In the tentatively identified chemical markers, berberine, and 3-o-feruloylquinic acid with the antidiarrheal, antibacterial, and anti-inflammatory activities are higher in CPC, while obaculactone and obacunone with the neuroprotective and anticancer activity are higher in CPA. The result may help to clarify the traditional effect of “qingre” of CPC and “jiang xianghuo” of CPA. Therefore, the report not only provided a comprehensive discrimination method of CPA versus CPC, but also provided helpful chemical information for further quality control and active mechanism research.
CONCLUSION
In this study, we employed successfully the UPLC-Q/TOF-HDMS and multivariate statistical analysis to identify the chemical markers of CPA versus CPC for discrimination of the two herbal medicines. A total of 29 components can be used as the chemical markers for discrimination of CPA and CPC. Of them, phellodenrine is significantly higher in CPC than in CPA, whereas obacunone and obaculactone are significantly higher in CPA than in CPC. These chemical markers as a whole should be used to discriminate the two herbal medicines, and simultaneously the results also provided chemical information for their quality assessment.
Financial support and sponsorship
This work was supported by grants from the Key Program of Natural Science Foundation of State (grant no. 81430093, 81173500, 81373930, 81302905, 81202639), National Key Technology Research and Development Program of the Ministry of Science and Technology of China (grant no. 2011BAI03B03, 2011BAI03B06, 2011BAI03B08), specialized research fund for the Doctoral Program of Higher Education (grant no. 20122327120006), fund project of Heilongjiang Provincial Department of Education (grant no. 12521498), Natural Science Foundation of Heilongjiang Province of China (H2015038).
Conflicts of interest
There are no conflicts of interest.
ABOUT AUTHOR

Xijun Wang
Xijun Wang, is a Professor and the vice president at the Heilongjiang University of Chinese Medicine, China. His research interest is in the area of Serum pharmacochemistry of TCM and innovative drug design. His findings have scientific values of mining TCM prescriptions, innovative drug design based on clinical experience, enhancing the academic level and clinical efficacy of Chinese medicine.
REFERENCES
- 1.Ling Y, Li Z, Chen M, Sun Z, Fan M, Huang C. Analysis of multiple constituents in Cong-Ming-Tang, a Chinese herbal formula for the treatment of amnesia, by high-performance liquid chromatography with quadrupole time-of-flight mass spectrometry. Phytochem Anal. 2013;24:677–88. doi: 10.1002/pca.2454. [DOI] [PubMed] [Google Scholar]
- 2.Ren L, Xue X, Zhang F, Xu Q, Liang X. High performance liquid chromatography-mass spectrometry analysis of protoberberine alkaloids in medicine herbs. J Sep Sci. 2007;30:833–42. doi: 10.1002/jssc.200600246. [DOI] [PubMed] [Google Scholar]
- 3.Oben J, Enonchong E, Kothari S, Chambliss W, Garrison R, Dolnick D. Phellodendron and Citrus extracts benefit joint health in osteoarthritis patients: A pilot, double-blind, placebo-controlled study. Nutr J. 2009;8:38. doi: 10.1186/1475-2891-8-38. [DOI] [PMC free article] [PubMed] [Google Scholar]
- 4.Ghosh R, Graham H, Rivas P, Tan XJ, Crosby K, Bhaskaran S, et al. Phellodendron amurense bark extract prevents progression of prostate tumors in transgenic adenocarcinoma of mouse prostate: Potential for prostate cancer management. Anticancer Res. 2010;30:857–65. [PubMed] [Google Scholar]
- 5.Kumar AP, Graham H, Robson C, Thompson IM, Ghosh R. Natural products: Potential for developing Phellodendron amurense bark extract for prostate cancer management. Mini Rev Med Chem. 2010;10:388–97. doi: 10.2174/138955710791330936. [DOI] [PubMed] [Google Scholar]
- 6.Xian YF, Mao QQ, Ip SP, Lin ZX, Che CT. Comparison on the anti-inflammatory effect of Cortex Phellodendri chinensis and Cortex Phellodendri amurensis in 12-O-tetradecanoyl-phorbol-13-acetate-induced ear edema in mice. J Ethnopharmacol. 2011;137:1425–30. doi: 10.1016/j.jep.2011.08.014. [DOI] [PubMed] [Google Scholar]
- 7.Chen ML, Xian YF, Ip SP, Tsai SH, Yang JY, Che CT. Chemical and biological differentiation of Cortex Phellodendri Chinensis and Cortex Phellodendri amurensis. Planta Med. 2010;76:1530–5. doi: 10.1055/s-0030-1249774. [DOI] [PubMed] [Google Scholar]
- 8.Beijing: Chemical Industry Press; 2010. Pharmacopoeia Commission of the Ministry of Public Health of PRC. Chinese Pharmacopoeia, Part 1; pp. 286–7. [Google Scholar]
- 9.Wang X, Zhang A, Yan G, Han Y, Sun H. UHPLC-MS for the analytical characterization of traditional Chinese medicines. Trends Analyt Chem. 2014;63:180–7. [Google Scholar]
- 10.Xue C, Zhang A, Sun H, Han Y, Zou D, Wang Y, et al. An improved ultra-performance liquid chromatography-electrospray ionization/quadrupole-time-of-flight high-definition mass spectrometry method for determining ingredients of herbal Fructus corni in blood samples. Pharmacogn Mag. 2014;10:422–9. doi: 10.4103/0973-1296.141796. [DOI] [PMC free article] [PubMed] [Google Scholar]
- 11.Wang P, Yin QW, Zhang AH, Sun H, Wu XH, Wang XJ. Preliminary identification of the absorbed bioactive components and metabolites in rat plasma after oral administration of Shaoyao-Gancao decoction by ultra-performance liquid chromatography with electrospray ionization tandem mass spectrometry. Pharmacogn Mag. 2014;10:497–502. doi: 10.4103/0973-1296.141774. [DOI] [PMC free article] [PubMed] [Google Scholar]
- 12.Sumner LW, Mendes P, Dixon RA. Plant metabolomics: Large-scale phytochemistry in the functional genomics era. Phytochemistry. 2003;62:817–36. doi: 10.1016/s0031-9422(02)00708-2. [DOI] [PubMed] [Google Scholar]
- 13.Lu D, Zhang J, Yang Z, Liu H, Li S, Wu B, et al. Quantitative analysis of Cistanches herba using high-performance liquid chromatography coupled with diode array detection and high-resolution mass spectrometry combined with chemometric methods. J Sep Sci. 2013;36:1945–52. doi: 10.1002/jssc.201300135. [DOI] [PubMed] [Google Scholar]
- 14.Qi M, Xiong A, Geng F, Yang L, Wang Z. A novel strategy for target profiling analysis of bioactive phenylethanoid glycosides in Plantago medicinal plants using ultra-performance liquid chromatography coupled with tandem quadrupole mass spectrometry. J Sep Sci. 2012;35:1470–8. doi: 10.1002/jssc.201200010. [DOI] [PubMed] [Google Scholar]
- 15.Okada T, Nakamura Y, Kanaya S, Takano A, Malla KJ, Nakane T, et al. Metabolome analysis of Ephedra plants with different contents of ephedrine alkaloids by using UPLC-Q-TOF-MS. Planta Med. 2009;75:1356–62. doi: 10.1055/s-0029-1185577. [DOI] [PubMed] [Google Scholar]
- 16.Cardoso-Taketa AT, Pereda-Miranda R, Choi YH, Verpoorte R, Villarreal ML. Metabolic profiling of the Mexican anxiolytic and sedative plant Galphimia glauca using nuclear magnetic resonance spectroscopy and multivariate data analysis. Planta Med. 2008;74:1295–301. doi: 10.1055/s-2008-1074583. [DOI] [PubMed] [Google Scholar]
- 17.Zhi HJ, Qin XM, Sun HF, Zhang LZ, Guo XQ, Li ZY. Metabolic fingerprinting of Tussilago farfara L. using ¹H-NMR spectroscopy and multivariate data analysis. Phytochem Anal. 2012;23:492–501. doi: 10.1002/pca.2346. [DOI] [PubMed] [Google Scholar]
- 18.Palama TL, Fock I, Choi YH, Verpoorte R, Kodja H. Biological variation of Vanilla planifolia leaf metabolome. Phytochemistry. 2010;71:567–73. doi: 10.1016/j.phytochem.2009.12.011. [DOI] [PubMed] [Google Scholar]
- 19.Mi J, Zhang M, Zhang H, Wang Y, Wu S, Hu P. Coupling of ultrasound-assisted extraction and expanded bed adsorption for simplified medicinal plant processing and its theoretical model: Extraction and enrichment of ginsenosides from Radix ginseng as a case study. J Sep Sci. 2013;36:593–601. doi: 10.1002/jssc.201200745. [DOI] [PubMed] [Google Scholar]
- 20.Sun H, Wang M, Zhang A, Ni B, Dong H, Wang X. UPLC-Q-TOF-HDMS analysis of constituents in the root of two kinds of Aconitum using a metabolomics approach. Phytochem Anal. 2013;24:263–76. doi: 10.1002/pca.2407. [DOI] [PubMed] [Google Scholar]
- 21.Wang X, Zhang A, Sun H. Future perspectives of Chinese medical formulae: Chinmedomics as an effector. OMICS. 2012;16:414–21. doi: 10.1089/omi.2011.0138. [DOI] [PMC free article] [PubMed] [Google Scholar]
- 22.Xiang Z, Wang XQ, Cai XJ, Zeng S. Metabolomics study on quality control and discrimination of three Curcuma species based on gas chromatograph-mass spectrometry. Phytochem Anal. 2011;22:411–8. doi: 10.1002/pca.1296. [DOI] [PubMed] [Google Scholar]
- 23.Agnolet S, Wiese S, Verpoorte R, Staerk D. Comprehensive analysis of commercial willow bark extracts by new technology platform: Combined use of metabolomics, high-performance liquid chromatography-solid-phase extraction-nuclear magnetic resonance spectroscopy and high-resolution radical scavenging assay. J Chromatogr A. 2012;1262:130–7. doi: 10.1016/j.chroma.2012.09.013. [DOI] [PubMed] [Google Scholar]
- 24.Farag MA, Sharaf Eldin MG, Kassem H, Abou el Fetouh M. Metabolome classification of Brassica napus L. organs via UPLC-QTOF-PDA-MS and their anti-oxidant potential. Phytochem Anal. 2013;24:277–87. doi: 10.1002/pca.2408. [DOI] [PubMed] [Google Scholar]


