

Retention after starting antiretroviral therapy is best understood by examining multiple outcomes including stopping care, deaths in care, deaths out of care, and silent transfers.
Keywords: antiretroviral therapy, Africa, retention, loss to follow-up
Abstract
Background. Improving the implementation of the global response to human immunodeficiency virus requires understanding retention after starting antiretroviral therapy (ART), but loss to follow-up undermines assessment of the magnitude of and reasons for stopping care.
Methods. We evaluated adults starting ART over 2.5 years in 14 clinics in Uganda, Tanzania, and Kenya. We traced a random sample of patients lost to follow-up and incorporated updated information in weighted competing risks estimates of retention. Reasons for nonreturn were surveyed.
Results. Among 18 081 patients, 3150 (18%) were lost to follow-up and 579 (18%) were traced. Of 497 (86%) with ascertained vital status, 340 (69%) were alive and, in 278 (82%) cases, updated care status was obtained. Among all patients initiating ART, weighted estimates incorporating tracing outcomes found that 2 years after ART, 69% were in care at their original clinic, 14% transferred (4% official and 10% unofficial), 6% were alive but out of care, 6% died in care (<60 days after last visit), and 6% died out of care (≥60 days after last visit). Among lost patients found in care elsewhere, structural barriers (eg, transportation) were most prevalent (65%), followed by clinic-based (eg, waiting times) (33%) and psychosocial (eg, stigma) (27%). Among patients not in care elsewhere, psychosocial barriers were most prevalent (76%), followed by structural (51%) and clinic based (15%).
Conclusions. Accounting for outcomes among those lost to follow-up yields a more informative assessment of retention. Structural barriers contribute most to silent transfers, whereas psychological and social barriers tend to result in longer-term care discontinuation.
Although the global effort to scale up antiretroviral therapy (ART) has made life-saving medications available for >13 million persons living with human immunodeficiency virus (HIV) in the Global South, retention in care has emerged as a pervasive challenge to securing this progress [1]. Optimal long-term outcomes require consistent retention in care for ensuring on-time medication refill, evaluating treatment response, monitoring for adverse effects, and delivering additional clinical interventions [2–4]. Numerous barriers to retention, however, exist in resource-limited settings. Even though services have become more decentralized, patients must still travel long distances and incur burdensome opportunity costs to access care [5–7]. Health systems are overstretched by large patient volumes and weak infrastructure, resulting in healthcare worker burnout [8], long waiting times [9, 10], and uneven quality. Finally, HIV infection continues to carry deep social and psychological costs; stigma, denial, and depression are common in HIV-infected persons and can undermine retention [11, 12].
Despite the importance of retention, our present understanding of which patients stop care and why they stop is incomplete. In many clinic-based studies, patients with unknown outcomes are categorized as “lost to follow-up.” Lost patients are often interpreted as being out of care, but in reality many have simply sought care at a new facility without filing formal transfer documentation (“silent transfers”). Our inability to track patients across facilities obscures inferences about retention. In addition, most analyses represent the outcome of retention as “retained” or “not retained.” Accounting for additional outcomes, including silent transfers as well as those who stop care, deaths in care (ie, shortly after a clinic visit), and deaths out of care (ie, after stopping care) in assessments of retention can contextualize descriptions of retention and make them more informative. Furthermore, although existing epidemiologic studies have examined the association between routine programmatic data (eg, age, sex, and CD4 cell count) and retention [13, 14], we need to identify deeper social and psychological drivers of stopping care to inform interventions. Although qualitative studies have pointed toward many of these deeper reasons for stopping care, such as transportation barriers, food insecurity, poor patient–provider relationship, long waiting times, and fear of return after a missed appointment [6, 7, 15], these studies often lack an explicit sampling frame and therefore do not quantify the contribution of each of these factors on failures of retention. Quantifying patient-reported reasons for switching clinics or stopping care in a probability sample would advance our understanding of the barriers to retention.
In this analysis, we extend the understanding of retention through an analysis of adults starting ART in a network of clinic sites in Uganda, Kenya, and Tanzania. As in previous work, we identify a random sample of patients lost to follow-up and intensively seek them in the community to find their true vital status and, if alive, whether they have been in care at another clinic site. In a previous publication, we use these data to examine revised estimates of mortality [16]. In this analysis, restricted to new ART initiators only, we assessed retention after initiating ART and patient reported barriers to care.
METHODS
Patients
We evaluated adults starting ART over a 2.5-year period in 14 clinic sites in East Africa, located in 5 geographical settings in Mbarara, Uganda; Eldoret, Kenya; Kisumu, Kenya; Kampala, Uganda; and Morogoro, Tanzania that contribute data to the East Africa International Epidemiologic Databases to Evaluate AIDS (EA-IeDEA) consortium. (Additional information about the setting is available in Supplementary Document 1).
Procedures and Measurements
Sociodemographic data (eg, sex, age at enrollment) and clinical data (eg, CD4 cell count, World Health Organization stage, visit dates) were taken from electronic databases at each of the clinics. For those lost to follow-up (defined as being >90 days late and who had not returned by database closure), a random sample of 15%–20% was targeted for intensive tracing, depending on resources available. Those traced and found alive were asked an open-ended question about why they stopped care (if they reported no care) or why they went to a new clinic (if they reported being in care elsewhere). “In care” was defined as having seen a doctor or a nurse for HIV care in the previous 90 days. Responses to these open-ended questions were recorded using categories constructed from (1) review of the literature, (2) discussion with providers, counselors, social workers, and outreach workers at all 5 settings; and (3) iterative piloting with key informants until theme saturation.
Analysis
We first examined retention in a “naive” analysis using only outcomes known to the clinics before incorporating supplementary information learned through tracing. Using ART initiation date as time zero, we determined the cumulative incidence of becoming lost to follow-up (defined as being >90 days late for last appointment at database closure), death that was known to the clinic, and documented transfer to another facility. The Aalen–Johansen estimator was used to accommodate the multiple outcomes and censoring [17].
Second, among the sample of patients who were lost to follow-up and successfully traced in person, we estimated the rate of reengagement at a new clinic and tabulated patient-reported reasons for either switching to a new site or stopping care altogether. We classified reasons for nonreturn grouped according the Behavioral Model for Vulnerable Populations into factors that were “structural” or due to the external environment (eg, transportation costs, work responsibilities); “clinic-based” or due to the healthcare environment (eg, long waiting times); or “patient-based” or due to knowledge, beliefs, or attitudes (eg, denial) [18]. Overlap in reported barriers within an individual patient was represented through Venn diagrams. We used a modified Poisson regression to identify whether structural, clinic-based, or patient-based psychosocial reasons for loss to follow-up were associated with being in care among the lost patients we were able to contact.
Third, in the “corrected” descriptive analysis to depict the retention in the entire patient population, we included outcomes discovered through tracing as well as those already known to the clinic [19]. We applied the Aalen–Johansen approach, in which ART initiation was time zero and the outcome events included remaining in care at original clinic, transfer (both official and silent), stopping care (defined as not having seen a provider in the 90 days before interview date), death in care (defined as deaths that occurred within 60 days of last clinic visit), and death out of care (defined as deaths that occur >60 days after their last visit at the original clinic). Weighting, as previously described [20], was used to allow persons who had outcome ascertainment to represent all lost patients (Supplementary Document 2) [21, 22].
We used Cox proportional hazards models to assess the determinants of association between setting and using retention outcomes weighted by findings obtained through tracing. We examined an endpoint comprised of patients who have died as well as those who were alive but out of care [20], as well as an endpoint only of patients who stopped care while alive (ie, excluding deaths in care). We used all available pretreatment patient characteristics in this regression model because no “colliders” [23] were identified and overfitting was not a concern due to large sample size. We used multiple imputation to address missing predictor values [24, 25].
RESULTS
Patient Population
Among 18 081 adults initiating ART from 5 programs in Mbarara, Uganda; Eldoret, Kenya; Kisumu, Kenya; Kampala, Uganda; and Morogoro, Tanzania (Figure 1), 3250 (18%) patients were lost to follow-up. We selected a random sample of 579 (18% of the lost) for intensive tracing. In 497 (86%) cases, vital status outcome was ascertained. Of the 340 lost patients found to be alive, updated retention information was available in 278 (82%) through speaking to the patient directly or report of a treatment supporter (or other proxy). Patient characteristics (eg, sex, age, pretherapy CD4 cell count) among those lost and those successfully traced were similar (Table 1). The median time between sampling and tracing was 95 days (interquartile range [IQR], 69–156 days). Overall, the number of trips required to ascertain an outcome was 2 (IQR, 1–3). Sex, age, and pretherapy CD4 cell count were not associated with successful outcome ascertainment.
Figure 1.

Flowchart of outcomes in the study population.
Table 1.
Patient Characteristics
| Characteristic | Mbarara, Uganda |
Eldoret, Kenya |
||||||||||
|---|---|---|---|---|---|---|---|---|---|---|---|---|
| All | Lost | Sampled | Vital Status Found | Found Alive | Updated Care Status Ascertained | All | Lost | Sampled | Vital Status Found | Found Alive | Updated Care Status Ascertained | |
| No. | 3277 | 442 | 55 | 50 | 36 | 23 | 7104 | 1208 | 246 | 196 | 139 | 111 |
| Age, y, median (IQR)a | 32 (27–40) | 31 (26–38) | 32 (27–35) | 31.5 (28–35) | 31 (27.5–33.5) | 30 (27–32) | 37 (31–44) | 35 (29–42) | 36 (29–43) | 36 (29–43) | 34 (28–41) | 35 (29–42) |
| Sex, No. (%) | ||||||||||||
| Male | 1176 (35.9) | 190 (43.0) | 23 (41.8) | 21 (42.0) | 14 (38.9) | 8 (34.8) | 2537 (35.7) | 458 (37.9) | 100 (10.7) | 82 (41.8) | 53 (38.1) | 44 (39.6) |
| Nonpregnant female | 1627 (49.7) | 209 (47.3) | 26 (47.3) | 24 (48.0) | 17 (47.2) | 12 (52.2) | 4011 (56.5) | 651 (53.9) | 128 (52.0) | 99 (50.5) | 71 (51.1) | 54 (48.7) |
| Pregnant female | 474 (14.5) | 43 (9.7) | 6 (10.9) | 5 (10.0) | 5 (13.9) | 3 (13.0) | 556 (7.8) | 99 (8.2) | 18 (7.3) | 15 (7.7) | 15 (10.8) | 13 (11.7) |
| CD4 count at ART initiation, cells/µL, median (IQR) b | 184 (92–245) | 148.5 (55.5–225.5) | 201 (112–249) | 199 (112–249) | 220.5 (129.5–270) | 221 (119–305) | 162 (73–244) | 144 (61–247.5) | 129.5 (61–239) | 136 (62–252) | 176.5 (103.5–289.5) | 177 (102–274) |
| WHO stage, No. (%)c | ||||||||||||
| I | 1353 (41.9) | 106 (24.5) | 18 (34.6) | 16 (34.0) | 13 (39.4) | 9 (42.9) | 2297 (34.4) | 297 (28.2) | 59 (28.4) | 49 (28.8) | 43 (35.8) | 34 (35.1) |
| II | 1072 (33.2) | 117 (27.1) | 17 (32.7) | 15 (31.9) | 13 (39.4) | 9 (42.9) | 1295 (19.4) | 167 (15.9) | 28 (13.5) | 26 (15.3) | 19 (15.8) | 16 (16.5) |
| III | 542 (16.8) | 127 (29.4) | 11 (21.2) | 10 (21.3) | 4 (12.1) | 3 (14.3) | 2395 (35.9) | 451 (42.9) | 87 (41.8) | 69 (40.6) | 42 (35.0) | 32 (33.0) |
| IV | 262 (8.1) | 82 (19.0) | 6 (11.5) | 6 (12.8) | 3 (9.1) | 0 | 688 (10.3) | 137 (13.0) | 34 (16.4) | 26 (15.3) | 16 (13.3) | 15 (15.5) |
| NNRTI component of first regimend | ||||||||||||
| NVP | 2292 (70.2) | 326 (74.3) | 41 (74.6) | 38 (76.0) | 28 (77.8) | 17 (73.9) | 4639 (73.3) | 737 (71.9) | 146 (71.2) | 117 (69.6) | 77 (66.4) | 58 (63.0) |
| EFV | 975 (29.8) | 1113 (25.7) | 14 (25.5) | 12 (24.0) | 8 (22.2) | 6 (26.1) | 1689 (26.7) | 288 (28.1) | 59 (28.8) | 51 (30.4) | 39 (33.6) | 34 (37.0) |
| NRTI in first regimene | ||||||||||||
| ZDV | 225 (6.9) | 50 (11.3) | 10 (18.2) | 9 (18.0) | 6 (16.7) | 3 (13.0) | 2694 (41.2) | 578 (53.0) | 117 (54.7) | 94 (53.7) | 65 (52.9) | 53 (54.1) |
| d4T | 2509 (76.6) | 328 (74.2) | 38 (69.1) | 34 (68.0) | 25 (69.4) | 17 (73.9) | 3089 (47.2) | 461 (42.3) | 91 (42.5) | 77 (44.0) | 57 (46.3) | 44 (44.9) |
| TDF | 542 (16.5) | 64 (14.5) | 7 (12.7) | 7 (14.0) | 5 (13.9) | 3 (13.0) | 759 (11.6) | 51 (4.7) | 6 (2.8) | 4 (2.3) | 1 (0.8) | 1 (1.0) |
| ART initiation date, median (IQR) | 7 July 2010 (11 Sept 2009, 4 March 2011) | 18 Nov 2009 (30 April 2009, 7 June 2010) | 4 March 2010(29 Sept 2009, 14 Sept 2010) | 9 March 2010(29 Sept 2009, 14 Sept 2010) | 21 March 2010 (2 June 2009, 20 October 2010) | 20 Feb 2010(14 April 2009, 26 Aug 2010) | 15 March 2010 (30 July 2009, 13 Oct 2010) | 09 Nov 2009 (2 June 2009, 20 May 2010) | 26 Sept 2009(14 April 2009, 2 June 2010) | 27 Oct 2009(1 May 2009, 13 June 2010) | 13 Oct (28 April 2009, 16 June 2010) | 26 June 2010 (22 June 2009, 2 Aug 2010) |
| Characteristic | Kisumu, Kenya |
Kampala, Uganda |
||||||||||
|---|---|---|---|---|---|---|---|---|---|---|---|---|
| All | Lost | Sampled | Vital Status Found | Found Alive | Updated Care Status Ascertained | All | Lost | Sampled | Vital Status Found | Found Alive | Updated Care Status Ascertained | |
| No. | 3555 | 495 | 81 | 78 | 55 | 49 | 2372 | 432 | 93 | 82 | 52 | 43 |
| Age, y, median (IQR)a | 31 (26–38) | 29 (23–35) | 29 (22–36) | 29.5 (22–36) | 27 (21–36) | 27 (21–36) | 33 (28–39) | 31 (26–38) | 31 (26–38) | 31 (26–38) | 30 (25–35) | 29.5 (25–38) |
| Sex, No. (%) | ||||||||||||
| Male | 1147 (32.3) | 164 (33.1) | 26 (32.1) | 24 (30.8) | 16 (29.1) | 16 (32.7) | 658 (27.7) | 132 (30.6) | 25 (26.9) | 24 (29.3) | 12 (23.1) | 8 (18.6) |
| Nonpregnant female | 1908 (53.7) | 250 (50.5) | 43 (53.1) | 43 (55.1) | 29 (52.7) | 25 (51.0) | 1588 (67.0) | 283 (65.5) | 66 (71.0) | 57 (69.5) | 39 (75.0) | 34 (79.1) |
| Pregnant female | 500 (14.1) | 81 (16.4) | 12 (14.8) | 11 (14.1) | 10 (18.2) | 8 (16.3) | 126 (5.3) | 17 (3.9) | 2 (2.2) | 1 (1.2) | 1 (1.9) | 1 (2.3) |
| CD4 count at ART initiation, cells/µL, median (IQR) b | 196 (94–281) | 148 (52–234) | 156 (79–229) | 155.5 (80.5–237) | 201 (141–271) | 204 (141–271) | 172 (92–241) | 133 (56–217) | 121.5 (40.5–201.5) | 115 (45–206) | 157.5 (68–209) | 157.5 (71–208.5) |
| WHO stage, No. (%)c | ||||||||||||
| I | 963 (27.2) | 108 (22.0) | 19 (23.8) | 17 (22.1) | 15 (27.8) | 12 (25.0) | 492 (21.0) | 81 (19.3) | 15 (16.3) | 13 (15.9) | 11 (21.2) | 7 (16.3) |
| II | 1033 (29.2) | 110 (22.4) | 16 (20.0) | 16 (20.8) | 13 (24.1) | 11 (22.9) | 938 (40.0) | 144 (34.3) | 40 (43.5) | 34 (41.5) | 23 (44.2) | 20 (46.5) |
| III | 1263 (35.7) | 212 (43.1) | 37 (46.3) | 37 (48.1) | 25 (46.3) | 24 (50.0) | 704 (30.1) | 140 (33.3) | 24 (26.1) | 23 (28.1) | 15 (28.9) | 13 (30.2) |
| IV | 278 (7.9) | 62 (12.6) | 8 (10.0) | 7 (9.1) | 1 (1.9) | 1 (2.1) | 209 (8.9) | 55 (13.1) | 13 (14.1) | 12 (14.6) | 3 (5.8) | 3 (7.0) |
| NNRTI component of first regimend | ||||||||||||
| NVP | 2199 (67.6) | 323 (74.8) | 61 (83.6) | 58 (82.9) | 42 (89.4) | 39 (90.7) | … | … | … | … | … | … |
| EFV | 1054 (32.4) | 109 (25.2) | 12 (16.4) | 12 (17.1) | 5 (10.6) | 4 (9.3) | … | … | … | … | … | … |
| NRTI in first regimene | ||||||||||||
| ZDV | 1517 (43.4) | 288 (59.1) | 48 (59.3) | 47 (60.3) | 30 (54.6) | 28 (57.1) | … | … | … | … | … | … |
| d4T | 1343 (38.4) | 175 (35.9) | 30 (37.0) | 29 (37.2) | 24 (43.6) | 20 (40.8) | … | … | … | … | … | … |
| TDF | 364 (18.2) | 24 (4.9) | 3 (3.7) | 2 (2.6) | 1 (1.8) | 1 (2.0) | … | … | … | … | … | … |
| ART initiation date, median (IQR) | 18 Nov 2009 (3 March 2009, 25 Aug 2010) | 13 May 2009 (22 Oct 2008, 27 Nov 2009) | 29 April 2009(22 Oct 2008, 27 Nov 2009) | 19 May 2009 (22 Oct 2008, 7 Dec 2009) | 08 April 2009(22 Oct 2008, 26 Oct 2009) | 20 June 2009(20 Nov 2008, 26 Oct 2009) | 7 Oct 2010 (23 Sept 2009, 06 April 2011) | 3 March 2010 (4 July 2009, 20 Oct 2010) | 15 Dec 2009 (11 June 2009, 25 Aug 2010) | 3 Nov 2009 (10 June 2009, 11 Aug 2010) | 26 Sept 2009 (31 May 2009, 8 Aug 2010) | 30 March 2010 (17 June 2009, 11 Aug 2010) |
| Characteristic | Morogoro, Tanzania |
All |
||||||||||
|---|---|---|---|---|---|---|---|---|---|---|---|---|
| All | Lost | Sampled | Vital Status Found | Found Alive | Updated Care Status Ascertained | All | Lost | Sampled | Vital Status Found | Found Alive | Updated Care Status Ascertained | |
| No. | 1773 | 673 | 104 | 91 | 58 | 52 | 18081 | 3250 | 579 | 497 | 340 | 278 |
| Age, y, median (IQR)a | 37 (31–44) | 36 (30–43) | 36 (31.5–42) | 36 (31–43) | 34 (30–40) | 34 (31–39) | 35 (29–42) | 33 (28–41) | 33 (28–41) | 33 (28–41) | 32 (26–39) | 32 (26–39) |
| Sex, No. (%) | ||||||||||||
| Male | 548 (30.9) | 218 (32.4) | 32 (30.8) | 29 (31.9) | 17 (29.3) | 14 (26.9) | 6066 (33.6) | 1162 (35.8) | 206 (35.6) | 180 (36.2) | 112 (32.9) | 90 (32.4) |
| Nonpregnant female | 1181 (66.6) | 435 (64.6) | 68 (65.4) | 59 (64.8) | 39 (67.2) | 37 (71.2) | 10315 (57.1) | 1828 (56.3) | 331 (57.2) | 282 (56.7) | 195 (57.4) | 162 (58.3) |
| Pregnant female | 44 (2.5) | 20 (3.0) | 4 (3.9) | 3 (3.3) | 2 (3.5) | 1 (1.9) | 1700 (9.4) | 260 (8.0) | 42 (7.3) | 35 (7.0) | 33 (9.7) | 26 (9.4) |
| CD4 count at ART initiation, cells/µL, median (IQR) b | 140 (58–242) | 127 (52–225) | 155.5 (56–236) | 155.5 (55.5–235) | 160 (86–236) | 163.5 (86–236) | 172 (81–251) | 140 (56–233) | 150 (62–234) | 154 (64–237) | 182 (103–260) | 177 (102–260) |
| WHO stage, No. (%)c | ||||||||||||
| I | 66 (3.7) | 23 (3.4) | 6 (5.8) | 4 (4.4) | 3 (5.2) | 2 (4.6) | 5171 (29.5) | 615 (20.1) | 117 (21.8) | 99 (21.2) | 85 (42.9) | 64 (24.5) |
| II | 403 (22.8) | 155 (23.1) | 21 (20.2) | 17 (18.7) | 11 (19.0) | 8 (18.2) | 4741 (27.0) | 693 (22.6) | 122 (22.8) | 108 (23.1) | 79 (24.9) | 67 (25.7) |
| III | 1037 (58.7) | 371 (55.4) | 60 (57.7) | 55 (60.4) | 36 (62.1) | 28 (63.6) | 5941 (33.9) | 1301 (42.4) | 219 (40.9) | 194 (41.5) | 122 (38.5) | 104 (39.9) |
| IV | 260 (14.7) | 121 (18.1) | 17 (16.4) | 15 (16.5) | 8 (13.8) | 6 (13.6) | 1697 (9.7) | 457 (14.9) | 78 (14.6) | 66 (14.1) | 31 (9.8) | 26 (10.0) |
| NNRTI component of first regimend | ||||||||||||
| NVP | 669 (39.1) | 283 (43.4) | 38 (38.8) | 33 (38.4) | 21 (38.9) | 20 (40.8) | 9799 (67.3) | 1669 (65.5) | 286 (66.4) | 246 (65.8) | 168 (66.4) | 134 (64.7) |
| EFV | 1044 (61.0) | 369 (59.6) | 60 (61.2) | 53 (61.6) | 33 (61.1) | 29 (59.2) | 4762 (32.7) | 879 (34.5) | 145 (33.6) | 128 (34.2) | 85 (33.6) | 73 (35.3) |
| NRTI in first regimene | ||||||||||||
| ZDV | 447 (26.1) | 205 (31.4) | 25 (25.5) | 20 (23.3) | 14 (25.9) | 13 (26.5) | 4883 (32.5) | 1121 (42.0) | 200 (44.6) | 170 (43.7) | 115 (42.9) | 97 (44.3) |
| d4T | 1266 (73.9) | 447 (68.6) | 73 (74.5) | 66 (76.7) | 40 (74.1) | 36 (73.5) | 8207 (54.6) | 1411 (52.8) | 232 (51.8) | 206 (53.0) | 146 (54.5) | 117 (53.4) |
| TDF | 0 | 0 | 0 | 0 | 0 | 0 | 1935 (12.9) | 139 (5.2) | 16 (3.6) | 13 (3.3) | 7 (2.6) | 5 (2.3) |
| ART initiation date, median (IQR) | 8 March 2010 (12 June 2009, 2 Nov 2010) | 22 Oct 2009 (5 May 2009, 6 July 2010) | 16 June 2010 (3 June 2009, 21 Aug 2010) | 25 March 2010 (2 June 2009, 2 Sept 2010) | 19 Feb 2010 (26 May 2009, 2 Sept 2010) | 31 March 2010 (28 April 2009, 4 Oct 2010) | 31 March 2010 (9 July 2009, 22 Nov 2010) | 21 Oct 2009 (30 April 2009, 7 June 2010) | 27 Oct 2009 (23 April 2009, 11 June 2010) | 03 Nov 2009 (28 April 2009, 21 June 2010) | 03 Oct 2009 (11 Apri1 2009, 18 June 2010) | 26 Oct 2009 (09 April 2009, 21 June 2010) |
Antiretroviral therapy regimen is missing from Kampala sites.
Abbreviations: ART, antiretroviral therapy; d4T, stavudine; EFV, efavirenz; IQR, interquartile range; NNRTI, nonnucleoside reverse transcriptase inhibitor; NRTI, nucleoside reverse transcriptase inhibitor; NVP, nevirapine; TDF, tenofovir disoproxil fumarate; WHO, World Health Organization; ZDV, zidovudine.
a Missing in 0.
b Missing in 2165 (12.0%).
c Missing in 531 (2.9%).
d Missing in 3520 (19.5%).
e Missing in 3059 (16.9%).
Reengagement Among Patients Lost to Follow-up
Among 278 patients who were lost and in whom updated care status was ascertained, 190 (68%) were spoken to in person and gave dates they first visited a new clinic after last visit at the original clinic. Across all sites, reengagement in a new site in the first year after the last visit at the original clinic was at 48 per 100 person-years (PY) (95% confidence interval [CI], 38–62 per 100 PY). The highest rate of reengagement during this period was in Kampala (100 per 100 PY [95% CI, 59–169 per 100 PY]), whereas the lowest rate of reengagement was observed in Eldoret (14 per 100 PY [95% CI, 7–26 per 100 PY]).
Reasons for Stopping Care and Silent Transfer
Among the 190 who were interviewed in person, we tabulated reasons for nonreturn, first among 78 patients who reported no longer being in care (Figure 2A) and the 112 who reported being in care at a new clinic (Figure 2B). Among those no longer in care, the median number of reasons given was 2 (IQR, 1–4), and the 3 most common reasons were “lack of transportation” (33% [95% CI, 23%–44%]), “work or child care responsibilities interfered with coming to clinic” (24% [95% CI, 9%–15%]), and “felt well and therefore did not see any reason for coming” (22% [95% CI, 13%–32%]). Among lost patients who were found to be receiving care elsewhere (ie, silent transfers), the median number of reasons given was 2 (IQR, 1–4), and the top 3 reasons were “transportation is easier or cheaper to the new clinic” (57% [95% CI, 47%–66%]), “new clinic closer to work or home” (32% [95% CI, 19%–36%]), and “had family obligations” (21% [95% CI, 14%–29%]).
Figure 2.

Prevalence of patient-reported reasons for stopping human immunodeficiency virus (HIV) care (A) and switching site of care (B). Structural barriers stem from material conditions of life in resource-limited settings (eg, transportation cost and availability, work requirements) and are shown in red bars. Psychosocial barriers are related to knowledge, beliefs, or attitudes of the patients in the given social setting (eg, stigma, preference for spiritual healing) and are shown in blue bars. Clinic-based barriers are related to delivery processes at a clinic site (eg, long waiting times, quarrel with healthcare worker) and are shown in green bars. Medical barriers related to health status (such as too sick to come to clinic) are shown in orange bars.
We grouped individual reasons for nonreturn into 3 dimensions: structural (eg, transport) psychosocial (eg, stigma), and clinic based (eg, long waiting times) (Figure 3). Among lost patients whom we found to have stopped care altogether, psychosocial barriers were most prevalent (76% [95% CI, 64%–84%]), followed by structural (51% [95% CI, 39%–62%]) and clinic-based barriers (15% [95% CI, 8%–25%]). (Of note, psychosocial barriers were most prevalent as a group among those out of care, even though the single most prevalent reason in this group was a structural barrier.) Among lost patients found to be silent transfers (ie, those who had reconnected to care at a new clinic), structural barriers were most prevalent (65% [95% CI, 56%–75%]), followed by clinic-based (33% [95% CI, 25%–43%]) and psychosocial (27% [95% CI, 19%–36%]) barriers. Venn diagrams illustrate overlap (Supplementary Figure 1). Among 190 lost patients interviewed in person, report of a psychosocial barrier was associated with being out of care, whereas report of a structural barrier was associated with being in care at a new site (Supplementary Document 3).
Figure 3.
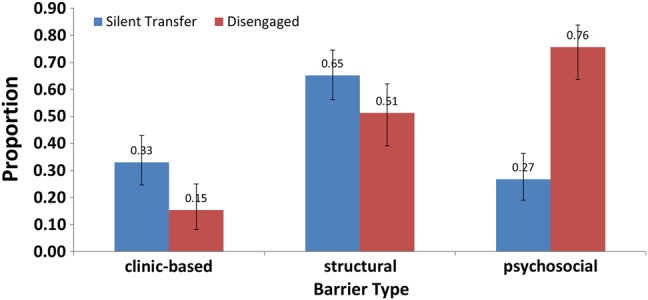
Prevalence of any reported barrier in each one of three categories (ie, structural, psychosocial, and clinic-based) among patients who stopped care (in red bars) and among silent transfers (in blue bars) who reconnected at a new clinic site.
Revised Estimates of Retention
In an unweighted estimate, we found that 2 years after ART initiation, 67% (95% CI, 65%–69%) of patients were in care at the original clinic, 4% (95% CI, 3%–4%) were in care at a new clinic, 2% (95% CI, 2%–3%) had died in care, 1% had died out of care (95% CI, 0.7%–1%), and 26% (95% CI, 25%–27%) were lost to follow-up, which is often interpreted as out of care (Figure 4). When the outcomes among the lost were incorporated, 69% (95% CI, 66%–71%) of patients were classified as in care at the original clinic, a total of 14% (95% CI, 13%–16%) were classified as in care at a new clinic (4% known and 10% unknown transfers), 6% (95% CI, 5%–7%) had died in care, 6% (95% CI, 5%–7%) had died out of care, and 6% were alive but no longer in care (95% CI, 5%–7%).
Figure 4.

Retention after starting antiretroviral therapy (ART) with and without incorporation of data obtained through tracing.
Estimates of retention in which we count patients who remain at the original clinic as well as both official and silent transfers as retained (although using supplementary information obtained from tracing) showed marked differences by setting. After 2 years on ART, in Mbarara 77% (95% CI, 72%–82%) of patients remained in care at the original clinic, 4% had formal transfers to a new clinic (95% CI, 3%–5%), and 10% were silent transfers (95% CI, 8%–11%)—a total retention estimate of 91%. In Morogoro, after 2 years, 49% of patients remained in care at their original clinic (95% CI, 41%–56%), <1% were official transfers, and 17% were silent transfers to a new clinic (95% CI, 15%–19%)—a total of 66% (Supplementary Figure 2).
In a multivariable model to identify factors associated with retention, we found setting to be the strongest predictor of a combined endpoint of stopping care while alive or having died, as well as the endpoint of stopping care while alive alone (Table 2).
Table 2.
Weighted Cox Proportional Hazards Models of Factors Associated With Stopping Care While Still Alive and a Combined Outcome of Having Died or Stopped Care
| Factor | Stopping Care While Alive |
Stopping Care or Death |
||
|---|---|---|---|---|
| Hazard Ratio (95% CI) | P Value | Hazard Ratio (95% CI) | P Value | |
| Setting | .049 | <.001 | ||
| Mbarara, Uganda | … | |||
| Eldoret, Kenya | 1.45 (.79–2.67) | 1.60 (1.00–2.54) | ||
| Kisumu, Kenya | 1.04 (.55–1.99) | 1.16 (.71–1.91) | ||
| Kampala, Uganda | 1.22 (.62–2.37) | 1.25 (.74–2.11) | ||
| Morogoro, Tanzania | 2.33 (1.18–4.61) | 3.12 (1.92–5.33) | ||
| Age (per 10 y) | 0.77 (.63–.93) | .008 | 0.93 (.82–1.06) | .275 |
| Sex | .003 | <.001 | ||
| Nonpregnant female | … | … | ||
| Male | 1.74 (1.26–2.40) | 1.54 (1.23–1.93) | ||
| Pregnant female | 1.21 (.63–2.32) | 1.07 (.62–1.83) | ||
| CD4 count at ART initiation, cells/µL | .546 | <.001 | ||
| >350 | … | … | ||
| 200–349 | 0.68 (.39–1.18) | 0.77 (.49–1.21) | ||
| 50–199 | 0.78 (.47–1.30) | 0.90 (.60–1.37) | ||
| <50 | 0.85 (.49–1.50) | 1.56 (1.01–2.42) | ||
| WHO stage at ART initiation | .004 | <.001 | ||
| I | … | … | ||
| II | 0.91 (.56–1.48) | 1.00 (.70–1.46) | ||
| III | 1.51 (.98–2.33) | 1.65 (1.17–2.30) | ||
| IV | 2.24 (1.34–3.75) | 2.68 (1.84–3.88) | ||
| NNRTI component of first regimen | .828 | .647 | ||
| EFV | ||||
| NVP | 1.05 (.67–1.65) | 0.89 (.65–1.21) | ||
| NRTI component of first regimen | .749 | .386 | ||
| ZDV | … | … | ||
| d4T | 1.00 (1.00–1.00) | 0.83 (.60–1.15) | ||
| TDF | 1.00 (1.00–1.00) | 0.82 (.39–1.71) | ||
Estimates are weighted using outcomes ascertained through intensive tracing of a sampling of lost patients. All factors are adjusted for all other factors in the model (N = 18 081).
Abbreviations: ART, antiretroviral therapy; CI, confidence interval; d4T, stavudine; EFV, efavirenz; NNRTI, nonnucleoside reverse transcriptase inhibitor; NRTI, nucleoside reverse transcriptase inhibitor; NVP, nevirapine; TDF, tenofovir disoproxil fumarate; WHO, World Health Organization; ZDV, zidovudine.
DISCUSSION
Accounting for outcomes among patients lost to follow-up led to a more complete and nuanced understanding of the overall as well as site-to-site variability in retention after starting ART. The analysis using only routine clinic data (without supplementation by tracing) concluded that after 2 years of ART, 26% were lost to follow-up (a figure commonly interpreted as being out of care), 2% had died in care, and 1% had died out of care. In contrast, a revised analysis using supplementary information obtained through tracing of patients concluded that 6% were alive and out of care, 6% had died in care, and 6% had died out of care. When stratified by setting, the probability of death or being out of care at 2 years ranged from 7% in Mbarara to 34% in Morogoro. The probability of having stopped care while alive ranged from a low of 4% in Kisumu to a high of 20% in Morogoro. Among patients who were lost to follow-up and successfully traced, patients in care at a new site (ie, silent transfers) most frequently reported structural barriers to care (eg, distance, transportation). In contrast, lost patients who were not receiving care at all most commonly cited psychosocial barriers (eg, stigma, denial, switching to herbal treatment).
Categorizing patients into 6 outcome categories (retained at original clinic, known transfers, silent transfers, out of care, deaths in care, and deaths out of care) offers a more nuanced representation of retention as compared to simple categorization of “retained” and “not retained” [20]. Having multiple outcome states allows more flexible summary of results. For example, readers interested in physical access to care might consider “retention” to include (1) patients retained in their original clinic (69%); (2) patients transferred to another facility (14%); and (3) those who died despite recent clinical visits (6%)—for a total of 89% in this analysis. Other readers may want to exclude deaths in care (ie, shortly after a clinic visit) from the “retained” category, resulting in an estimate of retention of 83% at 2 years. Readers interested in drug resistance might want to consider silent transfers (10%) and those who have died out of care (6%) as the group of highest interest, as these patients have known lapses in care and might represent a reservoir of drug resistance (a total of 16% at 2 years).
Our documentation of a relatively large fraction of transfers (both silent and documented)—14% of all ART initiators at 2 years—highlights a population that has received relatively little attention to date in the literature. On the one hand, the fact that approximately 50% of living patients lost to follow-up have reconnected to care at a new facility should be considered good news compared to the assumption that all are out of care. On the other hand, the rate of reengagement is not fast enough to be sure that interruptions in ART did not occur. These potential lapses imply that the safety of transfer of care across facilities is an issue in urgent need of further characterization. Given that patient mobility for livelihoods is common (eg, fishermen, migrant wage labor, trade), it is the responsibility of health systems to find methods of ensuring that patients can rapidly and smoothly access care in multiple locations.
The differences in patient-reported barriers between lost patients found to be silent transfers vs those out of care underscores the heterogeneity in patients who are often lumped together as lost to follow-up [26–28]. The preponderance of structural and clinic-based barriers among silent transfers suggests that these patients are driven away from a particular facility, either because of access to the facility or experiences at that facility. In contrast, lost patients who were found to be out of care more often reported psychosocial barriers such as stigma, a belief that feeling well indicated care was no longer needed, or switching to herbal or spiritual remedies. These beliefs seem to drive patients away from care more generally. These findings suggest that even as health systems seek to make care more accessible, efficient, and welcoming, interventions that target patient knowledge, beliefs, and attitudes remain paramount. Specifically, interventions that use peer-to-peer social influences, including community adherence groups [29, 30], microclinics [31], and peer-based psychosocial [32] and service support [33], are promising ways to influence the beliefs and motivations of patients. Such interventions may also promote potential critical mediators of retention such as treatment literacy and “patient activation” [34, 35].
Our study has limitations. First, our definition of retention differs from existing definitions of retention used in resource-rich settings and is a low bar [36]. Second, rate of reengagement after the last visit was not able to account for reconnection to care before death among those who died. Third, reasons for nonengagement were elicited from patient reports, and the relationship between reported barriers and behavior is uncertain. Fourth, we did not interview all living patients in person, and therefore the distribution of reasons may be biased by nonresponse.
In summary, assessing patient outcomes (including patient-reported outcomes) among lost patients in a large network of HIV treatment sites led to substantially higher estimates of retention in care as well as notable heterogeneity in the retention across settings. Among lost patients, reengagement across sites was neither timely nor complete; systems must focus on this vulnerable period to ensure safety of transfers. Physical access to care and unpleasant clinic processes contribute to disruptions of care as patients move across facilities, but barriers to retention stemming from knowledge, beliefs, and attitudes of patients play a leading role in lasting discontinuation of care.
Supplementary Data
Supplementary materials are available at http://cid.oxfordjournals.org. Consisting of data provided by the author to benefit the reader, the posted materials are not copyedited and are the sole responsibility of the author, so questions or comments should be addressed to the author.
Notes
Acknowledgments. We thank the director of the Kenya Medical Research Institute.
Financial support. This work was supported by the National Institutes of Health (grant numbers K23AI084544, U01AI069918, and P30AI027763).
Potential conflicts of interest. All authors: No reported conflicts. All authors have submitted the ICMJE Form for Disclosure of Potential Conflicts of Interest. Conflicts that the editors consider relevant to the content of the manuscript have been disclosed.
References
- 1.Joint United Nations Programme on HIV/AIDS. Global report: UNAIDS report on the global AIDS epidemic 2013. Available at: http://www.unaids.org/en/media/unaids/contentassets/documents/epidemiology/2013/gr2013/UNAIDS_Global_Report_2013_en.pdf. Accessed 1 July 2015.
- 2.Cheever LW. Engaging HIV-infected patients in care: their lives depend on it. Clin Infect Dis 2007; 44:1500–2. [DOI] [PubMed] [Google Scholar]
- 3.Mugavero MJ, Norton WE, Saag MS. Health care system and policy factors influencing engagement in HIV medical care: piecing together the fragments of a fractured health care delivery system. Clin Infect Dis 2011; 52(suppl 2):S238–46. [DOI] [PMC free article] [PubMed] [Google Scholar]
- 4.Giordano TP, Gifford AL, White AC Jr et al. Retention in care: a challenge to survival with HIV infection. Clin Infect Dis 2007; 44:1493–9. [DOI] [PubMed] [Google Scholar]
- 5.van Dijk JH, Sutcliffe CG, Munsanje B, Hamangaba F, Thuma PE, Moss WJ. Barriers to the care of HIV-infected children in rural Zambia: a cross-sectional analysis. BMC Infect Dis 2009; 9:169. [DOI] [PMC free article] [PubMed] [Google Scholar]
- 6.Tuller DM, Bangsberg DR, Senkungu J, Ware NC, Emenyonu N, Weiser SD. Transportation costs impede sustained adherence and access to HAART in a clinic population in southwestern Uganda: a qualitative study. AIDS Behav 2010; 14:778–84. [DOI] [PMC free article] [PubMed] [Google Scholar]
- 7.Hardon AP, Akurut D, Comoro C et al. Hunger, waiting time and transport costs: time to confront challenges to ART adherence in Africa. AIDS Care 2007; 19:658–65. [DOI] [PubMed] [Google Scholar]
- 8.Jewkes R, Abrahams N, Mvo Z. Why do nurses abuse patients? Reflections from South African obstetric services. Soc Sci Med 1998; 47:1781–95. [DOI] [PubMed] [Google Scholar]
- 9.Wanyenze RK, Wagner G, Alamo S et al. Evaluation of the efficiency of patient flow at three HIV clinics in Uganda. AIDS Patient Care STDS 2010; 24:441–6. [DOI] [PMC free article] [PubMed] [Google Scholar]
- 10.Amanyire G, Wanyenze R, Alamo S et al. Client and provider perspectives of the efficiency and quality of care in the context of rapid scale-up of antiretroviral therapy. AIDS Patient Care STDS 2010; 24:719–27. [DOI] [PMC free article] [PubMed] [Google Scholar]
- 11.Zou J, Yamanaka Y, John M, Watt M, Ostermann J, Thielman N. Religion and HIV in Tanzania: influence of religious beliefs on HIV stigma, disclosure, and treatment attitudes. BMC Public Health 2009; 9:75. [DOI] [PMC free article] [PubMed] [Google Scholar]
- 12.Ware NC, Wyatt MA, Tugenberg T. Social relationships, stigma and adherence to antiretroviral therapy for HIV/AIDS. AIDS Care 2006; 18:904–10. [DOI] [PubMed] [Google Scholar]
- 13.Brinkhof MW, Dabis F, Myer L et al. Early loss of HIV-infected patients on potent antiretroviral therapy programmes in lower-income countries. Bull World Health Organ 2008; 86:559–67. [DOI] [PMC free article] [PubMed] [Google Scholar]
- 14.Karcher H, Omondi A, Odera J, Kunz A, Harms G. Risk factors for treatment denial and loss to follow-up in an antiretroviral treatment cohort in Kenya. Trop Med Int Health 2007; 12:687–94. [DOI] [PubMed] [Google Scholar]
- 15.Ware NC, Wyatt MA, Geng EH et al. Toward an understanding of disengagement from HIV treatment and care in sub-Saharan Africa: a qualitative study. PLoS Med 2013; 10:e1001369. [DOI] [PMC free article] [PubMed] [Google Scholar]
- 16.Geng EH, Odeny TA, Lyamuya RE et al. Estimation of mortality among HIV-infected people on antiretroviral treatment in east Africa: a sampling based approach in an observational, multisite, cohort study. Lancet HIV 2015; 2:e107–16. [DOI] [PMC free article] [PubMed] [Google Scholar]
- 17.Aalen OO, Johansen S. An empirical transition matrix for non-homogeneous Markov chains based on censored observations. Scand Stat 1978:141–50. [Google Scholar]
- 18.Gelberg L, Andersen RM, Leake BD. The behavioral model for vulnerable populations: application to medical care use and outcomes for homeless people. Health Serv Res 2000; 34:1273–302. [PMC free article] [PubMed] [Google Scholar]
- 19.Geng EH, Glidden DV, Bangsberg DR et al. A causal framework for understanding the effect of losses to follow-up on epidemiologic analyses in clinic-based cohorts: the case of HIV-infected patients on antiretroviral therapy in Africa. Am J Epidemiol 2012; 175:1080–7. [DOI] [PMC free article] [PubMed] [Google Scholar]
- 20.Geng EH, Glidden DV, Bwana MB et al. Retention in care and connection to care among HIV-infected patients on antiretroviral therapy in Africa: estimation via a sampling-based approach. PLoS One 2011; 6:e21797. [DOI] [PMC free article] [PubMed] [Google Scholar]
- 21.Frangakis CE, Rubin DB. Addressing an idiosyncrasy in estimating survival curves using double sampling in the presence of self-selected right censoring. Biometrics 2001; 57:333–42. [DOI] [PubMed] [Google Scholar]
- 22.Geng EH, Emenyonu N, Bwana MB, Glidden DV, Martin JN. Sampling-based approach to determining outcomes of patients lost to follow-up in antiretroviral therapy scale-up programs in Africa. JAMA 2008; 300:506–7. [DOI] [PMC free article] [PubMed] [Google Scholar]
- 23.Hernan MA, Hernandez-Diaz S, Robins JM. A structural approach to selection bias. Epidemiology 2004; 15:615–25. [DOI] [PubMed] [Google Scholar]
- 24.Schafer JL. Multiple imputation: a primer. Stat Methods Med Res 1999; 8:3–15. [DOI] [PubMed] [Google Scholar]
- 25.Schafer JL, Graham JW. Missing data: our view of the state of the art. Psychol Methods 2002; 7:147–77. [PubMed] [Google Scholar]
- 26.Brinkhof MW, Pujades-Rodriguez M, Egger M. Mortality of patients lost to follow-up in antiretroviral treatment programmes in resource-limited settings: systematic review and meta-analysis. PLoS One 2009; 4:e5790. [DOI] [PMC free article] [PubMed] [Google Scholar]
- 27.Geng EH, Bwana MB, Muyindike W et al. Failure to initiate antiretroviral therapy, loss to follow-up and mortality among HIV-infected patients during the pre-ART period in Uganda. J Acquir Immune Defic Syndr 2013; 63:e64-71. [DOI] [PMC free article] [PubMed] [Google Scholar]
- 28.Yu JK, Chen SC, Wang KY et al. True outcomes for patients on antiretroviral therapy who are “lost to follow-up” in Malawi. Bull World Health Organ 2007; 85:550–4. [DOI] [PMC free article] [PubMed] [Google Scholar]
- 29.Decroo T, Telfer B, Biot M et al. Distribution of antiretroviral treatment through self-forming groups of patients in Tete province, Mozambique. J Acquir Immune Defic Syndr 2011; 56:e39–44. [DOI] [PubMed] [Google Scholar]
- 30.Decroo T, Van Damme W, Kegels G, Remartinez D, Rasschaert F. Are expert patients an untapped resource for ART provision in sub-Saharan Africa? AIDS Res Treat 2012; doi:10.1155/2012/749718. [DOI] [PMC free article] [PubMed] [Google Scholar]
- 31.Hickey MD, Salmen CR, Omollo D et al. Pulling the network together: quasi-experimental trial of a patient-defined support network intervention for promoting engagement in HIV care and medication adherence on Mfangano Island, Kenya. J Acquir Immune Defic Syndr 2015; 69:e127–34. [DOI] [PMC free article] [PubMed] [Google Scholar]
- 32.Rotheram-Borus M-J, Richter L, Van Rooyen H et al. Project Masihambisane: a cluster randomised controlled trial with peer mentors to improve outcomes for pregnant mothers living with HIV. Trials 2011; 12:1–10. [DOI] [PMC free article] [PubMed] [Google Scholar]
- 33.Chang LW, Kagaayi J, Nakigozi G et al. Effect of peer health workers on AIDS care in Rakai, Uganda: a cluster-randomized trial. PLoS One 2010; 5:e10923. [DOI] [PMC free article] [PubMed] [Google Scholar]
- 34.Hibbard JH, Stockard J, Mahoney ER, Tusler M. Development of the Patient Activation Measure (PAM): conceptualizing and measuring activation in patients and consumers. Health Serv Res 2004; 39:1005–26. [DOI] [PMC free article] [PubMed] [Google Scholar]
- 35.Hibbard JH, Stockard J, Tusler M. Hospital performance reports: impact on quality, market share, and reputation. Health Affairs 2005; 24:1150–60. [DOI] [PubMed] [Google Scholar]
- 36.Mugavero MJ, Westfall AO, Cole SR et al. Beyond core indicators of retention in HIV care: missed clinic visits are independently associated with all-cause mortality. Clin Infect Dis 2014; 59:1471–9. [DOI] [PMC free article] [PubMed] [Google Scholar]
Associated Data
This section collects any data citations, data availability statements, or supplementary materials included in this article.