


Abstract
GC skew is a measure of the strand asymmetry in the distribution of guanines and cytosines. GC skew favors R-loops, a type of three stranded nucleic acid structures that form upon annealing of an RNA strand to one strand of DNA, creating a persistent RNA:DNA hybrid. Previous studies show that GC skew is prevalent at thousands of human CpG island (CGI) promoters and transcription termination regions, which correspond to hotspots of R-loop formation. Here, we investigated the conservation of GC skew patterns in 60 sequenced chordates genomes. We report that GC skew is a conserved sequence characteristic of the CGI promoter class in vertebrates. Furthermore, we reveal that promoter GC skew peaks at the exon 1/ intron1 junction and that it is highly correlated with gene age and CGI promoter strength. Our data also show that GC skew is predictive of unmethylated CGI promoters in a range of vertebrate species and that it imparts significant DNA hypomethylation for promoters with intermediate CpG densities. Finally, we observed that terminal GC skew is conserved for a subset of vertebrate genes that tend to be located significantly closer to their downstream neighbors, consistent with a role for R-loop formation in transcription termination.
INTRODUCTION
CpG islands (CGIs) are critical regulatory DNA sequences that serve as promoters for >60% of human genes, particularly ‘housekeeping’ genes (1). In the human genome, CGIs are operationally defined at the sequence level as GC-rich regions that show a high density of CpG dinucleotides relative to the rest of the CpG-poor genome. In addition to their ability to promote transcription, CGIs make key contributions to genome organization by mediating numerous long-range promoter-promoter and promoter-enhancer interactions (2,3). Recent mapping data also show that up to 85% of CGI promoters function as early DNA replication origins (4).
CpGs in CGI promoters are unique in that they escape DNA methylation, an otherwise prevalent epigenetic modification associated with transcriptional silencing (5,6). The mechanisms by which CGI promoters remain protected from DNA methylation are under intense investigation and likely involve a series of interconnected layers operating at the DNA and chromatin levels. Transcription factor (TF) binding represents one such layer since TF occupancy correlates with low methylated regions over distal regulatory sites and promoters (7–9). The manner by which TF binding favors an unmethylated DNA state remains to be established but likely involves occlusion of the DNA sequence from DNA methyltransferase access through steric hindrance and/or a mechanism involving localized DNA demethylation (10–12). CpG density itself contributes to the unmethylated state (8) in a manner that may involve the recruitment of the CXXC domain-containing CFP1 protein (13). CFP1 binds to unmethylated CpG-rich regions and mediates the deposition of the histone H3 lysine 4 trimethylation (H3K4me3) mark on nearby nucleosomes (14). H3K4me3, a hallmark of unmethylated CGI promoters, is thought to prevent the binding of de novo DNA methyltransferases to these nucleosomes (15,16), shielding the surrounding DNA from their activity (17,18).
In addition to TF binding sites and CpG density, a third DNA sequence characteristic of CGI promoters has recently been proposed to contribute to the protection of these loci. GC skew, defined as strand bias in the distribution of guanines and cytosines, is a distinctive characteristic of unmethylated human CGI promoters (19). We have shown that in the human genome, GC skew sharply increases immediately downstream of transcription start sites (TSSs) of strong CGI promoters and remains high over a region including the first exon that overlaps with a large portion of the protected island (20). Transcription through regions of GC skew causes the formation of R-loop structures, in which the newly synthesized G-rich RNA strand hybridizes back to the template C-rich DNA strand owing to the superior thermodynamic stability of G-rich RNA:C-rich DNA hybrids (21,22). Genome-wide characterization of R-loop forming regions in the human genome showed that CGI promoters correspond to R-loop formation hotspots, as predicted by their GC skew (19,20). Further evidence showed that R-loop formation may play a functional role in protecting against DNA methylation (19,23). Altogether, these findings suggest that the co-transcriptional formation of R-loop structures, driven by GC skew, may also serve to preserve the unmethylated state of human CGI promoters.
CGI promoters are broadly distributed in the genomes of primates and rodents, and more generally in eutherian mammals (17,24). Given that these species carry a conserved global DNA methylation system and that CpG methylation leads to progressive loss of CpG sites through deamination (25), the conservation of CGI promoters implies the conservation of protection mechanisms at these loci. Indeed, mouse promoter CGIs are hypomethylated (26) and a large fraction of primate CGIs correspond to hypodeaminated islands overlapping with annotated TSSs (27). Recent DNA methylation profiling further suggests that non-methylated islands exist at gene promoters in a range of vertebrates even when CGIs are difficult to identify based on their CpG density and GC content characteristics (28). Importantly, the potential contribution of a GC-skew-associated, R-loop-based, protection mechanism has not been assessed outside of the human genome. More broadly, there is no systematic analysis of the distribution and conservation of GC skew in other animal genomes. Here, using a range of sequenced genomes in the chordate branch of the eukaryotic tree, we investigated the distribution of GC skew using a comparative genomics approach with a focus on promoter sequences. Transcription termination sites were also examined since they too correspond to hotspots of GC skew and are prone to R-loop formation in the human genome (20).
MATERIALS AND METHODS
Identification and retrieval of a conserved set of 458 genes across 60 sequenced chordate genomes
Orthologs of a set of 458 highly conserved genes (29) were identified in a total of 60 sequenced chordate genomes using Ensembl ortholog maps (version 75) (30). For naming convenience and due to space constraints, we used Ensembl common names to identify each species; for example: human (Homo sapiens), mouse (Mus musculus), platypus (Ornithorhynchus anatinus), chicken (Gallus gallus), lizard (Anolis carolinensis), frog (Xenopus tropicalis), pufferfish (Takifugu rubripes) and zebrafish (Danio rerio) were used. The term ‘Fish’ was used to refer to the non-tetrapod vertebrate group. The organisms’ common names and their scientific names are listed in Supplementary Table. Since the quality of genome drafts varies, orthologs for 91% of these genes were identified in each species on average (see Supplementary Table for full ortholog list). Given that in many organisms, the 5′-UTR and TSS are imprecisely annotated, the promoter for each gene were operationally defined as −500/+1500 bp around the coding start site (CSS). This approach is valid in calling promoter regions given that in well-annotated genomes the coding start site is located in the first exon of ∼80% of the genes surveyed here (Supplementary Figure S1A). Furthermore, the median size of 5′-UTRs is short (<250 bp) in all nine well-annotated genomes (Supplementary Figure S1B). Thus, in the human and mouse genomes which have among the longest 5′-UTRs of all genomes analyzed here, aligning genes at their CSSs allows us to clearly capture the CGI nature of these promoters (Supplementary Figure S1C). Terminal regions were defined as -500/+500 bp around the coding termination site (CTS) of each gene. This approach is again valid in capturing 3′-termination sequences given that the majority (>90%) of stop codons falls in the last exon (Supplementary Figure S1D) and 3′-UTR regions usually have a median length of <250 bp (Supplementary Figure S1E).
Calculation and visualization of CpG density, GC content, and GC skew
CpG density, GC content, and GC skew were calculated using a 200 bp sliding window and a step size of 1 bp. The results were aggregated over all core genes in each species and a meta-heatmap was created to integrate the results and aid visualization. For this, genes were aligned to their CSS and a 2 kb window around this site was examined (see Figure 2 for instance). Alternatively, a percentile plot was used where genes were aligned at their CSS and sequences including the first two exons and two introns downstream of the CSS were analyzed, when present (see Figure 4 for instance).
Figure 2.
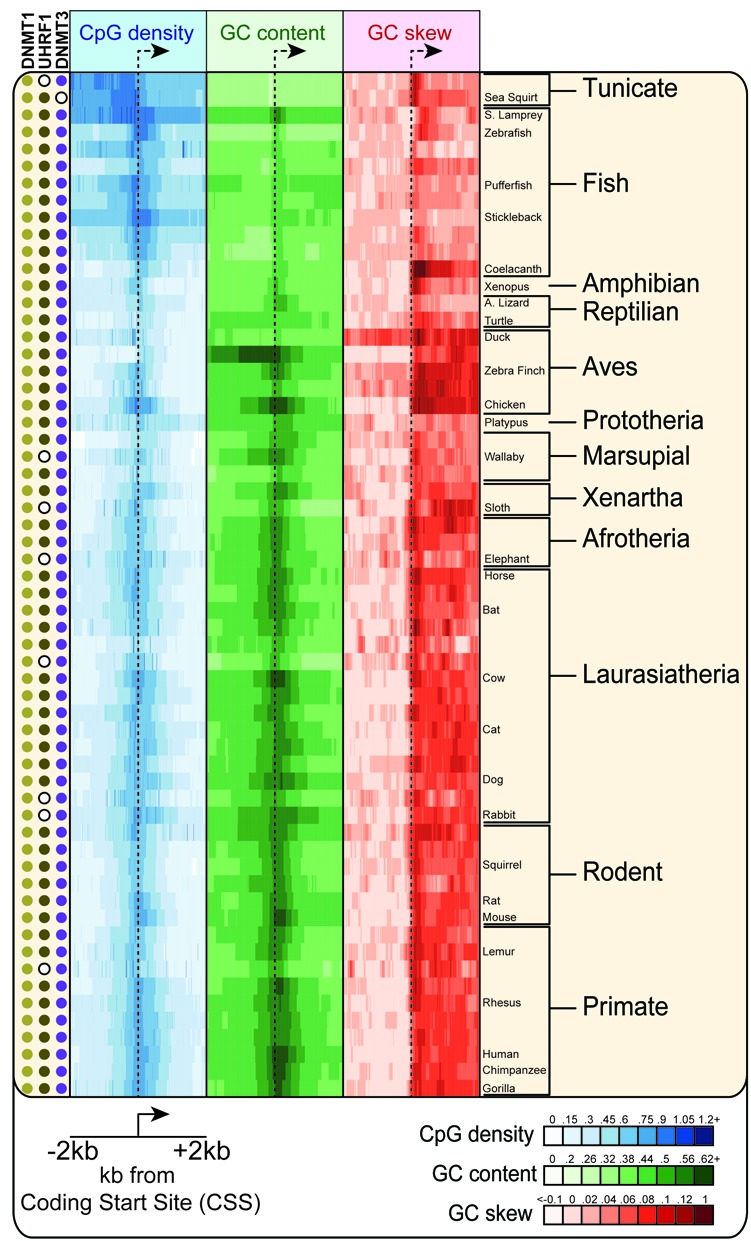
Conservation of CpG density, GC content and GC skew across chordates. A stretch of ±2 kb centered around the CSS of core genes was analyzed for CpG density, GC content, and GC skew over tiled overlapping windows. For each species, the value of each sequence metric measured over all core genes is depicted using a color scheme (see inset); each tick mark corresponds to one 200 bp window. Relevant taxonomic groups and species are indicated on the right. In each species, the presence of orthologs for the DNA methylation machinery is indicated by a colored dot. Absence of an ortholog is indicated by a white circle with a black outline.
Figure 4.
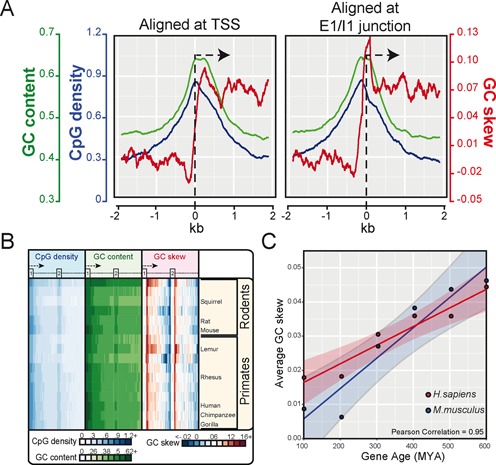
GC skew is maximal over the exon 1/ intron 1 junction. (A) GC skew, together with CpG density and GC content, is plotted over a ±2 kb window for core human genes aligned at their TSSs (left) or at the E1/I1 junction (right; single exon genes were excluded). (B) Heatmaps depicting CpG density, GC content and GC skew for all genes in primates and rodents. The data is shown as a percentile plot in which genes were aligned at the start of exon 1 and the first two exons and introns, when present, were normalized in size. A stripe of positive GC skew is observed immediately downstream of the E1/I1 junction. (C) Scatterplot depicting the strength of GC skew over the first 750 bp downstream of TSS as a function of gene age in human (red dots) and mouse (blue dots). Genes were binned by 100 million year intervals; the linear regression line is indicated together with the 95% confidence interval (shaded).
Determination of GC skew regions using the SkewR hidden Markov model
SkewR, a hidden Markov model (HMM) algorithm based on StochHMM (31) was used to identify GC-skewed regions in chordate genomes. SkewR was previously trained on human sequences known to form R-loops and its specificity was ensured by training a GC-rich (non-skewed) state (19,20). Given that many genomes investigated here significantly differed in GC composition from the human genome, we simplified the HMM by removing the GC-rich (non-skewed) state and re-trained the HMM for each organism individually using a training set derived from that organism. Namely, for each organism, we first calculated the GC skew over every promoter using a sliding window of 200 bp and then identified all promoter regions with contiguous GC skew above a threshold of 0.1 and ranked these regions by their collective GC skew over the 0.1 threshold. The top 500 most skewed regions were then used as a training set for each organism's GC skew state. SkewR was run using the organism-optimized SkewR model with a minimum posterior probability of 0.9 and a minimum length of 150 bp for the skewed states. To assess the accuracy of these annotations, we analyzed the sensitivity and precision of the new models in predicting R-loop forming regions in the human genome for which high-resolution, strand-specific, R-loop mapping data is available (20); data not shown). For this, we intersected the new SkewR predicted GC-skewed regions with gene promoters (−500/+1500 bp of CSS) that possess R-loop peaks and are expressed. We then compared the new annotations to the previously published ones (20). The new model was significantly more sensitive in predicting promoter R-loop peaks (92% versus 63%) with only a very slight change in precision (71% versus 74%), indicating that this method is valid for predicting R-loop forming regions. GC skew tracks for the 7 vertebrate species analyzed here are available in Supplementary Data 1. Terminal GC skew was annotated using the same GC skew tracks: a gene was called as GC-skewed if the region surrounding its CTS (−500/+500 bp) possessed positive terminal GC skew in the direction of transcription. We excluded genes that were too close to their neighbor (CTS <1 kb from neighbor) to avoid any confusion between these two genes’ individual GC skew profiles. CpG islands were annotated using UCSC Genome Browser CpGIslandext in all 60 genomes.
DNA methylation analysis
Whole genome bisulfite sequencing (WGBS) datasets from human embryonic stem cells, lung, brain and liver, available from GSM491349 (32), GSM432687 (33), GSM1173775 (34) and GSM916049 (35), were used for analysis. DNA methylation was extracted for each CGI in each class (TSS, intragenic, and intergenic) and displayed as a boxplot (Supplementary Figure S5). To measure the distribution of DNA methylation on GC skewed versus non-skewed promoter regions in seven vertebrate genomes, promoter regions (−500/+1500 bp of CSS) in each species were first intersected with that organism's SkewR regions to cluster genes into skewed and non-skewed classes. We next intersected these promoter regions with corresponding BioCAP data to identify unmethylated promoters (referred to as Non Methylated Island (NMI) (28)). Both testis and liver NMI data were taken into account; using either or both datasets did not affect our conclusions which is not surprising given the high degree of overlap (∼90%) of promoter NMI data (28). We further verified that the NMI data faithfully recapitulated quantitative DNA methylation data in the case of organisms for which WGBS datasets exist. Both types of analysis came to the same conclusion. Human, mouse, chicken, pufferfish and zebrafish WGBS datasets were also used to analyze the effect of GC skew on DNA methylation independently from CpG density and SkewR. For this, we first grouped promoters (1 kb around CSS) according to CpG density (ranging from 0.25 to 0.75 in 0.05 increments) and separated GC-skewed from non-skewed promoters by measuring the GC skew over a 750 bp window centered at the exon 1/intron 1 junction. Promoters with GC skew values ranging from −0.01 to 0.05 were considered as low GC skew and those with GC skew values >0.1 were considered as high GC skew. Each group contained around 300 individual loci therefore enabling statistical comparisons. The methylation state of these promoters was determined using whole-genome bisulfite sequencing data. Mouse liver, chicken lung and whole pufferfish WGBS data were obtained from GSM1051157 (36), GSM1372428, and GSM497270 (37), respectively.
Analyzing GC skew as a function of gene age
Gene age was inferred using the dataset from Zhang et al. (38) and each gene was binned by ∼100 million years interval. GC skew was then averaged over the first 750 bp of exon 1/intron 1 junction for all human and mouse genes and plotted against gene age for each species.
RESULTS
Assessing promoter and termination site conservation using a set of highly conserved core eukaryotic genes
To analyze the conservation of cis-acting regulatory sequences at promoter and termination sites across chordates, we focused on a set of 458 highly conserved core eukaryotic genes originally identified from six eukaryotic species ranging from budding yeast to human (29). The proteins encoded by these sets of orthologous genes show an average of 38% identity over 75% of their lengths when compared across these six species. These genes code for essential proteins involved in deeply conserved functions such as ribosome biogenesis, translation, RNA processing and DNA and RNA metabolism (see Supplementary Table for gene names and gene ontologies). We sought orthologs of these genes in 60 sequenced chordate genomes available through Ensembl (30) and recovered their genomic sequences, including flanking regions (Figure 1; see ‘Materials and Methods’ for details). This allowed us to extract putative promoter and termination site sequences for a large range of species and to analyze the evolution of cis-acting sequences involved in transcription initiation and termination in the context of highly conserved protein-coding genes.
Figure 1.
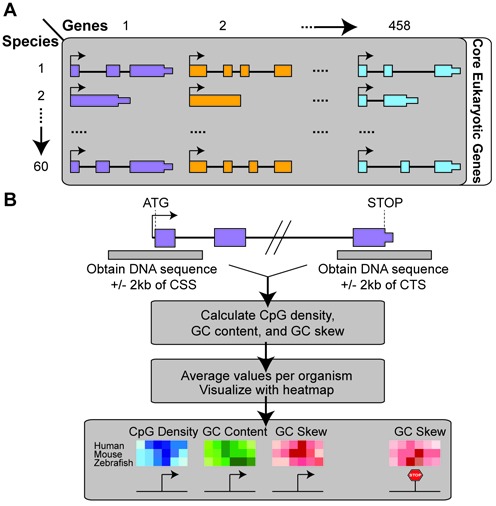
Data acquisition and analysis pipeline. See ‘Materials and Methods' for details.
GC-skewed CGI promoters are widely distributed across chordates
We first analyzed the conservation of ‘classic’ sequence metrics of CGI promoters such as GC content and CpG density (39). As expected, we observed strong conservation patterns for CGI promoters across mammals and most vertebrates (Figure 2). This is evidenced by the presence of a clear CpG-dense and GC-rich stripe around the center of the meta-heatmap. Furthermore, DNA sequence both upstream and downstream of the coding start site (CSS; see ‘Materials and Methods’) showed clear evidence for CpG depletion in most species. These patterns are consistent with the existence of global DNA methylation systems in these species and the gradual loss of methylated CpG sites through deamination (25). Almost all vertebrates possess orthologs of the mammalian DNMT3 and UHRF1/DNMT1 DNA methyltransferase machinery (Figure 2). This indicates that CGI promoters in vertebrates retain a high CpG density around the TSS owing to the existence of a protection mechanism against DNA methylation (hypodeaminated regime; (27)). In lower vertebrates such as stickleback and pufferfish, the classic signatures of CGI promoters can still be distinguished, with a high CpG density cluster around the CSS (Figure 2). Depletion of CpG sites in the gene body and/or upstream of the CSS isn't as evident as in higher mammals, which makes the detection of a CpG ‘island’ more difficult. This is further compounded by the fact that these genomes are often AT-rich. Nonetheless, the data supports the existence of the CGI promoter class in fish, in agreement with recent evidence showing that non-methylated DNA exists at the beginning of numerous genes in zebrafish (28). In lower chordates such as the tunicate Ciona intestinalis and Ciona savignyi, the identification of CGI promoters based on CpG density and GC content is difficult. While CpG loss occurs within the transcribed unit, only little CpG loss occurs in the intergenic space upstream of promoters; in addition these genomes are very AT-rich. Altogether, this suggests that CGI promoters are conserved broadly among vertebrates, including mammals, marsupials, reptiles, birds, and to some extent fish.
In addition to the CpG density and GC content DNA sequence metrics, our analysis shows that positive GC skew downstream of the promoter is a broadly conserved property of the CGI promoter class in chordates (Figure 2). This is illustrated by a clear increase in the color density of the GC skew meta-heatmap on the right side of the CSS. Interestingly, the basal chordates Ciona intestinalis and Ciona savignyi showed significant shifts in promoter GC skew although these promoters displayed only minimal CGI characteristics. This suggests that promoter GC skew may have evolved prior to the emergence of the CGI promoter class and the divergence of chordates from other metazoans.
To broaden these findings, we expanded our study to include all genes in each genome. These results show that the GC-skewed CGI promoter architecture is both conserved and prevalent in higher vertebrates, accounting for 65–80% of core gene promoters and 35–50% of all gene promoters in the primate, rodent, eutherian mammal, bird and reptile groups (Figure 3A). The higher distribution of GC-skewed CGI promoters among essential core genes is consistent with the fact that housekeeping genes are enriched for CGI promoters (1,19,40). As expected from the low CGI numbers and low GC content of the fish and tunicate genomes, the share of GC-skewed CGI promoters in the fish sub-group was lower (12%) and minimal (1%) in tunicates. Metaplots of GC content, CpG density, and GC skew (Figure 3B, Supplementary Figure S2A) clearly showed that the position and amplitude of the GC skew transition at GC-skewed CGI promoters are highly consistent across vertebrates. For core genes, GC skew rose from a near zero genomic average to an average maximal of ∼0.1 within a narrow 300 bp region. This region of GC skew transition matched well with the boundaries of CGIs and endowed these elements with an intrinsic directionality that is not otherwise afforded by the generally symmetrical GC content and CpG density metrics. Bird and reptilian species also showed strong GC skew transitions around the CSS, with particular bird species (chicken, duck) showing especially high maximal GC skew and GC content values. Similar GC skew transitions were observed in amphibian and fish species, albeit the overall preponderance of classic CGI elements was reduced as expected. As gathered above from the meta-heatmap analysis (Figure 2), even tunicates showed GC skew transitions around the promoter region even though they only carry a few CGI-type promoters. Similar trends were observed when all genes were analyzed (Supplementary Figure S2A). Outside of chordates, a significant number of metazoans displayed high GC skew downstream of the promoter region (Supplementary Figure S2B). In some of these species (e.g. honeybee), peaks of GC skew coincided with exons, suggesting it may represent codon usage bias. Altogether, our data show that GC-skewed CGIs represent a broad class of promoters that is conserved across higher chordates. Given that GC skew predicts R-loop formation, this suggests that promoter R-loop structures are conserved across chordates and perhaps even in a number of metazoans.
Figure 3.
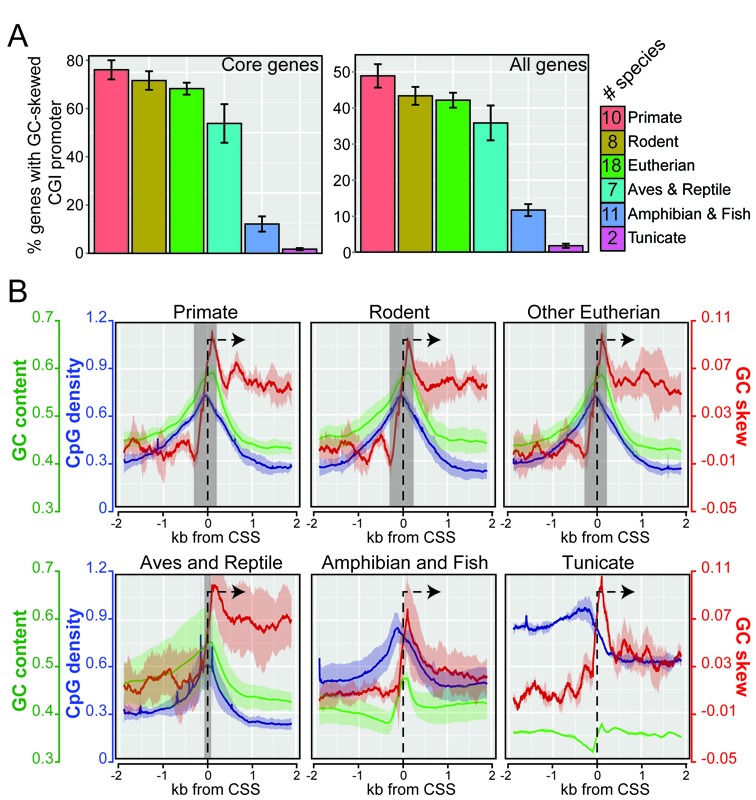
GC-skewed CGI promoters are widely distributed across chordates. (A) Bar graph showing the percentage of gene promoters that belong to the GC-skewed CGI class in various species subgroups for both core genes (left) and all genes (right). The data is shown as the average value of a species sub-group together with error bars corresponding to the standard deviation for the sample (the number of species in each sample is indicated). (B) GC-skewed CGI promoters (core genes) show conserved DNA sequence profiles across chordates. Metaplots of CpG density (green), GC content (blue) and GC skew (red) across chordate subgroups. Annotated genes were aligned at their CSS (broken arrow). Lines represent the average of each value in each subgroup; the shaded area represents standard deviation. The gray shaded stripe highlights the footprint of CGIs in each subgroup as determined by the classic criteria of CpG density >0.6 and GC content > 50%.
Promoter GC skew peaks at the exon 1/intron 1 junction and is highly correlated with gene age
Promoter GC skew typically peaks ∼200 bp downstream of the TSS in the human genome and progressively returns back down to the genome-wide average (Figure 4A and B). Given that the median size of exon 1 in human is 218 bp and that the length of GC skew correlates with the length of the first exon (20), we examined whether GC skew could in fact be a property of the exon 1/intron 1 (E1/I1) junction. For this, we re-plotted all three CGI promoter sequence metrics (CpG density, GC% and GC skew) over this junction. GC skew rose over the length of the first exon and underwent an abrupt transition in the immediate vicinity of the E1/I1 junction (Figure 4A). When analyzed in this manner, the peak of GC skew was clearly higher in value than that observed when aligning at TSS (Figure 4A; compare right and left). Furthermore, the width of the GC skew spike was narrower, returning down sharply within the first 500 bp and then more slowly thereafter. Interestingly, CpG density and GC content still peaked around the TSS, indicating that these two DNA sequence metrics are TSS-anchored while the peak of GC skew is anchored to the E1/I1 boundary. Using a percentile plot where genes are aligned at the start of exon 1 and the first two exons and introns (when present) are normalized in size, we confirmed that the rise of GC skew at the first exon/intron junction is a conserved property of primates and rodents (Figure 4B), and more generally of most chordates (Supplementary Figure S3). These plots also revealed well-known patterns of negative GC skew (i.e. C-rich motifs) at the intron 1/exon 2 splice junction, followed by a second, weaker peak of positive GC skew at the exon 2 / intron 2 junction (Figure 4B). These findings are consistent with the E1/I1 boundary being a target for the U1 small nuclear ribonucleoprotein since U1 sites are GC-rich and GC skewed, at least in human. A recent study showed that the density of U1 sites downstream of TSS is higher for evolutionarily older genes, particularly housekeeping genes transcribed from CGI promoters (41). To test whether promoter GC skew follows the same evolutionary trends, we measured GC skew over a 750 bp window downstream of all TSSs and plotted this as a function of gene age in the human and mouse genomes. In both cases, we observed a strong positive correlation (>0.95) between GC skew and gene age (Figure 4C). This correlation was not simply due to the presence of U1 motifs as it remained nearly unchanged even after three of the strongest U1 motifs (GGTAAG, GGUGAG and GUGAGU) were removed (data not shown). Metaplots of CpG density, GC content, and GC skew over genes ranked by gene age clearly confirmed that the CGI strength and GC-skewed character of TSSs in human and mouse becomes more evident in evolutionarily older genes (Supplementary Figure S4).
GC-skewed CGIs represent bona fide unmethylated promoter regions across vertebrates
One possible hypothesis to explain the conservation of GC-skewed CGI promoters in vertebrates is that GC skew-driven R-loop formation at TSSs may contribute to maintaining the unmethylated state of these promoters (19). In the human genome, previous studies showed that GC skew is correlated with, and predictive of, the unmethylated state of CGI promoters (19,20). In an extension of these findings, we show that human CGIs with strong GC skew were enriched at annotated TSSs and depleted over intragenic and intergenic regions (Supplementary Figure S5A). In contrast, CGIs with low or no GC skew made up the majority of CGIs in the intra- and intergenic compartments. Thus, strong GC skew is a characteristic of a subset of human CGIs that overlap with promoter regions. Furthermore, we confirmed that promoter CGIs with strong GC skew tended to remain unmethylated in multiple tissues while CGI promoters with low or no GC skew were variably methylated (Supplementary Figure S5B), Thus, strong GC skew is correlated with the unmethylated state of human promoter CGIs.
To test whether the association between GC skew and unmethylated CGI promoters holds true outside of the human genome, we used our SkewR Hidden Markov Model algorithm to systematically annotate regions of GC skew in seven vertebrate genomes for which DNA methylation data is available. The procedure by which this was performed is described under Methods and corresponding GC skew tracks are available in Supplementary Data 1. We then used available promoter annotations in each genome and classified promoters as either having GC skew or not. The DNA methylation state of these regions was determined using data from Long et al. in which unmethylated DNA regions were profiled using the BioCAP method (28). In the human genome, over 75% of GC-skewed promoters were unmethylated while only 7% of non-skewed promoters were unmethylated, consistent with expectations (Figure 5A). In the mouse, this trend was even stronger with 85% of GC-skewed promoters unmethylated as opposed to 4% of non-skewed loci. In the frog, chicken, lizard and platypus, 35–55% of GC-skewed promoters were unmethylated. In contrast, non-skewed promoters were 5–10 times less likely to be unmethylated. Promoters in zebrafish were the only ones to escape that trend since GC-skewed and non-skewed promoters were equally likely to be methylated. This reflects the fact that contrary to many other vertebrate genomes, even non-skewed promoters tended to remain unmethylated in zebrafish. Similar results were obtained when we used whole genome bisulfite sequencing (WGBS) data in human, mouse, chicken and zebrafish (Figure 5B). With the exception of zebrafish, our data shows that GC-skewed promoters tend to correspond to unmethylated loci in vertebrates.
Figure 5.
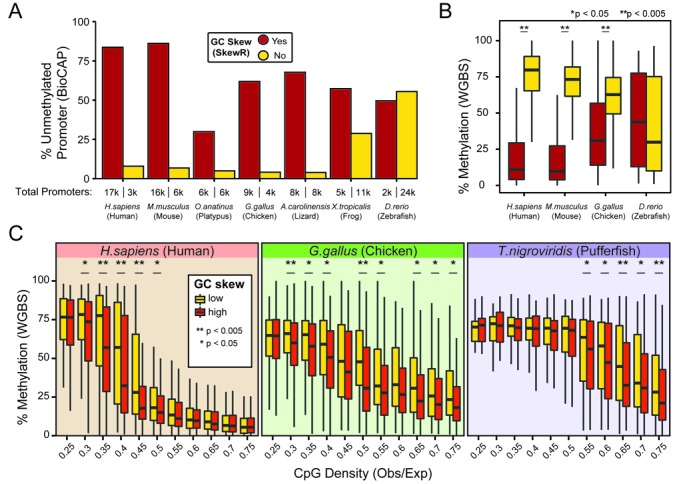
GC skew imparts protection against DNA methylation in chordates. (A, B) Promoters were first categorized as possessing, or not, GC skew using novel SkewR annotations (see ‘Materials and Methods' for details). Panel A, reports the percentage of unmethylated promoters in seven vertebrate species for which BioCAP data is available (28). The total number of promoter in each category is indicated at bottom. Panel B reports actual DNA methylation levels in four vertebrate species for which WGBS data is available using a boxplot representation. Median values are shown by a thick line. (C) Promoters were grouped by CpG density (x-axis) and by whether or not they were GC-skewed measured independently of SkewR (see ‘Materials and Methods' for details). The degree of methylation for each promoter group in each species was measured using WGBS data. The data is graphed as boxplots for which the median is shown as a thick line. In panels B and C, P-values were measured by one-tailed Wilcoxon rank-sum statistical test.
We next analyzed the reciprocal relationship between DNA methylation and GC skew by categorizing promoters solely on their DNA methylation state and asking if differences in GC skew, CpG density, and GC content could be observed. CpG density was particularly enriched over unmethylated promoters across all seven species (Supplementary Figure S5C and D). This result shows that CpG density itself is a good predictor of unmethylated DNA, a conclusion entirely expected from the fact that CpG density is a direct result of the protection of promoters from cytosine deamination. GC content, which is tied to CpG density, also showed significant increase over unmethylated promoters for all species. Likewise, GC skew showed significant enrichment over unmethylated promoters in all species although the relative difference between unmethylated and methylated promoters was not as pronounced as those observed for CpG density and GC skew (Supplementary Figure S5C and D).
To further disentangle the relative contributions of CpG density and GC skew, we grouped promoters by CpG density and asked if promoter GC skew measured independently of SkewR at the exon 1/intron 1 boundary made any difference to the methylation state of these loci, as measured using WGBS data. As expected, increasing CpG density was associated with significant trends towards DNA hypomethylation in all species analyzed regardless of GC skew (Figure 5C), confirming well known trends (42). However, GC skew was associated with significant additional hypomethylation for loci showing intermediate range of CpG densities for species ranging from human to fish (Figure 5C). For instance, human promoters with CpG densities ranging from 0.3 to 0.45 showed significant DNA hypomethylation compared to non-skewed loci with matched CpG densities. Similarly, pufferfish promoters showed significant DNA hypomethylation at CpG densities ranging from 0.55 to 0.75. This pattern was true for all species analyzed although it was noticeably weaker for zebrafish, in agreement with our prior observations. Importantly, the trend towards DNA hypomethylation imparted by GC skew was only observed when GC skew was measured at the E1/I1 junction: grouping promoters by GC skew measured either upstream (−750 to 0 bp from CSS) or further downstream (1500–2250 bp from E1/I1 junction) imparted little to no trend in any of these species (Supplementary Figure S6). Thus, under this carefully controlled setting, the hypomethylation tendencies observed at intermediate CpG densities can primarily be attributed to GC skew itself. Altogether, these results suggest that GC-skewed CGI promoters correspond to bona fide unmethylated loci across vertebrates and that GC skew most strongly impacts the methylation state of promoters with intermediate CpG densities.
Terminal GC skew is conserved in closely arranged chordate genes
In the human genome, GC skew exists at thousands of transcription termination sites (20). Here, we broadened this analysis to include all 60 sequenced chordate species previously analyzed for promoter patterns. Contrary to promoter GC skew, which showed strong amplitude shifts at the beginning of vertebrate genes (Figures 2 and 3), terminal GC skew was weak and devoid of patterns over core genes (Figure 6A) or all genes (data not shown). Using our novel GC skew annotations extended to include all 60 species, we determined that terminal GC skew was also less frequent than promoter GC skew. Terminal GC skew was detected for 15–25% of genes in higher chordates, dropping to 3–7% in fish and tunicates (Figure 6B). When we focused on genes that harbored terminal GC skew, we observed a large peak of GC skew around the coding termination site (CTS) interrupted by a short patch of negative GC skew corresponding to the last intron / exon junction (Figure 6C and data not shown). Altogether, this establishes that terminal GC skew is a conserved property of a subset of genes in chordates. As observed in human, the presence of terminal GC skew did not correlate with any particular gene ontology classification (data not shown). Likewise, terminal GC skew did not correlate with gene age (data not shown).
Figure 6.
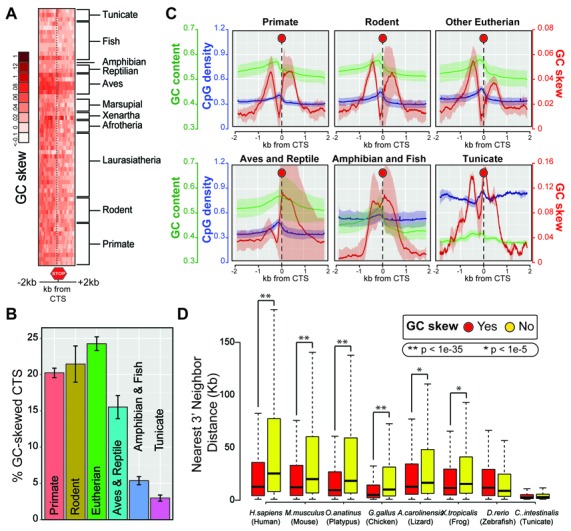
Terminal GC skew is a conserved feature of a subset of closely arranged genes in chordates. (A) Patterns of GC skew in a 2 kb window surrounding the coding termination site (CTS) of core genes are shown as a heatmap. Chordates do not show distinctive patterns of GC skew around the CTS. (B) For each group of organisms, the frequency of terminal GC skew as annotated by our new SkewR algorithm is indicated as a percentile boxplot (with standard deviation). Only a subset of genes carries terminal GC skew. (C) Metaplots depicting the position and amplitude of GC skew, GC content, and CpG density shifts around the CTS in various chordate subgroups. Representations are as in Figure 3B. (D) Genes with strong terminal GC skew tend to be more closely arranged than non-skewed genes in a subset of species. The boxplot shows the mean inter-gene distance between GC-skewed genes and non-skewed genes. Statistical significance as determined by a Wilcoxon rank-sum test is indicated above.
Furthermore, we have shown previously that terminal GC skew is enriched for closely arranged genes in the human genome (20). Here, we investigated if this relationship applied in other chordates. For this, we clustered genes by the presence or absence of 3′ GC skew and calculated the distance to their nearest downstream neighbor. In the human, mouse, platypus, and chicken genomes, genes with terminal GC skew had significantly closer neighbors (∼50–70% closer) than non GC-skewed genes (Figure 6D). This trend, while still significant, was reduced in lizard and frog, but disappeared in zebrafish and tunicate. This suggests that the association of terminal GC skew with gene density only holds true for a subset of chordates. A more systematic analysis of this relationship revealed that genes with terminal GC skew tended to be more closely arranged than their non-GC skewed counterparts in organisms for which mean inter-gene distance was higher (i.e. organisms for which genes tend to be located farther from each other) (Supplementary Figure S7). Thus it appears that terminal GC skew has been favored in a subset of closely arranged genes in animals with larger genomes.
DISCUSSION
CGI promoters are key cis-acting DNA sequences that serve as transcription initiation sites for the majority of human genes. In agreement with previous studies (24,43), our work confirms that CGI promoters are broadly conserved across many chordate species. In addition to the CpG density and GC content sequence metrics that are classically used to identify CGIs, we now add GC skew as a third highly conserved sequence characteristic of the chordate CGI promoter class. GC-skewed CGIs are broadly conserved in primates, rodents, and other eutherian mammals, as well as birds, where they represent a major class of promoters (Figures 2 and 3). CGI promoters also appear to be conserved in amphibians and reptiles although the lower number of sequenced genomes available in these two subgroups prevents us from reaching a definitive conclusion. Thus, from humans to chickens, CGI promoters have been conserved through at least 310 million years of evolution. GC-skewed CGI promoters, while still present, are noticeably less represented in fish genomes (Figure 3). This is in agreement with recent data showing that CGI promoters are rare in zebrafish despite the presence of numerous non-methylated islands (28). Basal chordates such as tunicate appear to carry only few GC-skewed CGI promoters, although promoters in general tended to show a shift in GC skew reminiscent of that observed in higher chordates (Figure 3). A number of non-chordate metazoans also showed chordate-like promoter GC skew patterns (Supplementary Figure S2B). Thus, while the emergence of CGI promoters can be traced towards the root of the vertebrate tree, GC skew likely pre-dates the appearance of chordates. This is in agreement with previous observations (44,45). Altogether, we propose that GC skew be included as an integral sequence metric in the definition of bona fide CGI promoters. The availability of high quality GC skew annotation tracks generated by our SkewR Hidden Markov Model in a wide range of chordate species will facilitate the adoption of this definition.
The inclusion of GC skew as part of the identity of a given CGI allows for important functional insights. In the human genome, the likelihood that a CGI with strong GC skew overlaps with a promoter element is 82%, as opposed to only 60% for all CGIs, or 45% for CGIs with no GC skew (Supplementary Figure S5A). Likewise, CGIs with strong GC skew tend to resist DNA methylation regardless of their genomic context, while CGIs with low or no GC skew tend to be hyper- or variably methylated, even when located at TSSs (Supplementary Figure S5B). The trend towards DNA hypomethylation observed for GC-skewed CGI promoters compared to non-skewed promoters was conserved in six out of seven vertebrate species spanning the vertebrate tree (Figure 5A and B). This indicates that GC skew can be used to identify unmethylated promoter CGI elements across a broad range of species. The inclusion of GC skew also adds important information regarding the directionality of a given CGI promoter. Without knowledge of GC skew, CGI promoters are devoid of directionality, with the distribution of CpG density and GC content nearly symmetrical around the TSS (Figure 3B). GC skew, by contrast, is intrinsically directional, with the transition in GC skew occurring around the TSS and positive GC skew indicating the direction of the transcribed gene (bi-directional genes show bi-directional GC skew transitions; data not shown). GC skew is therefore a useful DNA sequence metric for functional promoter annotation.
This study was concerned with deepening our understanding of the manner in which GC skew may instruct DNA methylation protection and with disentangling the effects of GC skew from those of other sequence metrics such as CpG density, GC content and promoter location. Not surprisingly, our results show that CpG density—itself the direct product of DNA methylation protection—is the strongest predictor of the unmethylated DNA state (Supplementary Figure S5C and D). This is compatible with evidence showing that CpG density contributes to the recruitment of factors that may maintain the unmethylated state such as CXXC-containing proteins (6) or CG-rich binding transcription factors (46). Our analysis nonetheless reveals that even when CpG density and GC content are carefully matched, a subset of GC-skewed promoters show significant DNA hypomethylation trends compared to non-skewed promoters (Figure 5C). This effect is particularly visible for promoters with intermediate CpG densities, ranging from 0.3 to 0.6 in higher vertebrates. This observation raises the interesting possibility that these promoters may be evolving toward a CGI promoter state and find themselves in a position where their CpG density is at the same time high enough to attract the DNA methylation machinery but not high enough to attract other CpG density-based protective mechanisms. Thus GC skew might have a particularly strong effect on such CGI promoters ‘wannabes’. Our observation (Figure 4) and that of others (41) showing that CpG density and GC skew have co-evolved and are much more evident in older genes supports this model.
Despite evidence that GC skew affords protection against DNA methylation, its mechanism of action has yet to be fully elucidated. One possibility is that TFs have progressively adapted to recognize GC-skewed DNA sequences, thereby favoring promoter CGIs which tend to be GC-skewed, over non-skewed CGIs. Under this hypothesis, the strong correlation between GC skew and absence of DNA methylation could reflect a TF-based mechanism, as proposed earlier for distal regulatory sites (7–9). A cursory evaluation of transcription factor (TF) binding sites reveals that a range of TFs typical of CGI binding (Sp, KLF, MZF, E2F, EGR, ELF families) bind to highly GC-rich and GC-skewed motifs. For instance, the canonical Sp1 binding motif, 5′-GGGCGGG-3′ is GC-skewed and higher binding affinities were recorded for even longer GC-skewed variants (5′-GGGTGGGCGTGGC-3′) (47). Another possible mode of action stems from the fact that GC skew, together with the presence of guanine clusters and the availability of the 5′-end of the nascent transcript (48,49), also favors co-transcriptional R-loop formation. In agreement, R-loop profiling in human cells confirms that CGI promoters are major hotspots of R-loop formation (19,20) and we and others have shown that R-loop structures exert a protective effect against DNA methylation (19,23). A model based solely on a direct inhibition of DNA methyltransferase (DNMT) action by R-loop structures is, however, unlikely. Such a model would imply that R-loop formation frequency is sufficiently high, and the residence time of R-loops on individual chromosomes sufficiently long, to block DNMT action as long as it is required. This is unlikely given the links between R-loop formation, transcription stalling, and genomic instability (50,51). Furthermore, genes with CGI promoters tend to be highly expressed and therefore require a rapid rate of transcription re-initiation. The role of R-loops in DNA methylation protection is therefore more likely to involve the recruitment of specific proteins and/or to operate at the level of the chromatin state of CGI promoters.
This study furthers our understanding of the evolution of GC skew at promoter regions. Analysis of substitution rates along human genes revealed that CGI promoters are characterized by an excess of C to T and A to G transitions on the non-template strand over a region extending 1–2 kb downstream of the promoter (52). This was proposed to occur as a result of transcription driving an increased rate of substitutions on a single-stranded DNA (ssDNA) intermediate (52,53). Here, we suggest that this pattern occurred in two steps. First, transcription initiation, including open complex formation and proximal promoter pausing, generates significant local ssDNA (54), enabling a local build-up of GC skew and GC content through C to T and A to G transitions. Second, co-transcriptional R-loop formation initiated by promoter GC skew and G clustering (48), further exposes the non-template strand in an unpaired state, favoring additional mutations. ssDNA footprinting on endogenous R-loop structures shows that R-loop formation can extend up to 1 kb from the TSS (19,55,56), supporting a role for R-loops in shaping DNA sequence asymmetries downstream of the TSS. Transcription initiation, co-transcriptional R-loop formation, and GC skew-building mutations on exposed, unpaired DNA therefore create a self-reinforcing loop that can explain the DNA sequence patterns observed downstream of vertebrate CGI promoters. A similar mechanism was recently proposed to account for the evolution of new genes on the antisense direction from established CGI promoters (57). Under this proposed mechanism, R-loop-mediated GC skew enhancement also serves to ensure the presence of G-rich and GC-skewed U1 small nuclear ribonucleoprotein (snRNP) recognition sites and the suppression of AT-rich termination sites (41). In support of this model, we show that GC skew not only extends over the entire length of the first exon in the human genome (20) but peaks precisely at the exon 1 / intron 1 junction in all chordate genomes studied here (Figure 4). Furthermore, we show that the GC-skewed and CGI character of promoters is clearly more apparent for evolutionarily older genes (Figure 4C and Supplementary Figure S4). Thus, it is possible that the build-up of GC skew downstream of the promoters of highly transcribed, well conserved, housekeeping genes contributed to the presence of strong splice signals and the suppression of spurious termination signals. This is particularly important given that CGI promoters lack in directionality and require correction mechanisms (58–60). The interplay between R-loop formation, GC skew, and splicing is supported by the observation that defects in splicing factors, including the conserved ASF/SF2 protein (SRSF1), favor R-loop formation (61,62). This in turn suggests that the evolution of GC-rich and GC-skewed promoters enabled such a degree of R-loop formation that binding of splicing factors to the nascent pre-mRNA is required to prevent entanglement of the G-rich transcript with its DNA template, thereby dampening R-loop formation and the genomic instability associated with excess R-loops (50).
The resolution of R-loops formed over GC-skewed regions located at the 3′-end of genes has been implicated in a pause-dependent transcription termination mechanism (63). We previously showed that terminal GC skew and R-loop formation occurred for hundreds of human genes, particularly closely-arranged genes for which efficient termination might prevent transcriptional read-through into neighboring genes (20). Here, we show that terminal GC skew is a conserved property of a subset of genes across chordates. We further present evidence that these genes tend to be more closely arranged than other genes in these genomes (Figure 6). This strongly suggests that transcriptional pausing over R-loop forming sequences may be a conserved transcription termination mechanism in a number of species. Our data also shows that the tendency of 3′ GC skew to associate with closely arranged genes only applies to a subset of species for which mean inter-gene distances are large (Supplementary Figure S7). In species with more densely packed genomes, genes with terminal GC skew do not appear to be more closely located to their neighbor than genes without GC skew. This could be explained if one assumes that genes in compact, gene-dense, genomes all undergo efficient transcription termination using R-loop-dependent or independent mechanisms. As genomes grew larger and mean inter-gene distance rose, we speculate that the constraints on efficient termination were reduced overall, except for genes located in denser clusters.
Supplementary Material
Acknowledgments
We thank Keith Bradnam, Yoong Wearn Lim, Lionel Sanz, John Smolka, Riley Galton, Aparna Rajpurkar, and other members of the Chédin lab and Korf lab for critical reading of the manuscript.
Author contributions: S.R.H. performed all the data analysis. S.R.H., I.F.K. and F.C. conceived the study. F.C. and I.F.K. supervised the work and provided guidance. F.C. and S.R.H. wrote the paper.
SUPPLEMENTARY DATA
Supplementary Data are available at NAR Online.
FUNDING
National Institutes of Health [GM094299 to F.C.]; Howard Hughes Medical Institute International Student Research Fellowship (current), American Association of University Women International Student Fellowship (2012), and UC Davis Summer Graduate Student Research Awards (2013 & 2014) [to S.R.H.]. Funding for open access charge: National Institutes of Health [GM094299].
Conflict of interest statement. None declared.
REFERENCES
- 1.Illingworth R.S., Bird A.P. CpG islands–‘a rough guide’. FEBS Lett. 2009;583:1713–1720. doi: 10.1016/j.febslet.2009.04.012. [DOI] [PubMed] [Google Scholar]
- 2.Li G., Ruan X., Auerbach R.K., Sandhu K.S., Zheng M., Wang P., Poh H.M., Goh Y., Lim J., Zhang J., et al. Extensive promoter-centered chromatin interactions provide a topological basis for transcription regulation. Cell. 2012;148:84–98. doi: 10.1016/j.cell.2011.12.014. [DOI] [PMC free article] [PubMed] [Google Scholar]
- 3.Sanyal A., Lajoie B.R., Jain G., Dekker J. The long-range interaction landscape of gene promoters. Nature. 2012;489:109–113. doi: 10.1038/nature11279. [DOI] [PMC free article] [PubMed] [Google Scholar]
- 4.Picard F., Cadoret J.C., Audit B., Arneodo A., Alberti A., Battail C., Duret L., Prioleau M.N. The spatiotemporal program of DNA replication is associated with specific combinations of chromatin marks in human cells. PLoS Genet. 2014;10:e1004282. doi: 10.1371/journal.pgen.1004282. [DOI] [PMC free article] [PubMed] [Google Scholar]
- 5.Smith Z.D., Meissner A. DNA methylation: roles in mammalian development. Nat. Rev. Genet. 2013;14:204–220. doi: 10.1038/nrg3354. [DOI] [PubMed] [Google Scholar]
- 6.Baubec T., Schubeler D. Genomic patterns and context specific interpretation of DNA methylation. Curr. Opin. Genet. Dev. 2014;25:85–92. doi: 10.1016/j.gde.2013.11.015. [DOI] [PubMed] [Google Scholar]
- 7.Hodges E., Molaro A., Dos Santos C.O., Thekkat P., Song Q., Uren P.J., Park J., Butler J., Rafii S., McCombie W.R., et al. Directional DNA methylation changes and complex intermediate states accompany lineage specificity in the adult hematopoietic compartment. Mol. Cell. 2011;44:17–28. doi: 10.1016/j.molcel.2011.08.026. [DOI] [PMC free article] [PubMed] [Google Scholar]
- 8.Lienert F., Wirbelauer C., Som I., Dean A., Mohn F., Schubeler D. Identification of genetic elements that autonomously determine DNA methylation states. Nat. Genet. 2011;43:1091–1097. doi: 10.1038/ng.946. [DOI] [PubMed] [Google Scholar]
- 9.Stadler M.B., Murr R., Burger L., Ivanek R., Lienert F., Scholer A., van Nimwegen E., Wirbelauer C., Oakeley E.J., Gaidatzis D., et al. DNA-binding factors shape the mouse methylome at distal regulatory regions. Nature. 2011;480:490–495. doi: 10.1038/nature10716. [DOI] [PubMed] [Google Scholar]
- 10.Feldmann A., Ivanek R., Murr R., Gaidatzis D., Burger L., Schubeler D. Transcription factor occupancy can mediate active turnover of DNA methylation at regulatory regions. PLoS Genet. 2013;9:e1003994. doi: 10.1371/journal.pgen.1003994. [DOI] [PMC free article] [PubMed] [Google Scholar]
- 11.Hsieh C.L. Evidence that protein binding specifies sites of DNA demethylation. Mol. Cell Biol. 1999;19:46–56. doi: 10.1128/mcb.19.1.46. [DOI] [PMC free article] [PubMed] [Google Scholar]
- 12.Lin I.G., Hsieh C.L. Chromosomal DNA demethylation specified by protein binding. EMBO Rep. 2001;2:108–112. doi: 10.1093/embo-reports/kve023. [DOI] [PMC free article] [PubMed] [Google Scholar]
- 13.Long H.K., Blackledge N.P., Klose R.J. ZF-CxxC domain-containing proteins, CpG islands and the chromatin connection. Biochem. Soc. Trans. 2013;41:727–740. doi: 10.1042/BST20130028. [DOI] [PMC free article] [PubMed] [Google Scholar]
- 14.Thomson J.P., Skene P.J., Selfridge J., Clouaire T., Guy J., Webb S., Kerr A.R., Deaton A., Andrews R., James K.D., et al. CpG islands influence chromatin structure via the CpG-binding protein Cfp1. Nature. 2010;464:1082–1086. doi: 10.1038/nature08924. [DOI] [PMC free article] [PubMed] [Google Scholar]
- 15.Ooi S.K., Qiu C., Bernstein E., Li K., Jia D., Yang Z., Erdjument-Bromage H., Tempst P., Lin S.P., Allis C.D., et al. DNMT3L connects unmethylated lysine 4 of histone H3 to de novo methylation of DNA. Nature. 2007;448:714–717. doi: 10.1038/nature05987. [DOI] [PMC free article] [PubMed] [Google Scholar]
- 16.Otani J., Nankumo T., Arita K., Inamoto S., Ariyoshi M., Shirakawa M. Structural basis for recognition of H3K4 methylation status by the DNA methyltransferase 3A ATRX-DNMT3-DNMT3L domain. EMBO Rep. 2009;10:1235–1241. doi: 10.1038/embor.2009.218. [DOI] [PMC free article] [PubMed] [Google Scholar]
- 17.Deaton A.M., Bird A. CpG islands and the regulation of transcription. Genes Dev. 2011;25:1010–1022. doi: 10.1101/gad.2037511. [DOI] [PMC free article] [PubMed] [Google Scholar]
- 18.Rose N.R., Klose R.J. Understanding the relationship between DNA methylation and histone lysine methylation. Biochim Biophys Acta. 2014;1839:1362–1372. doi: 10.1016/j.bbagrm.2014.02.007. [DOI] [PMC free article] [PubMed] [Google Scholar]
- 19.Ginno P.A., Lott P.L., Christensen H.C., Korf I., Chedin F. R-loop formation is a distinctive characteristic of unmethylated human CpG island promoters. Mol Cell. 2012;45:814–825. doi: 10.1016/j.molcel.2012.01.017. [DOI] [PMC free article] [PubMed] [Google Scholar]
- 20.Ginno P.A., Lim Y.W., Lott P.L., Korf I., Chedin F. GC skew at the 5′ and 3′ ends of human genes links R-loop formation to epigenetic regulation and transcription termination. Genome Res. 2013;23:1590–1600. doi: 10.1101/gr.158436.113. [DOI] [PMC free article] [PubMed] [Google Scholar]
- 21.Ratmeyer L., Vinayak R., Zhong Y.Y., Zon G., Wilson W.D. Sequence specific thermodynamic and structural properties for DNA.RNA duplexes. Biochemistry. 1994;33:5298–5304. doi: 10.1021/bi00183a037. [DOI] [PubMed] [Google Scholar]
- 22.Roberts R.W., Crothers D.M. Stability and properties of double and triple helices: dramatic effects of RNA or DNA backbone composition. Science. 1992;258:1463–1466. doi: 10.1126/science.1279808. [DOI] [PubMed] [Google Scholar]
- 23.Ross J.P., Suetake I., Tajima S., Molloy P.L. Recombinant mammalian DNA methyltransferase activity on model transcriptional gene silencing short RNA-DNA heteroduplex substrates. Biochem J. 2010;432:323–332. doi: 10.1042/BJ20100579. [DOI] [PubMed] [Google Scholar]
- 24.Suzuki M.M., Bird A. DNA methylation landscapes: provocative insights from epigenomics. Nat. Rev. Genet. 2008;9:465–476. doi: 10.1038/nrg2341. [DOI] [PubMed] [Google Scholar]
- 25.Bird A.P. DNA methylation and the frequency of CpG in animal DNA. Nucleic Acids Res. 1980;8:1499–1504. doi: 10.1093/nar/8.7.1499. [DOI] [PMC free article] [PubMed] [Google Scholar]
- 26.Bird A., Taggart M., Frommer M., Miller O.J., Macleod D. A fraction of the mouse genome that is derived from islands of nonmethylated, CpG-rich DNA. Cell. 1985;40:91–99. doi: 10.1016/0092-8674(85)90312-5. [DOI] [PubMed] [Google Scholar]
- 27.Cohen N.M., Kenigsberg E., Tanay A. Primate CpG islands are maintained by heterogeneous evolutionary regimes involving minimal selection. Cell. 2011;145:773–786. doi: 10.1016/j.cell.2011.04.024. [DOI] [PubMed] [Google Scholar]
- 28.Long H.K., Sims D., Heger A., Blackledge N.P., Kutter C., Wright M.L., Grutzner F., Odom D.T., Patient R., Ponting C.P., et al. Epigenetic conservation at gene regulatory elements revealed by non-methylated DNA profiling in seven vertebrates. Elife. 2013;2:e00348. doi: 10.7554/eLife.00348. [DOI] [PMC free article] [PubMed] [Google Scholar]
- 29.Parra G., Bradnam K., Korf I. CEGMA: a pipeline to accurately annotate core genes in eukaryotic genomes. Bioinformatics. 2007;23:1061–1067. doi: 10.1093/bioinformatics/btm071. [DOI] [PubMed] [Google Scholar]
- 30.Flicek P., Amode M.R., Barrell D., Beal K., Billis K., Brent S., Carvalho-Silva D., Clapham P., Coates G., Fitzgerald S., et al. Ensembl 2014. Nucleic Acids Res. 2014;42:D749–755. doi: 10.1093/nar/gkt1196. [DOI] [PMC free article] [PubMed] [Google Scholar]
- 31.Lott P.C., Korf I. StochHMM: a flexible hidden Markov model tool and C++ library. Bioinformatics. 2014;30:1625–1626. doi: 10.1093/bioinformatics/btu057. [DOI] [PMC free article] [PubMed] [Google Scholar]
- 32.Laurent L., Wong E., Li G., Huynh T., Tsirigos A., Ong C.T., Low H.M., Kin Sung K.W., Rigoutsos I., Loring J., et al. Dynamic changes in the human methylome during differentiation. Genome Res. 2010;20:320–331. doi: 10.1101/gr.101907.109. [DOI] [PMC free article] [PubMed] [Google Scholar]
- 33.Lister R., Pelizzola M., Dowen R.H., Hawkins R.D., Hon G., Tonti-Filippini J., Nery J.R., Lee L., Ye Z., Ngo Q.M., et al. Human DNA methylomes at base resolution show widespread epigenomic differences. Nature. 2009;462:315–322. doi: 10.1038/nature08514. [DOI] [PMC free article] [PubMed] [Google Scholar]
- 34.Lister R., Mukamel E.A., Nery J.R., Urich M., Puddifoot C.A., Johnson N.D., Lucero J., Huang Y., Dwork A.J., Schultz M.D., et al. Global epigenomic reconfiguration during mammalian brain development. Science. 2013;341:1237905. doi: 10.1126/science.1237905. [DOI] [PMC free article] [PubMed] [Google Scholar]
- 35.Bernstein B.E., Stamatoyannopoulos J.A., Costello J.F., Ren B., Milosavljevic A., Meissner A., Kellis M., Marra M.A., Beaudet A.L., Ecker J.R., et al. The NIH Roadmap Epigenomics Mapping Consortium. Nat. Biotechnol. 2010;28:1045–1048. doi: 10.1038/nbt1010-1045. [DOI] [PMC free article] [PubMed] [Google Scholar]
- 36.Hon G.C., Rajagopal N., Shen Y., McCleary D.F., Yue F., Dang M.D., Ren B. Epigenetic memory at embryonic enhancers identified in DNA methylation maps from adult mouse tissues. Nat. Genet. 2013;45:1198–1206. doi: 10.1038/ng.2746. [DOI] [PMC free article] [PubMed] [Google Scholar]
- 37.Zemach A., McDaniel I.E., Silva P., Zilberman D. Genome-wide evolutionary analysis of eukaryotic DNA methylation. Science. 2010;328:916–919. doi: 10.1126/science.1186366. [DOI] [PubMed] [Google Scholar]
- 38.Zhang Y.E., Vibranovski M.D., Landback P., Marais G.A., Long M. Chromosomal redistribution of male-biased genes in mammalian evolution with two bursts of gene gain on the X chromosome. PLoS Biol. 2010;8 doi: 10.1371/journal.pbio.1000494. doi:10.1371/journal.pbio.1000494. [DOI] [PMC free article] [PubMed] [Google Scholar]
- 39.Gardiner-Garden M., Frommer M. CpG islands in vertebrate genomes. J. Mol. Biol. 1987;196:261–282. doi: 10.1016/0022-2836(87)90689-9. [DOI] [PubMed] [Google Scholar]
- 40.Zhu J., He F., Hu S., Yu J. On the nature of human housekeeping genes. Trends Genet. 2008;24:481–484. doi: 10.1016/j.tig.2008.08.004. [DOI] [PubMed] [Google Scholar]
- 41.Almada A.E., Wu X., Kriz A.J., Burge C.B., Sharp P.A. Promoter directionality is controlled by U1 snRNP and polyadenylation signals. Nature. 2013;499:360–363. doi: 10.1038/nature12349. [DOI] [PMC free article] [PubMed] [Google Scholar]
- 42.Edwards J.R., O'Donnell A.H., Rollins R.A., Peckham H.E., Lee C., Milekic M.H., Chanrion B., Fu Y., Su T., Hibshoosh H., et al. Chromatin and sequence features that define the fine and gross structure of genomic methylation patterns. Genome Res. 2010;20:972–980. doi: 10.1101/gr.101535.109. [DOI] [PMC free article] [PubMed] [Google Scholar]
- 43.Carninci P., Sandelin A., Lenhard B., Katayama S., Shimokawa K., Ponjavic J., Semple C.A., Taylor M.S., Engstrom P.G., Frith M.C., et al. Genome-wide analysis of mammalian promoter architecture and evolution. Nat. Genet. 2006;38:626–635. doi: 10.1038/ng1789. [DOI] [PubMed] [Google Scholar]
- 44.Aerts S., Thijs G., Dabrowski M., Moreau Y., De Moor B. Comprehensive analysis of the base composition around the transcription start site in Metazoa. BMC Genomics. 2004;5:34. doi: 10.1186/1471-2164-5-34. [DOI] [PMC free article] [PubMed] [Google Scholar]
- 45.Touchon M., Arneodo A., d'Aubenton-Carafa Y., Thermes C. Transcription-coupled and splicing-coupled strand asymmetries in eukaryotic genomes. Nucleic Acids Res. 2004;32:4969–4978. doi: 10.1093/nar/gkh823. [DOI] [PMC free article] [PubMed] [Google Scholar]
- 46.Saadeh H., Schulz R. Protection of CpG islands against de novo DNA methylation during oogenesis is associated with the recognition site of E2f1 and E2f2. Epigenet. Chromatin. 2014;7:26. doi: 10.1186/1756-8935-7-26. [DOI] [PMC free article] [PubMed] [Google Scholar]
- 47.Nagaoka M., Shiraishi Y., Sugiura Y. Selected base sequence outside the target binding site of zinc finger protein Sp1. Nucleic Acids Res. 2001;29:4920–4929. doi: 10.1093/nar/29.24.4920. [DOI] [PMC free article] [PubMed] [Google Scholar]
- 48.Roy D., Lieber M.R. G clustering is important for the initiation of transcription-induced R-loops in vitro, whereas high G density without clustering is sufficient thereafter. Mol. Cell. Biol. 2009;29:3124–3133. doi: 10.1128/MCB.00139-09. [DOI] [PMC free article] [PubMed] [Google Scholar]
- 49.Roy D., Zhang Z., Lu Z., Hsieh C.L., Lieber M.R. Competition between the RNA transcript and the nontemplate DNA strand during R-loop formation in vitro: a nick can serve as a strong R-loop initiation site. Mol. Cell. Biol. 2010;30:146–159. doi: 10.1128/MCB.00897-09. [DOI] [PMC free article] [PubMed] [Google Scholar]
- 50.Aguilera A., Garcia-Muse T. R loops: from transcription byproducts to threats to genome stability. Mol. Cell. 2012;46:115–124. doi: 10.1016/j.molcel.2012.04.009. [DOI] [PubMed] [Google Scholar]
- 51.Belotserkovskii B.P., Liu R., Tornaletti S., Krasilnikova M.M., Mirkin S.M., Hanawalt P.C. Mechanisms and implications of transcription blockage by guanine-rich DNA sequences. Proc. Natl. Acad. Sci. U.S.A. 2010;107:12816–12821. doi: 10.1073/pnas.1007580107. [DOI] [PMC free article] [PubMed] [Google Scholar]
- 52.Polak P., Arndt P.F. Transcription induces strand-specific mutations at the 5′ end of human genes. Genome Res. 2008;18:1216–1223. doi: 10.1101/gr.076570.108. [DOI] [PMC free article] [PubMed] [Google Scholar]
- 53.Beletskii A., Bhagwat A.S. Transcription-induced mutations: increase in C to T mutations in the nontranscribed strand during transcription in Escherichia coli. Proc. Natl. Acad. Sci. U.S.A. 1996;93:13919–13924. doi: 10.1073/pnas.93.24.13919. [DOI] [PMC free article] [PubMed] [Google Scholar]
- 54.Kouzine F., Wojtowicz D., Yamane A., Resch W., Kieffer-Kwon K.R., Bandle R., Nelson S., Nakahashi H., Awasthi P., Feigenbaum L., et al. Global regulation of promoter melting in naive lymphocytes. Cell. 2013;153:988–999. doi: 10.1016/j.cell.2013.04.033. [DOI] [PMC free article] [PubMed] [Google Scholar]
- 55.Huang F.T., Yu K., Hsieh C.L., Lieber M.R. Downstream boundary of chromosomal R-loops at murine switch regions: implications for the mechanism of class switch recombination. Proc. Natl. Acad. Sci. U.S.A. 2006;103:5030–5035. doi: 10.1073/pnas.0506548103. [DOI] [PMC free article] [PubMed] [Google Scholar]
- 56.Yu K., Chedin F., Hsieh C.L., Wilson T.E., Lieber M.R. R-loops at immunoglobulin class switch regions in the chromosomes of stimulated B cells. Nat. Immunol. 2003;4:442–451. doi: 10.1038/ni919. [DOI] [PubMed] [Google Scholar]
- 57.Wu X., Sharp P.A. Divergent transcription: a driving force for new gene origination. Cell. 2013;155:990–996. doi: 10.1016/j.cell.2013.10.048. [DOI] [PMC free article] [PubMed] [Google Scholar]
- 58.Core L.J., Waterfall J.J., Lis J.T. Nascent RNA sequencing reveals widespread pausing and divergent initiation at human promoters. Science. 2008;322:1845–1848. doi: 10.1126/science.1162228. [DOI] [PMC free article] [PubMed] [Google Scholar]
- 59.Preker P., Nielsen J., Kammler S., Lykke-Andersen S., Christensen M.S., Mapendano C.K., Schierup M.H., Jensen T.H. RNA exosome depletion reveals transcription upstream of active human promoters. Science. 2008;322:1851–1854. doi: 10.1126/science.1164096. [DOI] [PubMed] [Google Scholar]
- 60.Seila A.C., Calabrese J.M., Levine S.S., Yeo G.W., Rahl P.B., Flynn R.A., Young R.A., Sharp P.A. Divergent transcription from active promoters. Science. 2008;322:1849–1851. doi: 10.1126/science.1162253. [DOI] [PMC free article] [PubMed] [Google Scholar]
- 61.Li X., Wang J., Manley J.L. Loss of splicing factor ASF/SF2 induces G2 cell cycle arrest and apoptosis, but inhibits internucleosomal DNA fragmentation. Genes Dev. 2005;19:2705–2714. doi: 10.1101/gad.1359305. [DOI] [PMC free article] [PubMed] [Google Scholar]
- 62.Paulsen R.D., Soni D.V., Wollman R., Hahn A.T., Yee M.C., Guan A., Hesley J.A., Miller S.C., Cromwell E.F., Solow-Cordero D.E., et al. A genome-wide siRNA screen reveals diverse cellular processes and pathways that mediate genome stability. Mol. Cell. 2009;35:228–239. doi: 10.1016/j.molcel.2009.06.021. [DOI] [PMC free article] [PubMed] [Google Scholar]
- 63.Skourti-Stathaki K., Proudfoot N.J., Gromak N. Human senataxin resolves RNA/DNA hybrids formed at transcriptional pause sites to promote Xrn2-dependent termination. Mol. Cell. 2011;42:794–805. doi: 10.1016/j.molcel.2011.04.026. [DOI] [PMC free article] [PubMed] [Google Scholar]
Associated Data
This section collects any data citations, data availability statements, or supplementary materials included in this article.