


Abstract
In cancer research, background models for mutation rates have been extensively calibrated in coding regions, leading to the identification of many driver genes, recurrently mutated more than expected. Noncoding regions are also associated with disease; however, background models for them have not been investigated in as much detail. This is partially due to limited noncoding functional annotation. Also, great mutation heterogeneity and potential correlations between neighboring sites give rise to substantial overdispersion in mutation count, resulting in problematic background rate estimation. Here, we address these issues with a new computational framework called LARVA. It integrates variants with a comprehensive set of noncoding functional elements, modeling the mutation counts of the elements with a β-binomial distribution to handle overdispersion. LARVA, moreover, uses regional genomic features such as replication timing to better estimate local mutation rates and mutational hotspots. We demonstrate LARVA's effectiveness on 760 whole-genome tumor sequences, showing that it identifies well-known noncoding drivers, such as mutations in the TERT promoter. Furthermore, LARVA highlights several novel highly mutated regulatory sites that could potentially be noncoding drivers. We make LARVA available as a software tool and release our highly mutated annotations as an online resource (larva.gersteinlab.org).
INTRODUCTION
Genomes of numerous patients have been sequenced (1–5), opening up opportunities to identify the underlying genetic causes for complex disease (6–9) and develop more effective therapies targeted at specific molecular disease subtypes (10). Most of these studies have so far focused on identifying mutations and defects in the protein coding regions, or exomes, of disease genomes (2,11–14). These methods usually search for coding regions with higher than expected mutation frequencies in protein coding genes through rigorous background mutation rate control over a variety of genomic features (11). Such methods have been successfully used on numerous cancer genomes (15). However, the noncoding regions, which comprise more than 98% of the human genome, were rarely investigated, primarily due to the difficulty of functional interpretation of noncoding variants.
Recent genome annotation analysis has revealed that a significant portion of the human genome is functional in a certain tissue or development stage (16,17), and several noncoding variants have been implicated in disease (18). For example, several genome-wide association studies (GWASs) studies have discovered the phenotypic effect of common noncoding variants in regulatory regions (19,20). Other studies have reported that noncoding TERT mutations drive cancer progression in multiple tumor types, including melanomas and gliomas (21–23). Moreover, mutations in the promoter regions of PLEKHS1, WDR74 and SDHD were also identified as recurrent driver mutations in some cancer types (24). In another example, analysis of the miRNA-binding sites on BRCA1 and BRCA2, the established risk genes of breast cancer, indicated that certain variants in these sites are associated with increased likelihood of early onset breast cancer (25). Furthermore, some references showed that a histone H1 variant is linked to oncogene expression in ovarian cancer (26). In light of these discoveries and the growing availability of whole-genome sequencing data (2,27–32), a statistical framework facilitating the identification of highly mutated noncoding mutations is called for.
More recently, a genome wide computational effort has been made to discover the noncoding regions with higher mutation burden in cancer genomes (24). Weinhold et al. called whole genome somatic variants for human tumor sequences from The Cancer Genome Atlas (TCGA) (28) and analyzed the variants that fall into noncoding annotations. A P-value was computed for each annotation reflecting the likelihood that the given annotation had more variants than expected from background mutation processes, which was modeled with a binomial distribution. They successfully identified some known noncoding drivers, such as the TERT promoter, and reported some novel candidates that were not discovered previously. The use of the binomial distribution is based on two assumptions: (i) the mutation rate is homogeneous; (ii) variants arise independently. However, cancer genomes often violate these assumptions. First, studies on the coding variants already proved that the mutation rates in cancer genomes demonstrate substantial cancer type, sample and regional heterogeneity (11). Second, some passenger mutations are generated by other driver events, such as structural alterations and mutations in DNA replication or repair genes (33). In the human genome, there are many regions with highly correlated mutational profiles. For instance, the germline variant distribution is influenced by the high linkage disequilibrium (LD) of many regions, and for somatic variants, there are many known hotspots. Hence, some degree of dependency is to be expected in the human germline and somatic mutations. Consistent with these statements, we observed that the somatic mutation counts in the noncoding elements exhibited substantially higher variance than expected, the so-called overdispersion, indicating that a binomial distribution might be potentially inadequate to handle such data, and the resultant P-values might be heavily inflated. Hence, if this P-value inflation is not taken care of, a significance calculation based on a binomial distribution might report some artificial mutation hotspots by chance instead of real driver events.
Here, we present a computational system, LARVA (Large-scale Analysis of Recurrent Variants in noncoding Annotations), that identifies highly mutated noncoding regulatory elements using whole genome sequencing (WGS) variant data from multiple genetic disease patients. LARVA treats the mutations counts within a given regulatory element as a β-binomial distributed random variable. This design accommodates the heterogeneous nature of mutation accumulation in cancer genomes and the potential dependency among neighboring loci by allowing the local mutation rate to be drawn from a β distribution. Furthermore, we also divided the whole genome into several local bins and classified them using some known genomic confounders of the mutation rate, such as replication timing, for a more accurate local background mutation model. Such integrative analysis could potentially control the false positive rate in an effective manner. We demonstrate the usefulness of LARVA for finding both well-known and novel noncoding regulators with higher mutation burdens in a set of WGS cancer data that represents all the different types of whole genome sequenced cancers to our knowledge (see ‘Materials and Methods’ section for details). We release the noncoding annotations and the results in this paper as a potentially useful resource to researchers. Although designed for somatic variant analysis, the logic of LARVA can be immediately extended for germline variant analysis in complex diseases. The following sections describe LARVA's concepts, their applications to the study of genetic disease and our cancer findings.
MATERIALS AND METHODS
Whole genome cancer variant data
We collected whole genome cancer variant calls from a large number of previously sequenced cancer genomes. The majority of our data came from a set of 507 whole genome cancer samples published in Alexandrov et al. (27). This data spans breast cancer, lung cancer, leukemia, pancreatic cancer, pilocytic astrocytoma, medulloblastoma, liver cancer and lymphoma (Figure 1A and Supplementary Table S1). This was supplemented with a collection of 95 prostate cancer samples we obtained from publications (2,28–30), a set of 26 unpublished glial tumor samples, 32 kidney cancer samples from the TCGA (28) and a set of 100 stomach cancer samples from Wang et al. (31).
Figure 1.

(A) A pie chart representing the distribution of samples in our dataset of collected whole genome sequenced (WGS) cancers. (B) A flowchart of LARVA's procedure for identifying significant highly mutated noncoding elements. Cancer variants in VCF format are passed through quality control filters and then intersected with our noncoding annotation corpus. After factoring in regional mutation rate corrections, a β-binomial distribution is fitted to the observed data, which allows the identification of elements with a significant mutational burden.
Quality control of the WGS variants
A number of genomic regions are known to have poor read mappability due to sequence phenomena that cause ambiguous mapping results, such as a large number of tandem repeats. These regions are known as signal artifact blacklist regions (34). Since it is likely that variant calls in these regions are possibly inaccurate, we opted not to use these regions or any intersecting variants in our mutation rate calculations (details in Supplementary Figure S1). Blacklist regions were derived from (34), and downloaded from the UCSC Genome Browser. Variants intersecting these regions, as determined by BEDTools (35), were removed from the analysis.
Noncoding annotation summary
Our analysis covered a range of noncoding regulatory annotations. The GENCODE v16 main annotation file was parsed to derive the coordinates of regulatory annotations close to gene regions, including promoters and untranslated regions (UTRs)(36). Transcription factor (TF) binding sites were derived from the Chip-seq experiments conducted as part of the ENCODE project (37). We collected the full list of TF binding sites in all possible tissues and cell lines from ENCODE. Distal regulatory modules (DRM) enhancers, which regulate the expression of genes at nonadjacent sites, were derived from (38). Another class of regulators, the Dnase I hypersensitive (DHS) sites (39), were also derived from the ENCODE project. Additionally, we added a set of sites deemed ‘ultra-conserved’ in (40) due to their extremely high level of conservation across many species. Furthermore, we used a set of ‘ultra-sensitive’ sites from (41), so named because they are noncoding regions under higher selective pressure from the population genetics perspective. Finally, similar to the 2500 bp promoter sites, we studied the more proximal transcription start sites (TSSs) by extracting the 100 bp regions immediately upstream of GENCODE gene coding annotations (36). Table 1 summarizes the noncoding annotations.
Table 1. List of noncoding annotations collected for LARVA's analysis.
| Feature | Nucleotide | Number | Length mean | Length SD | Fraction |
|---|---|---|---|---|---|
| Promoter | 89 325 819 | 72 965 | 2500 | 0 | 0.028 |
| TF peak | 376 580 899 | 5 710 734 | 632.341 | 434.949 | 0.120 |
| DHS site | 434 080 020 | 2 890 742 | 150.162 | 4.520 | 0.138 |
| DRM enhancer | 8 273 100 | 9599 | 861.871 | 987.892 | 2.637 × 10⁻³ |
| Ultra-conserved | 126 007 | 481 | 261.969 | 70.477 | 4.020 × 10⁻⁵ |
| Ultra-sensitive | 610048 | 1354 | 683.149 | 769.190 | 1.945 × 10⁻⁴ |
| UTR | 41 398 790 | 155 052 | 392.539 | 781.461 | 1.320 × 10⁻² |
| TSS | 13 615 140 | 196 520 | 100 | 0 | 4.343 × 10⁻³ |
Pseudogenes are known hot spots for artifacts due to their high context resemblance to their parent genes. In order to avoid potential variant calling bias, partially due to mapping difficulty, we removed the promoters, TSS and UTR analyses for pseudogenes in the GENCODE annotation (details in Supplementary Figure S2 Text S1 section 1).
Models used for significance evaluation of mutation burden
The mutation counts for each regulatory element were calculated from the 760 cancer genomes mentioned above. For each regulatory element category, three models were used to calculate the mutation rate that would be expected due to background stochastic mutation processes for significance evaluation.
Suppose there are k noncoding regulatory elements (e.g. TF binding sites) to be analyzed. For the ith element, let ni stand for the total number of nucleotides in i. xi and p represent the number of mutations within element i and the probability of observing a mutation in each position. Some previous models (24,42) assumed that p is constant over the entire genome and mutations occur in an independent way. Hence, in model 1, xi can be described as a binomial distribution.
 |
(1) |
However, due to the heterogeneous nature of the cancer genomes and the possible dependencies among neighboring loci, large overdispersion was found in the mutation count data (as seen in Figure 4 in the ‘Results’ section). As a result, we first improved model 1 into a two-layer hierarchical model (model 2). Instead of setting p as a constant, we allow it to be drawn from a β distribution with two parameters μ and σ indicating the average mutation rate and overdispersion respectively (details in Text S1). As a result, the marginal distribution of xi follows a β-binomial distribution.
 |
(2) |
Figure 4.

(A) The β-binomial distribution (pink line) provides better fitting to the observed mutation counts at 10 kb resolution (black line) of 760 cancer genomes, especially at the right tail as compared to the binomial distribution (turquoise line). (B) A comparison of the cumulative distribution function (CDF) of the binomial distribution and the β-binomial distribution from part (A). (C) Boxplots of the Kolmogorov–Smirnov (KS) statistics.
Furthermore, mutation rates are known to be confounded by a lot of genomic features, such as replication timing (represented by  ), so we further divided the noncoding regulatory elements into 10 bins according to the averaged replication timing signal. Within each bin, we assumed that the mutation rate follows the same distribution. Therefore, model 3 can be represented as:
 |
(3) |
Method of maximum likelihoods was used for model 1. The moment estimator mentioned in (43,44) was used to estimate the parameters in model 2 and 3, and the P-values were calculated accordingly for the three models (for details see section 2 in Text S1).
Workflow of LARVA
The workflow of LARVA is given in Figure 1B. The cancer variants in VCF format pass through a quality control filter that includes removing those variants that fall into blacklist regions. The preprocessed variants, along with our collected set of noncoding annotations that do not overlap blacklist regions, are used in the main computation. The main processing step includes counting all variant intersections with the noncoding annotations. DNA replication timing was used in model 3 for local mutation rate corrections. For each annotation category, the background mutation model was calculated using models 1–3 mentioned above and P-values were given accordingly.
Release of results
We release the noncoding annotations, the mutation counts and the corresponding P-values on the 760 cancer genomes used in this paper as a potentially useful resource to facilitate cancer researchers for driver event discovery and validation in the future. The files can be directly downloaded from larva.gersteinlab.org. The files available for download include:
C++ source code with documentation and a regression test suite;
A LARVA Docker image, which encapsulates all of LARVA's prerequisite software and greatly simplifies installation;
Our noncoding annotation collection; and
Our P-values from running LARVA with our cancer variant collection on our noncoding annotation collection
RESULTS
Overview of the annotated noncoding variants on various cancer genomes
We sought to study the whole genome somatic mutation patterns of as many different cancer patients as possible. To that end, we collected whole genome cancer variant call sets from a range of cancer data repositories (27,28) and publications (2,27,29–32). Our data spans 760 genomes and includes 14 types of cancer (Figure 1A and Supplementary Table S1). In all these samples, the percentage of coding variants were summarized in Supplementary Table S2.
As shown in Table 1, our noncoding annotation list spans ∼30% of the human genome. We observed different cancer types demonstrate distinct mutational preferences over these noncoding regions. To illustrate this phenomenon, we used 11 types of cancer from our overall dataset, for which there are at least 20 samples and calculated the fraction of WGS mutations within each noncoding element category (boxplots of various colors in Figure 2). The overall nucleotide percentage of each annotation over the genome was used as the background (black dashed lines in Figure 2). In one instance representative of the large differences observed between cancer types, variants in kidney cancer genomes were found to be preferentially located in the TF binding site while lung adenocarcinoma is mutation depleted in this region (0.140 average versus 0.098 average, in Figure 2). A large sample difference was also observed in several cancer types. For instance, within Pilocytic Astrocytoma, there are samples that have a TF binding peak mutation fraction as high as 0.252 and as low as 0.011, which represents a ∼23-fold difference. Hence, it is important to understand the mutation patterns in these noncoding annotations and take their unique characteristics into consideration.
Figure 2.

Mutational heterogeneity between different types of cancer within several prominent classes of noncoding annotations. The percentage of mutations varies widely between noncoding element types, cancer types and samples of the same cancer type.
Large cancer type, sample, regional heterogeneity of cancer genomes and the potential dependency among neighboring regions violate the binomial assumption
In (24), the mutation burden tests are performed based on the binomial distribution, which inherently assumes a constant mutation rate and completely independent mutation events. However, these assumptions might not be appropriate for either somatic or germline variant analysis.
First, in our analysis of hundreds of WGS somatic mutation signatures, we observed huge cancer type, sample and regional somatic mutation rate heterogeneity. To demonstrate cancer type and sample mutation rate heterogeneity, we selected all cancer types with more than 20 samples in it. We split the human genome into 1 mega basepair (Mbp) size bins and intersected the individual sample variants from our dataset to calculate the mutation rate of each sample. Consistent with the analysis in coding regions (11), we observed huge mutation rate differences between cancer types. For instance, the average whole genome mutation rate in stomach cancer is as high as 11.389 mutations/Mbp (Figure 3A), which is ∼800 times the mutation rate in medulloblastoma (0.0142, Figure 3A). Furthermore, the whole genome mutation rate also fluctuates wildly across samples and such changes may go as high as 100 times within the same cancer type (0.359 versus 21.8 in breast cancer, for example). Additionally, to illustrate regional mutation rate heterogeneity, we randomly selected 50 one-megabase-length regions to calculate the mean and standard deviation (SD) of the local mutation rate across samples in lung cancer and prostate cancer (Figure 3B). As shown in Figure 3B, the average local mutation rate may vary from 0 to 50.8 mutations/Mbp across the randomly selected bins and the SD range is unusually huge for each bin. Similar results were also observed in prostate cancer (Figure 3B).
Figure 3.

(A) Between samples of the same cancer type, there is huge mutation rate heterogeneity. For most cancers, the mutation rate spans several orders of magnitude. (B) Variation in the mutation rate in fifty 1 Mbp regions across chromosome 1 in lung cancer (top) and prostate cancer (bottom).
Several biological signatures could partially explain the observed mutation rate heterogeneity. For example, the later replicating regions usually suffer from accumulative DNA damage and therefore are prone to mutations (45). Furthermore, methylated cytosines in CpG sites are often unstable and undergo deamination to thymine, which yields a C to T transition (33). Hence, there is a noticeable mutation rate difference at CpG and non-CpG sites. Several other hypotheses were also proposed and summarized in Hodgkinson and Eyre-Walker's review paper (33).
Second, mutation events might not be independent of each other. For example, in germline mutation analysis, mutations with high LD are prone to co-occur. Additionally, some passenger mutations are generated by other driver mutations. The driver mutation might be a mutation in a DNA replication or repair gene. Moreover, some structural variations, such as long insertions or deletions, might cause problems in pairing during meiosis and thus generate additional point mutations in neighboring regions (46). Consistent with this hypothesis, the mutation rates of the surrounding structural variations are elevated in several eukaryotic species (46–48).
Perhaps due to the violation of these two assumptions, we observed a much higher than expected variance in the mutation count data. For example, at a 10 kb bin resolution, the observed mutation count variance is 7.679 times the expected value under the binomial assumption. Hence, it is necessary to introduce other statistical models to handle such overdispersion in the mutation count data.
Improved mutation count fitting through a β-binomial distribution
As discussed in the previous section, a binomial distribution model used in (24), which assumes a constant mutation rate and independent mutation process, could be problematic in more practical data analysis applications when the mutation counts are highly overdispersed. Hence, we first proposed a two-layer model to fit the variant count data (model 2 in the ‘Materials and Methods’ section). Instead of setting a constant mutation rate, our model treats the mutation rate as a β-distributed random variable, which flexibly provides the underlying mutation rate with desired mean and variance properties. Then the mutation counts within each regulatory element could be easily modeled as a β-binomial distribution (details in ‘Materials and Methods’ section).
We fitted the mutation count data at a 10 kb bin resolution of the 760 WGS cancer genomes under the fixed (binomial) and variable (β-binomial) mutation rate assumptions in Figure 4. We calculated the frequency of the observed mutation count in each bin and compared it with the binomial (model 1) and β-binomial (model 2) fittings respectively. Figure 4A shows that the observed data demonstrates much heavier tails than the binomial distribution, while the β-binomial distribution fits the right tail very well. In order to quantitatively exhibit the improved performance of β-binomial fitting, we utilized Kolmogorov–Smirnov (KS) statistics to compare the two distributions with the observed data in a nonparametric way. A larger KS statistic indicates a higher level of deviation between the two distributions. Specifically, 1000 bins were drawn from β-binomial and binomial fitted distributions separately to calculate the KS statistic against the randomly sampled 1000 mutation counts from the observed data. This scheme was repeated 1000 times and the cumulative distribution function (C.D.F) of the KS statistics were given in Figure 4B. The median KS statistic value for the β-binomial distribution was 0.087, significantly <0.218 of the binomial distribution (P-value for two-sided Wilcoxon test <2.2 × 10⁻¹⁶, boxplots given in Figure 4C). Different bin sizes were analyzed using the sample method and results were similar (Supplementary Figures S3 and S4). In order to avoid overfitting, we utilized half of the data for distribution fitting and the remaining half as the input to calculate the KS statistic for evaluation. This scheme was repeated 100 times. The β-binomial distribution still significantly outperforms the binomial distribution (0.0821 versus 0.216, P-value for two sided Wilcoxon test <2.2 × 10⁻¹⁶, Supplementary Figure S5). Hence, the improved performance of the β-binomial distribution is due to its enhanced flexibility to handle the overdispersed mutation count data instead of overfitting.
In the significance analysis, P-values were usually calculated from the right tail of the null distribution. However, the huge deviation of the binomial distribution from the observed one could potentially introduce huge P-value inflation and consequently result in numerous false positives. We defined the P-values for the observed distribution as the percentage of bins with equal or larger mutation counts. However, the improved fitting of the β-binomial distribution could solve this problem and provide more accurate P-value assessment.
Local background mutation rate calculation through replication timing correction further controls false positives and false negatives
Recently, several computational efforts have been made to link somatic mutation rates with several genomic features in protein-coding regions (11,33). A particularly well-known example is DNA replication timing. During replication, single stranded DNA usually accrues endogenous DNA damage, such as oxidation and deamination (45). Hence, DNA that is replicated in a later stage would be susceptible to the effects of accumulative damage and would be prone to all classes of substitutions. Consistent with this assumption, scientists observed that the later replicating regions demonstrate remarkably higher mutation rates (45). Although replication timing has been used successfully to calculate the background model in the coding regions, little work has been done in the noncoding regions in cancer genomics. Hence, we explored the effect of replication timing on the mutation rate calculation (model 3 in the ‘Materials and Methods’ section), and the consequential effect on the P-value evaluation.
Using 1 kb bins, we counted the average replication timing value within the bin, and then separated the top and bottom 10% of replication timing bins for mutation rate calculation. As shown in Figure 5A, we observed noticeable differences in the mutation rate vis-a-vis the replication timing signal. The average mutation count of the 760 samples was 1.200 for the bottom 10% replicating timing bins, as compared to 4.028 for the top 10% (P-value for two-sided Wilcoxon test <2.2 × 10⁻¹⁶). A KS test was performed to determine whether these two sets of mutation counts data follow the same distribution and the P-value is <2.2 × 10⁻¹⁶, indicating that the two distributions are significantly different.
Figure 5.
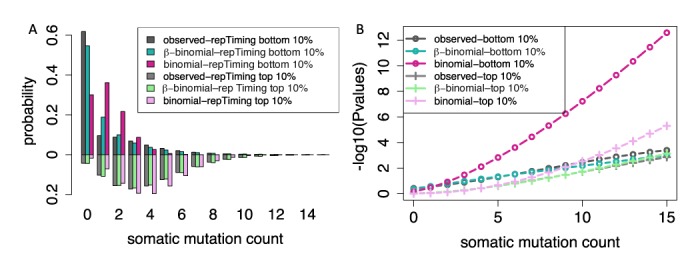
The 1 kb genome bins representing the top 10% and bottom 10% of the DNA replication timing were used to derive an observed distribution of mutation counts, demonstrating the influence of replication timing. The fitted binomial and β-binomial distributions are plotted as bar plots (A). P-values at different mutation counts were given by the observed, β-binomial and binomial distribution.
Moreover, we observed that the mutation counts data for bins with similar replication timing values still shows extensive overdispersion. For example, for the bottom 10% of replication timing bins, the observed variance of mutation counts was 4.168, which is 3.477 times that under the binomial assumption. Consistently, we observed poor fitting of the binomial distribution against the observed distribution, especially in the right tails (Figure 5A). The huge deviation in the right tails would result in huge P-value calculation inflation as shown in Figure 5B. The P-value for 16 mutations in the bottom replication timing 1 kb region from the empirical distribution shows only marginal significance (3.994 × 10⁻⁴), but the binomial distribution could inflate it to 2.585 × 10⁻¹³ due to its bad fitting of the heavy tails on the right side. But our β-binomial distribution rigorously controls the P-values through the flexible mutation rate assumption (P-value = 1.002 × 10⁻³). We demonstrate the better P-value curve of the β-binomial distribution in a variety of data points and replication timings, indicating the robustness of our method (Figure 5B).
Additionally, the replication timing effect correction further improves the P-value calculation to avoid potential false positives and false negatives. For instance, for a region among the top replication timing regions, eight mutations in 1 kb bin would give a P-value of 0.094 after replication correction from the β-binomial model, but might be reported as positive when ignoring replication timing effect (P-value = 0.038 from β-binomial by mixing the top and bottom 10% replication timing points). Similarly, a P-value of 0.064 would reject seven mutations within 1 kb bin as significant without correction. However, if this point comes from the bottom 10% of replication timing regions, the true P-value should be 0.030 due to its relatively lower local mutation rate. Hence, it is important to perform covariate correction before calculating P-values.
LARVA discovered a list of highly recurrent noncoding regulatory regions from WGS data
We first applied LARVA to the 760 genomes’ variants, intersecting them with the noncoding regions listed in Table 1. In total, LARVA reported 3964 and 3776 highly mutated regions before and after replication timing corrections, respectively (as shown in Table 2). On the other hand, the binomial distribution models reported at least 30 times more regions as significant because of the aforementioned P-value inflation, giving rise to a high false positive rate. We also tested the immediate 100 bp upstream of every possible TSS (see ‘Materials and Methods’ section for details), the results of which are depicted in Figure 6B. Forty-five TSSs passed the 0.05 P-value thresholds after P-value adjustment (BH method, (49)). Consistent with previous studies, we observed that the TSS for TERT came up in the top regions (Figure 6B) and the oncogene TP53 also ranked second among all sites. LMO3, which ranked third after replication timing correction, is a protein-coding oncogene that is predominantly expressed in brain tissue. It has been reported to be involved in a variety of cancer types, such as lung cancer (50) and neuroblastomas (51). PRRC2B's TSS was reported as the most significantly recurrent region among all TSSes. It is a protein-coding gene that is extensively expressed in brain tissue, but to the best of our knowledge, there is no study to show the link of PRRC2B to cancer. Further investigations should be performed for the purpose of validation. Similar results were given for promoters and UTR regions as well. We selected all the genes with highly mutated TSSes, promoters or UTRs (adjusted P-values after corrections ≤0.05) and performed GO analysis (http://amigo.geneontology.org, (52)). The top three enriched GO terms are: ‘negative regulation of fibroblast proliferation’, ‘regulation of extrinsic apoptotic signaling pathway in absence of ligand’ and ‘regulation of cell growth’.
Table 2. Number of significant recurrently mutated elements in each noncoding annotation class derived by LARVA.
| Feature | Larva w/.o | Larva w/. | Binomial w/.o | Binomial w/. |
|---|---|---|---|---|
| Conserved | 0 | 0 | 1 | 2 |
| Sensitive | 1 | 0 | 45 | 58 |
| DRM | 130 | 134 | 1429 | 1424 |
| UTR | 51 | 51 | 2093 | 2078 |
| Promoters | 87 | 59 | 3646 | 893 |
| TSS | 1588 | 1478 | 38 721 | 38 716 |
| DHS-sites | 2107 | 2054 | 91 484 | 91 732 |
| TFBS | 3964 | 3776 | 137 419 | 134 903 |
Figure 6.

(A) The number of significant P-values implied by the β-binomial distribution and the binomial distribution (with and without DNA replication timing correction). (B) A sorted P-value plot of the top significant TSSs derived from the LARVA analysis.
In terms of TF binding sites, LARVA identified 2054 out of the 5 710 954 binding sites as highly recurrent (0.036%). The TF CTCF had 852 binding sites reported as significant (Table 3). CTCF is a multifunction protein that is linked with multiple cancer types (53). Specifically, several studies have reported that disruption of CTCF binding sites through mutations or abnormal methylation sites is closely associated with cancer (54,55). Moreover, we found that the oncogene BCL3 has a noticeably higher significant percentage with respect to the average (7.721 times of the average, P-value for two-sided binomial test = 6.762 × 10⁻¹³). Interestingly, BCL3 is a proto-oncogene candidate which is closely associated with progression of diverse solid tumors (56). For example, BCL3 is aberrantly up- and downregulated in breast cancer and nasopharyngeal carcinomas respectively, and is also reported to be strongly associated with survival in colorectal cancer. However, it is not a highly mutated gene according to our data: BCL3's mutation rate is 1.22 mutations/Mbp while the gene average is 2.52 mutations/Mbp. Our analysis suggests another possibility: the misregulation of BCL3 may be due to binding site disruption instead of the changes in the protein itself. Further computational and experimental effort should be made to clarify the mechanism of BCL3 regulation in different cancer types.
Table 3. The top transcription factor binding sites (TFBSs) from LARVA's analysis of our 760 cancer genomes dataset.
| TF | Significant sites | Total sites | Percent |
|---|---|---|---|
| CTCF | 852 | 2 659 185 | 3.204 × 10⁻⁴ |
| RAD21 | 135 | 352 084 | 3.834 × 10⁻⁴ |
| MAFK | 93 | 112 704 | 8.252 × 10⁻⁴ |
| CEBPB | 77 | 111 585 | 6.901 × 10⁻⁴ |
| SPI1 | 55 | 81 054 | 6.786 × 10⁻⁴ |
| STAT3 | 45 | 140 552 | 3.203 × 10⁻⁴ |
| NR2C2 | 44 | 4557 | 9.656 × 10⁻⁴ |
| NFKB1 | 40 | 85 483 | 4.680 × 10⁻⁴ |
| MYC | 37 | 129 293 | 2.862 × 10⁻⁴ |
| SMC3 | 32 | 73 798 | 4.336 × 10⁻⁴ |
| MAX | 31 | 84 391 | 3.673 × 10⁻⁴ |
| JUND | 29 | 75 702 | 3.831 × 10⁻⁴ |
| BCL3 | 22 | 7926 | 2.776 × 10⁻³ |
| EP300 | 22 | 87 301 | 2.520 × 10⁻⁴ |
| FOXA1 | 22 | 88 985 | 2.472 × 10⁻⁴ |
| TFP.WRNIP1 | 1 | 2016 | 4.960 × 10⁻⁴ |
These findings may point to important regulatory disruptions in cancer.
Whole genome recurrent events evaluation
Despite great efforts to annotate noncoding regions, there are still many regions with as yet unknown regulatory roles. In order to evaluate the recurrent events in these regions, LARVA provides all possible P-values, whether before or after adjustment, and with or without replication timing corrections, for high confidence bins on the genome (see ‘Materials and Methods’ section for details) of variable length. We also compared the results from our β-binomial model with the binomial model. For example, we randomly sampled five thousand 10 kb bins from the whole genome and made a Manhattan plot of P-values from both methods. It is obvious that the P-values from the binomial distribution were noticeably inflated (Figure 7B), while our β-binomial model effectively controls the P-values (Figure 7A). Consistent with this result, we found that P-values from LARVA follow a uniform distribution much better than those from binomial distribution (Supplementary Figure S13). We want to emphasize that as the sample size grows larger (such as in the following section of exome sample analysis) and the target region grows larger, we expect more severe deviation from the constant mutation rate assumption, usually resulting in better performance for LARVA compared to the binomial model.
Figure 7.

Manhattan plot of the P-values from 5000 randomly samples 10 kb bins from the β-binomial distribution (A) and the binomial distribution (B). The binomial distribution might provide heavily inflated P-values due to its inadequacy to capture the extensive overdispersion of the mutation count data.
Coding region calibration
It is difficult to rigorously test LARVA's sensitivity and specificity due to the lack of a benchmark dataset. In contrast to our expectations for the coding regions, we have less information for how LARVA should behave on noncoding regions. Thus, although LARVA is not optimized on coding region analysis, we re-estimated the background model on just the coding regions for the purpose of calibration. In particular, given our better understanding of coding cancer drivers, we have evaluated LARVA on coding regions on a total of 5032 whole exome sequencing samples from TCGA (see SupplementaryText S1 for details). To compare the β-binomial model with the binomial model we used a consistent and conservative threshold for both.
Many highly mutated genes discovered by LARVA were clearly documented as associated with some type of cancer. On the other hand, many false positIves were reported by the simple binomial test. Moreover, P-values calculated from LARVA follow a uniform distribution quite well and our replication timing correction further improves the P-value distribution (Supplementary Figure S12). However, the P-value distribution from the binomial model severely violates the uniform distribution assumption, providing further evidence of the binomial model's inapproapriate fitting.
DISCUSSION
Due to the rapid decline in time and money involved to perform WGS, data is now available for thousands of genomes where previously only a handful were available (57). However, the analyses necessary for finding useful patterns in this data, and making sense of it for clinical benefit, have not kept pace with this sudden increase. Therefore, it is important that new algorithms are developed that can efficiently mine relevant patterns from genome sequence data, and that user interfaces for finding and understanding that data are optimized so that clinicians and biologists, who may not have extensive technical expertise, can use these results effectively in their work.
Compared with the extensive computational and experimental efforts on the mutation patterns in the protein-coding regions in the past decade (58), the noncoding regions, which were viewed as ‘dark matter’, and comprise up to 98% of the human genome, are less investigated in cancer research studies, partially due to the limited knowledge of noncoding function. However, recently several examples clearly pinpointed the phenotypic effect of mutations in noncoding regulatory regions in a variety of cancer types. For instance, TERT promoter, a well-known example, has been associated with several cancer types (21–23). Fusions of the 5′ UTR of TMPRSS2 with ETS genes frequently observed in prostate cancer, as well as mutations in certain miRNA binding sites (59), can influence the binding affinity at these sites, and thus affect androgen receptor regulation in prostate cancer. Hence, it is important to explore the mutation landscapes of such noncoding regions.
In this paper, we have introduced a new computational framework for exploring patterns of mutation in the noncoding regulatory regions. Unlike coding region analyses, where burden tests may be conducted with naturally defined segments—genes—and synonymous sites may serve as a biologically meaningful background, whole genome burden tests are hindered by the fact that many noncoding functional regions are poorly defined, if at all. We took advantage of the complete genome annotation efforts of the ENCODE project (16) to extract the most extensive catalog of noncoding regulatory regions to date. We included the TF binding sites and DHS sites from all ENCODE experiments, promoters, UTRs, predicted enhancers, conserved and sensitive noncoding regions from our previous efforts (18). These annotations are tested for mutation burden, and the functional significance of each highly mutated region is immediately clear. Hence, LARVA's complete design, in terms of both software and provided data, offers a new, convenient processing engine for whole genome mutation burden analysis.
We then ran our algorithm on 760 cancer genomes using the comprehensive list of noncoding annotations to search for highly mutated regulatory regions as potential noncoding driver candidates. Consistent with the highly heterogeneous protein coding regions (11), we observed larger than expected mutation variation across cancer types, samples and genomic regions (Figure 3). Therefore, the recently proposed binomial models, which assume a constant mutation rate and independence of mutation events, might be inadequate for the observed data (Figure 4, Supplementary Figures S3 and S4). Instead, we set up two hierarchical models to handle mutation count overdispersion (model 2 and model 3 in the ‘Materials and Methods’ section). First, we flexibly modeled the mutation rate in the regulatory elements as a two-parameter β distribution β(μ, δ), resulting in a β-binomial distribution for the variant counts; β(μ, δ) can be seen as the distribution from which the whole genome region-specific mutation rates (p) are sampled. Alternatively, β(μ, δ) can be treated as the distribution from which patient-specific or cancer type-specific mutation rates are sampled. Therefore, when analyzing large regions, such as enhancers that might be over 10 kb, or small regions (such as 200 bp TSS sites) in cohorts with a large number of samples, the β-binomial model provides improved fitting over the binomial model. On the other hand, when the target region is small, or the patients are more homogeneous, we expect less overdispersion from the data. Then, the estimated β-binomial parameters will be similar to those of the binomial distribution.
In addition, a list of genomic features, such replication timing, expression level and GC content would largely affect the background mutation rate (Supplementary Figure S6)(11). As a consequence, the overall background mutation rate is actually a mixture of several different distributions, resulting in extra variance in the mutation count data (Supplementary Figure S14 in Text S1). Therefore, it is necessary to separate the covariate effects. In this paper, we found replication timing is the feature that explains the largest amount of variation in the mutation counts data, so we started from this major covariate and corrected its effect by estimating the local mutation parameters in the β-binomial. In the future, we plan to further correct multiple covariates jointly. Moreover, in general the quality of LARVA output depends on the quality of the input variants. There are some known artifacts in the earlier variant call sets which might introduce biased results. In the future, the release of large scale uniformly processed variant call sets will definitely improve subsequent LARVA analyses.
In the 760 cancer whole genomes in our analysis, we discovered 3776 noncoding regulatory regions that have significantly higher mutations than expected and provided the mutation enrichment significance of bins with variable length on the whole genome (Table 2). A list of known noncoding hypomutated regions, such as TERT and TP53 TSS, were also reported by our analysis, which convincingly proved the effectiveness of LARVA in discovering functionally relevant results. We also observed some relatively novel results such as PRRC2B TSS, CTCF and BCL3 binding sites. BCL3 is a known oncogene that is highly associated with several solid tumors (56,60), but this gene itself is not enriched in our analysis. Our results advocate an alternate possibility: its mutation in cancer cells is actually in the disruption of its binding sites, rather than the disabling of the protein itself. We released our annotations to the public, which would potentially serve as a useful resource for cancer researchers in the future.
In summary, LARVA is a powerful computational method to explore a broad range of genome annotations to uncover the ones that are mutated across many samples. LARVA makes it possible to predict putative noncoding drivers of genetic disease, and prioritize these predicted drivers for more rigorous downstream analysis. This may lead to faster identification of important targets that may be used to suppress disease with therapies and drugs.
AVAILABILITY
We make LARVA available as a software tool at larva.gersteinlab.org. We also make our data and results available at this URL, which includes our complete set of cancer variant data, noncoding annotations and P-values computed by the LARVA software on this data.
SUPPLEMENTARY DATA
Supplementary Data are available at NAR Online.
Acknowledgments
We would like to thank the Yale Center for Research Computing for their compute cluster resources.
FUNDING
National Institutes of Health [5R01CA152057-02]. Funding for open access charge: National Institutes of Health.
Conflict of interest statement. None declared.
REFERENCES
- 1.Barbieri C.E., Baca S.C., Lawrence M.S., Demichelis F., Blattner M., Theurillat J.P., White T.A., Stojanov P., Van Allen E., Stransky N., et al. Exome sequencing identifies recurrent SPOP, FOXA1 and MED12 mutations in prostate cancer. Nat. Genet. 2012;44:685–689. doi: 10.1038/ng.2279. [DOI] [PMC free article] [PubMed] [Google Scholar]
- 2.Baca S.C., Prandi D., Lawrence M.S., Mosquera J.M., Romanel A., Drier Y., Park K., Kitabayashi N., MacDonald T.Y., Ghandi M., et al. Punctuated evolution of prostate cancer genomes. Cell. 2013;153:666–677. doi: 10.1016/j.cell.2013.03.021. [DOI] [PMC free article] [PubMed] [Google Scholar]
- 3.Grasso C.S., Wu Y.M., Robinson D.R., Cao X., Dhanasekaran S.M., Khan A.P., Quist M.J., Jing X., Lonigro R.J., Brenner J.C., et al. The mutational landscape of lethal castration-resistant prostate cancer. Nature. 2012;487:239–243. doi: 10.1038/nature11125. [DOI] [PMC free article] [PubMed] [Google Scholar]
- 4.Shi L., Zhang X., Golhar R., Otieno F.G., He M., Hou C., Kim C., Keating B., Lyon G.J., Wang K., et al. Whole-genome sequencing in an autism multiplex family. Mol. autism. 2013;4:8–22. doi: 10.1186/2040-2392-4-8. [DOI] [PMC free article] [PubMed] [Google Scholar]
- 5.Almasy L., Dyer T.D., Peralta J.M., Jun G., Wood A.R., Fuchsberger C., Almeida M.A., Kent J.W., Fowler S., Blackwell T.W., et al. Data for Genetic Analysis Workshop 18: human whole genome sequence, blood pressure, and simulated phenotypes in extended pedigrees. BMC Proc. 2014;8:S2–S10. doi: 10.1186/1753-6561-8-S1-S2. [DOI] [PMC free article] [PubMed] [Google Scholar]
- 6.Tervasmaki A., Winqvist R., Jukkola-Vuorinen A., Pylkas K. Recurrent CYP2C19 deletion allele is associated with triple-negative breast cancer. BMC Cancer. 2014;14:902–908. doi: 10.1186/1471-2407-14-902. [DOI] [PMC free article] [PubMed] [Google Scholar]
- 7.Stefansson O.A., Moran S., Gomez A., Sayols S., Arribas-Jorba C., Sandoval J., Hilmarsdottir H., Olafsdottir E., Tryggvadottir L., Jonasson J.G., et al. A DNA methylation-based definition of biologically distinct breast cancer subtypes. Mol. Oncol. 2014;9:555–568. doi: 10.1016/j.molonc.2014.10.012. [DOI] [PMC free article] [PubMed] [Google Scholar]
- 8.Zhang B., Wang J., Wang X., Zhu J., Liu Q., Shi Z., Chambers M.C., Zimmerman L.J., Shaddox K.F., Kim S., et al. Proteogenomic characterization of human colon and rectal cancer. Nature. 2014;513:382–387. doi: 10.1038/nature13438. [DOI] [PMC free article] [PubMed] [Google Scholar]
- 9.Chen X., Iliopoulos D., Zhang Q., Tang Q., Greenblatt M.B., Hatziapostolou M., Lim E., Tam W.L., Ni M., Chen Y., et al. XBP1 promotes triple-negative breast cancer by controlling the HIF1alpha pathway. Nature. 2014;508:103–107. doi: 10.1038/nature13119. [DOI] [PMC free article] [PubMed] [Google Scholar]
- 10.Kurtova A.V., Xiao J., Mo Q., Pazhanisamy S., Krasnow R., Lerner S.P., Chen F., Roh T.T., Lay E., Ho P.L., et al. Blocking PGE-induced tumour repopulation abrogates bladder cancer chemoresistance. Nature. 2014;517:209–213. doi: 10.1038/nature14034. [DOI] [PMC free article] [PubMed] [Google Scholar]
- 11.Lawrence M.S., Stojanov P., Polak P., Kryukov G.V., Cibulskis K., Sivachenko A., Carter S.L., Stewart C., Mermel C.H., Roberts S.A., et al. Mutational heterogeneity in cancer and the search for new cancer-associated genes. Nature. 2013;499:214–218. doi: 10.1038/nature12213. [DOI] [PMC free article] [PubMed] [Google Scholar]
- 12.Rudd M.L., Mohamed H., Price J.C., AJ O.H., Le Gallo M., Urick M.E., Cruz P., Zhang S., Hansen N.F., Godwin A.K., et al. Mutational analysis of the tyrosine kinome in serous and clear cell endometrial cancer uncovers rare somatic mutations in TNK2 and DDR1. BMC Cancer. 2014;14:884–892. doi: 10.1186/1471-2407-14-884. [DOI] [PMC free article] [PubMed] [Google Scholar]
- 13.Long G.V., Fung C., Menzies A.M., Pupo G.M., Carlino M.S., Hyman J., Shahheydari H., Tembe V., Thompson J.F., Saw R.P., et al. Increased MAPK reactivation in early resistance to dabrafenib/trametinib combination therapy of BRAF-mutant metastatic melanoma. Nat. Commun. 2014;5:5694–5702. doi: 10.1038/ncomms6694. [DOI] [PubMed] [Google Scholar]
- 14.Yadav M., Jhunjhunwala S., Phung Q.T., Lupardus P., Tanguay J., Bumbaca S., Franci C., Cheung T.K., Fritsche J., Weinschenk T., et al. Predicting immunogenic tumour mutations by combining mass spectrometry and exome sequencing. Nature. 2014;515:572–576. doi: 10.1038/nature14001. [DOI] [PubMed] [Google Scholar]
- 15.Youn A., Simon R. Identifying cancer driver genes in tumor genome sequencing studies. Bioinformatics. 2011;27:175–181. doi: 10.1093/bioinformatics/btq630. [DOI] [PMC free article] [PubMed] [Google Scholar]
- 16.Consortium E.P. An integrated encyclopedia of DNA elements in the human genome. Nature. 2012;489:57–74. doi: 10.1038/nature11247. [DOI] [PMC free article] [PubMed] [Google Scholar]
- 17.Gerstein M.B., Rozowsky J., Yan K.K., Wang D., Cheng C., Brown J.B., Davis C.A., Hillier L., Sisu C., Li J.J., et al. Comparative analysis of the transcriptome across distant species. Nature. 2014;512:445–448. doi: 10.1038/nature13424. [DOI] [PMC free article] [PubMed] [Google Scholar]
- 18.Fu Y., Liu Z., Lou S., Bedford J., Mu X., Yip K.Y., Khurana E., Gerstein M. FunSeq2: a framework for prioritizing noncoding regulatory variants in cancer. Genome Biology. 2014;15:480–494. doi: 10.1186/s13059-014-0480-5. [DOI] [PMC free article] [PubMed] [Google Scholar]
- 19.Futreal P.A., Coin L., Marshall M., Down T., Hubbard T., Wooster R., Rahman N., Stratton M.R. A census of human cancer genes. Nat. Rev. Cancer. 2004;4:177–183. doi: 10.1038/nrc1299. [DOI] [PMC free article] [PubMed] [Google Scholar]
- 20.Dees N.D., Zhang Q., Kandoth C., Wendl M.C., Schierding W., Koboldt D.C., Mooney T.B., Callaway M.B., Dooling D., Mardis E.R., et al. MuSiC: identifying mutational significance in cancer genomes. Genome Res. 2012;22:1589–1598. doi: 10.1101/gr.134635.111. [DOI] [PMC free article] [PubMed] [Google Scholar]
- 21.Vinagre J., Almeida A., Populo H., Batista R., Lyra J., Pinto V., Coelho R., Celestino R., Prazeres H., Lima L., et al. Frequency of TERT promoter mutations in human cancers. Nat. Commun. 2013;4:2185–2190. doi: 10.1038/ncomms3185. [DOI] [PubMed] [Google Scholar]
- 22.Maurano M.T., Humbert R., Rynes E., Thurman R.E., Haugen E., Wang H., Reynolds A.P., Sandstrom R., Qu H., Brody J., et al. Systematic localization of common disease-associated variation in regulatory DNA. Science. 2012;337:1190–1195. doi: 10.1126/science.1222794. [DOI] [PMC free article] [PubMed] [Google Scholar]
- 23.Grossman S.R., Andersen K.G., Shlyakhter I., Tabrizi S., Winnicki S., Yen A., Park D.J., Griesemer D., Karlsson E.K., Wong S.H., et al. Identifying recent adaptations in large-scale genomic data. Cell. 2013;152:703–713. doi: 10.1016/j.cell.2013.01.035. [DOI] [PMC free article] [PubMed] [Google Scholar]
- 24.Weinhold N., Jacobsen A., Schultz N., Sander C., Lee W. Genome-wide analysis of noncoding regulatory mutations in cancer. Nat. Genet. 2014;46:1160–1165. doi: 10.1038/ng.3101. [DOI] [PMC free article] [PubMed] [Google Scholar]
- 25.Erturk E., Cecener G., Polatkan V., Gokgoz S., Egeli U., Tunca B., Tezcan G., Demirdogen E., Ak S., Tasdelen I. Evaluation of genetic variations in miRNA-binding sites of BRCA1 and BRCA2 genes as risk factors for the development of early-onset and/or familial breast cancer. Asian Pac. J. Cancer Prev. 2014;15:8319–8324. doi: 10.7314/apjcp.2014.15.19.8319. [DOI] [PubMed] [Google Scholar]
- 26.Medrzycki M., Zhang Y., Zhang W., Cao K., Pan C., Lailler N., McDonald J.F., Bouhassira E.E., Fan Y. Histone h1.3 suppresses h19 noncoding RNA expression and cell growth of ovarian cancer cells. Cancer Res. 2014;74:6463–6473. doi: 10.1158/0008-5472.CAN-13-2922. [DOI] [PMC free article] [PubMed] [Google Scholar]
- 27.Alexandrov L.B., Nik-Zainal S., Wedge D.C., Aparicio S.A., Behjati S., Biankin A.V., Bignell G.R., Bolli N., Borg A., Borresen-Dale A.L., et al. Signatures of mutational processes in human cancer. Nature. 2013;500:415–421. doi: 10.1038/nature12477. [DOI] [PMC free article] [PubMed] [Google Scholar]
- 28.Cancer Genome Atlas Research Network. Comprehensive genomic characterization defines human glioblastoma genes and core pathways. Nature. 2008;455:1061–1068. doi: 10.1038/nature07385. [DOI] [PMC free article] [PubMed] [Google Scholar]
- 29.Berger M.F., Lawrence M.S., Demichelis F., Drier Y., Cibulskis K., Sivachenko A.Y., Sboner A., Esgueva R., Pflueger D., Sougnez C., et al. The genomic complexity of primary human prostate cancer. Nature. 2011;470:214–220. doi: 10.1038/nature09744. [DOI] [PMC free article] [PubMed] [Google Scholar]
- 30.Weischenfeldt J., Simon R., Feuerbach L., Schlangen K., Weichenhan D., Minner S., Wuttig D., Warnatz H.J., Stehr H., Rausch T., et al. Integrative genomic analyses reveal an androgen-driven somatic alteration landscape in early-onset prostate cancer. Cancer Cell. 2013;23:159–170. doi: 10.1016/j.ccr.2013.01.002. [DOI] [PubMed] [Google Scholar]
- 31.Wang K., Yuen S.T., Xu J., Lee S.P., Yan H.H., Shi S.T., Siu H.C., Deng S., Chu K.M., Law S., et al. Whole-genome sequencing and comprehensive molecular profiling identify new driver mutations in gastric cancer. Nat. Genet. 2014;46:573–582. doi: 10.1038/ng.2983. [DOI] [PubMed] [Google Scholar]
- 32.Cancer Genome Atlas Research Network. Weinstein J.N., Collisson E.A., Mills G.B., Shaw K.R., Ozenberger B.A., Ellrott K., Shmulevich I., Sander C., Stuart J.M. The Cancer Genome Atlas Pan-Cancer analysis project. Nat. Genet. 2013;45:1113–1120. doi: 10.1038/ng.2764. [DOI] [PMC free article] [PubMed] [Google Scholar]
- 33.Hodgkinson A., Eyre-Walker A. Variation in the mutation rate across mammalian genomes. Nat. Rev. Genet. 2011;12:756–766. doi: 10.1038/nrg3098. [DOI] [PubMed] [Google Scholar]
- 34.Derrien T., Estelle J., Marco Sola S., Knowles D.G., Raineri E., Guigo R., Ribeca P. Fast computation and applications of genome mappability. PLoS One. 2012;7:e30377. doi: 10.1371/journal.pone.0030377. [DOI] [PMC free article] [PubMed] [Google Scholar]
- 35.Quinlan A.R., Hall I.M. BEDTools: a flexible suite of utilities for comparing genomic features. Bioinformatics. 2010;26:841–842. doi: 10.1093/bioinformatics/btq033. [DOI] [PMC free article] [PubMed] [Google Scholar]
- 36.Harrow J., Frankish A., Gonzalez J.M., Tapanari E., Diekhans M., Kokocinski F., Aken B.L., Barrell D., Zadissa A., Searle S., et al. GENCODE: the reference human genome annotation for The ENCODE Project. Genome Res. 2012;22:1760–1774. doi: 10.1101/gr.135350.111. [DOI] [PMC free article] [PubMed] [Google Scholar]
- 37.Rozowsky J., Euskirchen G., Auerbach R.K., Zhang Z.D., Gibson T., Bjornson R., Carriero N., Snyder M., Gerstein M.B. PeakSeq enables systematic scoring of ChIP-seq experiments relative to controls. Nat. Biotechnol. 2009;27:66–75. doi: 10.1038/nbt.1518. [DOI] [PMC free article] [PubMed] [Google Scholar]
- 38.Yip K.Y., Cheng C., Bhardwaj N., Brown J.B., Leng J., Kundaje A., Rozowsky J., Birney E., Bickel P., Snyder M., et al. Classification of human genomic regions based on experimentally determined binding sites of more than 100 transcription-related factors. Genome Biol. 2012;13:R48–R69. doi: 10.1186/gb-2012-13-9-r48. [DOI] [PMC free article] [PubMed] [Google Scholar]
- 39.Thurman R.E., Rynes E., Humbert R., Vierstra J., Maurano M.T., Haugen E., Sheffield N.C., Stergachis A.B., Wang H., Vernot B., et al. The accessible chromatin landscape of the human genome. Nature. 2012;489:75–82. doi: 10.1038/nature11232. [DOI] [PMC free article] [PubMed] [Google Scholar]
- 40.Bejerano G., Pheasant M., Makunin I., Stephen S., Kent W.J., Mattick J.S., Haussler D. Ultraconserved elements in the human genome. Science. 2004;304:1321–1325. doi: 10.1126/science.1098119. [DOI] [PubMed] [Google Scholar]
- 41.Khurana E., Fu Y., Colonna V., Mu X.J., Kang H.M., Lappalainen T., Sboner A., Lochovsky L., Chen J., Harmanci A., et al. Integrative annotation of variants from 1092 humans: application to cancer genomics. Science. 2013;342:1235587–1235597. doi: 10.1126/science.1235587. [DOI] [PMC free article] [PubMed] [Google Scholar]
- 42.Ding L., Wendl M.C., Koboldt D.C., Mardis E.R. Analysis of next-generation genomic data in cancer: accomplishments and challenges. Hum. Mol. Genet. 2010;19:R188–R196. doi: 10.1093/hmg/ddq391. [DOI] [PMC free article] [PubMed] [Google Scholar]
- 43.Young-Xu Y., Chan K.A. Pooling overdispersed binomial data to estimate event rate. BMC Med. Res. Methodol. 2008;8:58–69. doi: 10.1186/1471-2288-8-58. [DOI] [PMC free article] [PubMed] [Google Scholar]
- 44.Kleinman J.C. Proportions with extraneous variance: two dependent samples. Biometrics. 1975;31:737–743. [PubMed] [Google Scholar]
- 45.Stamatoyannopoulos J.A., Adzhubei I., Thurman R.E., Kryukov G.V., Mirkin S.M., Sunyaev S.R. Human mutation rate associated with DNA replication timing. Nat. Genet. 2009;41:393–395. doi: 10.1038/ng.363. [DOI] [PMC free article] [PubMed] [Google Scholar]
- 46.Tian D., Wang Q., Zhang P., Araki H., Yang S., Kreitman M., Nagylaki T., Hudson R., Bergelson J., Chen J.Q. Single-nucleotide mutation rate increases close to insertions/deletions in eukaryotes. Nature. 2008;455:105–108. doi: 10.1038/nature07175. [DOI] [PubMed] [Google Scholar]
- 47.Hollister J.D., Ross-Ibarra J., Gaut B.S. Indel-associated mutation rate varies with mating system in flowering plants. Mol. Biol. Evol. 2010;27:409–416. doi: 10.1093/molbev/msp249. [DOI] [PubMed] [Google Scholar]
- 48.McDonald M.J., Wang W.C., Huang H.D., Leu J.Y. Clusters of nucleotide substitutions and insertion/deletion mutations are associated with repeat sequences. PLoS Biol. 2011;9:e1000622. doi: 10.1371/journal.pbio.1000622. [DOI] [PMC free article] [PubMed] [Google Scholar]
- 49.Benjamini Y., Hochberg Y. Controlling the false discovery rate: a practical and powerful approach to multiple testing. J. R. Stat. Soc. B. 1995;57:289–300. [Google Scholar]
- 50.Kwon Y.J., Lee S.J., Koh J.S., Kim S.H., Lee H.W., Kang M.C., Bae J.B., Kim Y.J., Park J.H. Genome-wide analysis of DNA methylation and the gene expression change in lung cancer. J. Thorac. Oncol. 2012;7:20–33. doi: 10.1097/JTO.0b013e3182307f62. [DOI] [PubMed] [Google Scholar]
- 51.Isogai E., Ohira M., Ozaki T., Oba S., Nakamura Y., Nakagawara A. Oncogenic LMO3 collaborates with HEN2 to enhance neuroblastoma cell growth through transactivation of Mash1. PLoS One. 2011;6:e19297. doi: 10.1371/journal.pone.0019297. [DOI] [PMC free article] [PubMed] [Google Scholar]
- 52.Ashburner M., Ball C.A., Blake J.A., Botstein D., Butler H., Cherry J.M., Davis A.P., Dolinski K., Dwight S.S., Eppig J.T., et al. Gene ontology: tool for the unification of biology. The Gene Ontology Consortium. Nat. Genet. 2000;25:25–29. doi: 10.1038/75556. [DOI] [PMC free article] [PubMed] [Google Scholar]
- 53.Filippova G.N. Genetics and epigenetics of the multifunctional protein CTCF. Curr. Top. Dev. Biol. 2008;80:337–360. doi: 10.1016/S0070-2153(07)80009-3. [DOI] [PubMed] [Google Scholar]
- 54.Ohlsson R., Renkawitz R., Lobanenkov V. CTCF is a uniquely versatile transcription regulator linked to epigenetics and disease. Trends Genet. 2001;17:520–527. doi: 10.1016/s0168-9525(01)02366-6. [DOI] [PubMed] [Google Scholar]
- 55.Takai D., Gonzales F.A., Tsai Y.C., Thayer M.J., Jones P.A. Large scale mapping of methylcytosines in CTCF-binding sites in the human H19 promoter and aberrant hypomethylation in human bladder cancer. Hum. Mol. Genet. 2001;10:2619–2626. doi: 10.1093/hmg/10.23.2619. [DOI] [PubMed] [Google Scholar]
- 56.Maldonado V., Melendez-Zajgla J. Role of Bcl-3 in solid tumors. Mol. Cancer. 2011;10:152–158. doi: 10.1186/1476-4598-10-152. [DOI] [PMC free article] [PubMed] [Google Scholar]
- 57.Shendure J., Ji H. Next-generation DNA sequencing. Nat. Biotechnol. 2008;26:1135–1145. doi: 10.1038/nbt1486. [DOI] [PubMed] [Google Scholar]
- 58.Koch L. Cancer genomics: non-coding mutations in the driver seat. Nat. Rev. Genet. 2014;15:574–575. doi: 10.1038/nrg3801. [DOI] [PubMed] [Google Scholar]
- 59.Lin P.C., Chiu Y.L., Banerjee S., Park K., Mosquera J.M., Giannopoulou E., Alves P., Tewari A.K., Gerstein M.B., Beltran H., et al. Epigenetic repression of miR-31 disrupts androgen receptor homeostasis and contributes to prostate cancer progression. Cancer Res. 2013;73:1232–1244. doi: 10.1158/0008-5472.CAN-12-2968. [DOI] [PMC free article] [PubMed] [Google Scholar]
- 60.Kim Y.M., Sharma N., Nyborg J.K. The proto-oncogene Bcl3, induced by Tax, represses Tax-mediated transcription via p300 displacement from the human T-cell leukemia virus type 1 promoter. J. Virol. 2008;82:11939–11947. doi: 10.1128/JVI.01356-08. [DOI] [PMC free article] [PubMed] [Google Scholar]
Associated Data
This section collects any data citations, data availability statements, or supplementary materials included in this article.