


Abstract
Alternative splicing is an important and ancient feature of eukaryotic gene structure, the existence of which has likely facilitated eukaryotic proteome expansions. Here, we have used intron lariat sequencing to generate a comprehensive profile of splicing events in Schizosaccharomyces pombe, amongst the simplest organisms that possess mammalian-like splice site degeneracy. We reveal an unprecedented level of alternative splicing, including alternative splice site selection for over half of all annotated introns, hundreds of novel exon-skipping events, and thousands of novel introns. Moreover, the frequency of these events is far higher than previous estimates, with alternative splice sites on average activated at ∼3% the rate of canonical sites. Although a subset of alternative sites are conserved in related species, implying functional potential, the majority are not detectably conserved. Interestingly, the rate of aberrant splicing is inversely related to expression level, with lowly expressed genes more prone to erroneous splicing. Although we validate many events with RNAseq, the proportion of alternative splicing discovered with lariat sequencing is far greater, a difference we attribute to preferential decay of aberrantly spliced transcripts. Together, these data suggest the spliceosome possesses far lower fidelity than previously appreciated, highlighting the potential contributions of alternative splicing in generating novel gene structures.
INTRODUCTION
The process of pre-messenger RNA (pre-mRNA) splicing, mediated by the spliceosome and accessory proteins, removes non-coding introns, which are found throughout most eukaryotic transcripts (1). Interactions between the spliceosome and sequences within introns are central to the mechanism of splicing. The essential sequences are the 5′ and 3′ splice sites (5′ and 3′SS), found at the termini of the intron, and an internal sequence known as the branchpoint (BP) (2). Along with spliced exons, excised introns are released from the spliceosome as a lariat, in which the 5′SS is covalently attached via a 2′-5′ phosphodiester linkage to an essential adenosine within the BP sequence (3). Thus, the progress and patterns of splicing can be monitored by methods that detect either the mature spliced mRNA or the intron lariats.
In higher eukaryotes, alternative splicing provides a powerful opportunity for both regulation of gene expression and generation of proteome diversity (4). Mechanistically, alternative splicing derives from control of splice site selection (5). The splice site sequences in mammalian introns are highly degenerate, often requiring the activity of auxiliary proteins to enhance activation of sub-optimal sequences (6). Because of the low information content at many mammalian splice sites, nearby cryptic sites can be activated, resulting in the production of alternative splice products, many of which are subjected to degradation by RNA quality control pathways (7). Several estimates of the intrinsic rate at which the spliceosome aberrantly generates alternative splicing products have been previously published. A quantitative RT-PCR based study of mammalian splicing suggested an exceptionally low rate of aberrant exon skipping, on the order of one error for every 103–105 splicing events (8). By contrast, computational modeling of exon skipping and alternative splice site usage within mammalian EST data predicted higher error rates that were variable, dependent upon expression level and intron number of the host transcript (9). And finally, analyses of large RNA-seq datasets have identified alternative events at a rate of one in 102–103 splicing events (10). Importantly, it is unclear whether any of these approaches are appropriate for defining the actual spliceosomal error rate given that they predominantly measure mature mRNA levels, which derive from both rates of splicing error and preferential decay of mispliced products.
Here we examine global splice site selection in the fission yeast, Schizosaccaromyces pombe. Unlike budding yeast, splice site sequences in S. pombe are highly degenerate and comparable to those found in mammalian introns (11,12). Furthermore, nearly half of all S. pombe genes contain an intron, and nearly half of those contain multiple introns. We previously described a lariat sequencing approach that allows for high depth analysis of splicing events (13). Here, we have improved upon this approach to generate the most comprehensive dataset of experimentally identified splicing events in an organism with degenerate splice site sequences. We observe a large number of alternatively spliced isoforms, a subset of which correspond to conserved alternative splice sites. Remarkably, we also observe a rate of alternate splice site selection that is greatly higher than previous estimates. Together, these data provide compelling evidence suggesting that spliceosomal infidelity is widespread, and provides a powerful mechanism by which alternative gene structures can evolve (14).
MATERIALS AND METHODS
Strains used
yNZS005 was used as the WT strain and was from ATCC (Linder 972, #38366). yNZS006 contained a deletion of the dbr1 locus from yNS005 and was generated as previously described (13). yNS008 contained a deletion of the upf1 locus, and was taken from the S. pombe Haploid Deletion Collection from Bioneer, and yNS007 was the matched wild type strain from this library.
Yeast cultures
Unless otherwise noted, yeast cultures were grown according to standard protocols (15). Cells were harvested by filtration thru Millipore HAWP0025 filters when OD600 measurements were between 0.8 and 1.0. For heat shock samples, after reaching the noted OD600 the cultures were shifted to 37°C for 15 minutes and then harvested. For the diauxic shift samples, the cultures were allowed to grow until the OD600 reached 7.6.
Two-dimensional (2D) gel electrophoresis
Denaturing acrylamide gels were polymerized with 7.5 M Urea with varying acrylamide concentrations. Two sets of gels were run: one designed to isolate shorter lariats and the other to isolate longer lariats. For shorter lariats, the acrylamide percentages were 7.5% and 15% for the first and second dimensions, respectively. For the longer lariats, the percentages were 4% and 8%. For both gel types, 40–60 μg of Δdbr1 RNA was loaded onto the first gel. The first gel was run at 200 V for 2 h and the second gel at 230 V for 2 h followed by 290 V for 1 h. The entire lane containing the RNA was cut from the gel, rotated, and recast at the top of the second gel. The second gels were run until the xylene cyanol dye migrated 5.5 or 9 cm for the short and long lariats, respectively. Gels were stained, visualized (Dark Reader or Typhoon) and lariat arcs were excised. RNA was extracted according to standard protocols.
Lariat sequencing library construction
The RNAs from 2D gels were used to construct non-stranded multiplexed libraries using a custom protocol that placed appropriate sequences for multiplexed Illumina-sequencing. The first strand and second strand synthesis was done using Invitrogen second strand synthesis kit and 500 ng of dN9 primer. Because of the high levels of dN9 present in our first strand reaction, we omitted the Escherichia coli DNA ligase from the second strand reaction. After second strand synthesis, the products were run on a native gel and the library was recovered between ∼20 and 300 nucleotides. The sized material was eluted from the gel by adding 4x volume of 0.3 M NaOAc pH 5.3. The DNA was ethanol precipitated by adding 2.5 volumes of 95% ethanol, incubating at −20°C, spinning at 14 000 × g for 20 min, washing twice with 70% ethanol for 10 min and resuspending in 10 μl H2O. For all subsequent steps, enzymatic reactions were purified using phenol:chloroform extraction followed by ethanol precipitation. DNA end repair was performed using NEB Next End Repair Module. Next, dA tailing was performed using the NEB Next dA-tailing Module. Adapter ligation was performed using T4 DNA Ligase (Rapid) from Enzymatics and 1 μl of Illumina barcoded adapter. The resulting ligation product was sized on a denaturing urea gel between 130 and 300 nucleotides. This was precipitated and sequenced on an Illumina Hiseq 2000 with single-end 100 nucleotide reads.
Lariat sequencing genome alignment
Illumina sequence reads were trimmed of the 3′ adapter using Trimmomatic (16) with parameters:3:30:10 and MINLEN:18. Trimmed reads were aligned to the S. pombe genome (pombase.org, Schizosaccharomyces_pombe.ASM294v2.21.dna.genome.fa) using Bowtie2 (17). Parameters of alignment were ‘score-min L,-0.4,-0.4 –very-sensitive’. End-to-end alignments were done for the initial genome alignment. Paired end alignments on split reads were done using ‘–ff -I 20 -X 3000 –no-mixed –no-discordant’.
Splice site scoring
Log-odds scores for splice sites were computed from a Position Weight Matrix (PWM) (6). The 5′SS was scored either using the dinucleotides within the first nine nucleotides of annotated introns or using the dinucleotides within three nucleotides upstream the 5′SS through the first nine nucleotides of annotated introns for the foreground signal and the dinucleotides of annotated intron sequences for the background signal. The former was used during splitting reads only, while the later was used for all analysis after split read identification. The putative BP was scored using an 8 position dinucleotide model using branch points identified from the aligned_introns.txt file from pombase.org for the foreground signal and the dinucleotide composition of introns for background signal. The BP and 9-nucleotide 5′SS scores have a similar maximal value in this scheme.
Branch spanning split read alignment
For identification of branch spanning reads, each read that failed to align to the genome in end-to-end fashion was split into paired-end reads at every GT dinucleotide, including those that appeared in the reverse complement of the strand. For alignment, we only considered the subset of these reads for which the splitting process produced two fragments of at least 10 nucleotides, and excluded all others. These reads were then assessed for alignment using Bowtie2 in paired-end mode with the fragment containing the GT as mate 1 and the other as mate 2, and using the previously noted parameters. Since a single read split in this fashion can yield several possible alignments, possible GT split alignments were collapsed into a best available paired-end alignment that minimizes the number of mismatches in the alignment. As an additional criterion to judge alignment quality, log-odds scores were calculated for the putative 5′SS (GT end of the alignment) and BP (the other end of the alignment): the combination of these scores was required to be greater than 0; this strategy was used to both break ties and reduce the number of artifactual alignments.
Reverse transcriptase frequently introduces deletions and mutations when creating the cDNA product that crosses the 5′SS to the BP (18). To determine the likely branch point nucleotide, BP scores were computed between two nucleotides upstream of the non-GT end of the paired alignment and three nucleotides downstream of the read end and the position of the BP was determined by the maximal BP score in that range. Due to the to the high rate of mismatches from reverse transcriptase reading across the branch point of the lariat, up to two mismatches within ±1 nucleotide of the putative branchpoint adenosine were disregarded for total mismatch calculations. The position where the BP minimized the number of mismatches was considered the branch point. If the branch point score caused the total log-odds scores to fall below 0, then the read was considered to fail alignment.
At a low frequency, the heuristics of Bowtie2 are such that it can fail to find an alignment when an acceptable alignment is possible. At a low rate this results in incorrect alignments where a nearly correct version of the GT iteration with some mismatches has an alignment but the correct alignment failed to align. Found alignments were assessed for better nearby alignments by appropriately shifting sequence from one end of the alignment to the other side. This shifted sequence was checked to see if it decreased the number of total mismatches in the alignment. The BP was then reevaluated in this alignment, as described above. Additionally, since Bowtie2 may have failed to correctly align a read to the genome in end-to-end fashion, found split read alignments were assayed for this by anchoring one end of the mate-pair to the genome and checking if recreating the original read leads to the non-anchored mate aligning using the Smith–Waterman algorithm. If this original-format alignment was plausible, then the paired-end read alignment was removed from further analysis.
To estimate an upper bound for false alignments generated by our split-read approach, the alignment strategy described above was applied to the reads that aligned to the genome with one difference: the initial reads were split at GA dinucleotides instead of GT. Of the ∼78 million genome-aligning reads assessed this way, only 15 727 reads could be split and aligned to the genome, reflecting a total of 1267 intron branch intervals, yielding a false alignment rate of only ∼0.02%. Importantly, this rate may well be an over estimate because of the propensity of some ‘true’ split reads to incorrectly align to the genome with mismatches.
Branch read identification
Strandedness of a split read was determined by selecting the highest scoring 5′SS and BP scores for each direction of the read alignment. The branch point was identified by looking within ±2 nucleotides of the end of the read alignment for the best scoring BP. This allows for small deletions and insertions (a common property of reverse transcription across branchpoints). Split reads that make use of the same 5′SS and BP were aggregated together and considered to come from the same lariat. The associated 3′SS was determined to be the first AG dinucleotide found at least 5 nucleotides downstream of the BP.
Aggregation of introns
Overlapping split reads were aggregated by strand and by overlapping genomic coordinates. Annotated 5′SS and 3′SS were determined by the POMBASE Schizosaccharomyces_pombe.ASM294v2.21.gff3 file. Alternate sites were defined as any site that did not correspond to either the 5′SS or 3′SS of an annotated intron. Split reads that overlap annotated introns with both splice sites corresponding to a non-annotated location were not further considered. Alternate 5′SS within 5 nt of an annotated 5′SS are prone to mismapping and as an aggregate were ignored as a parsimonious approach to identifying unannotated splicing events. Novel introns were defined as split reads that do not overlap a known intron on the same strand. Exon skipping events were defined as split reads that overlap two introns in the same transcript. Annotated, alternate, and novel introns were required to have at least one read with a minimum of 30 nucleotides of total aligned sequence.
Alternate intron identification
Branches overlapping a single intron were aggregated. For each branch the first AG dinucleotide at least five nucleotides downstream of the intron was called as the 3′SS. For the RNAseq alternate introns, utilization was measured as alternate counts divided by the sum of alternate and annotated counts. When indicated, likelihood of alternate introns were computed with a binomial distribution created from the number of total reads alternate and annotated reads and an error rate being tested in the range 10−1 to 10−6.
RNAseq
RNAseq was done using TruSeq RNA Kit v2 or NEBNext Ultra Directional Kit. RNAseq alignments were done using Tophat suite version 2.0.9 with Schizosaccharomyces_pombe.ASM294v2.21.gff3 and with novel intron discovery. For novel introns, only GT-AG novel exon-exon junctions were further processed. Novel introns found to overlap a single annotated intron were aggregated. Reads for novel intron RNAseq junctions were required to have mapq scores of at least 30. Expression quartiles were computed for transcripts using RNAseq for the indicated RNAseq library by using the exon-exon junction counts from Tophat.
Comparative analyses
MAF format MultiZ alignments(19) from 01/04/2012 were acquired from the Broad Institute website and used to retrieve aligned sequences for computing log-odds scores. Log-odds scores for 5′SSs and BPs were computed, when possible, for each of the Schizosaccharomyces species considered. To calculate a background rate of sequence conservation, putative upstream 5′SS and downstream BP sequences were identified from the coding sequences of intronless genes in S. pombe. From these sequences, a large number of putative splice sites were initially chosen, the total number representing a ∼10-fold increase over the number of identified alternative sites. For each of these sites, the PWM score was determined for the S. pombe sequence, after which time a subset of these sites was selected that had a similar score distribution to the identified alternative sites. For this subset of sites, the PWM was then determined for the orthologous sequence in each of the Schizosaccharomyces species, and this score was assessed for conservation. A similar approach was used to determine background rates for the downstream 5′SS and upstream BPs, but using sequences found in S. pombe 3′ UTRs that are shorter than 150nt as the source for the background distribution.
qPCR of lariat introns
Intron qPCR measurements were made for two different introns from each of four different multi-intronic genes using RNA isolated from a Δdbr1 strain. Standard dilution curves using genomic DNA were generated for each primer pair, allowing for comparison of the relative levels of each RNA.
Weblogos
Web logos were generated using a command line version 3.4 (20).
Accession codes
All sequencing data have been submitted at NCBI's Gene Expression Omnibus (GEO) repository with accession number GSE68345.
RESULTS
Global S. pombe splicing profiles revealed by intron lariat-sequencing
To capture the global splicing profile of S. pombe, we used two-dimension gels (Figure 1A) to isolate intron lariats from a Δdbr1 strain grown under several growth conditions (see Materials and Methods). Building upon our previous work (13), experimental conditions were optimized to recover both long and short introns. Purified lariat RNAs were converted, without debranching, into cDNA and sequenced on an Illumina HiSeq 2000, generating over 231 million sequencing reads. Alignment of these reads to the S. pombe genome revealed that ∼60% of genome-matching reads mapped to annotated introns (Figure 1B and Supplementary Table S1) with only a minority of reads mapping to exons, confirming the high level of lariat enrichment afforded by this approach.
Figure 1.
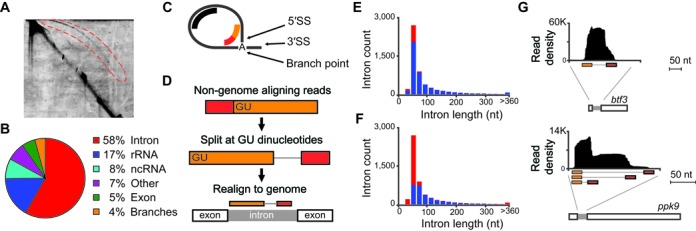
Intron lariat sequencing defines splicing patterns. (A) Image of two-dimensional gel electrophoresis of RNA isolated from Δdbr1 S. pombe. Intron lariats (red-bounded region) were isolated and used as source material for sequencing. (B) Pie-chart summarizing allocation of lariat sequencing reads to indicated genomic regions. (C) Illustration of intron lariat and splice sites, depicting intron-mapping reads (in black) and branch-spanning reads (in red-orange). (D) Schematic of alignment strategy for candidate branch-spanning reads, together with illustration of aligned branch-spanning read. (E) Histogram of annotated introns counts (y-axis) separated by length (x-axis, 20 nucleotide bins), indicating introns recovered with intron-mapping reads (blue) and those not recovered (red). (F) Histogram of annotated introns counts (y-axis) separated by length (x-axis, 20 nucleotide bins), indicating introns precisely recovered with branch-spanning reads (blue) and those not recovered (red). (G) Intron-mapping reads (y-axis indicates read density) aligning (x-axis indicates alignment position) to indicated S. pombe pre-mRNAs, together with branch-spanning reads (orange-red) aligned with split-read mapping strategy. The btf3 peak density truncated at +/-50 nt of intron boundaries. The ppk9 peak tapers just upstream of intron boundaries.
As we and others have previously noted (13,18,21,22), sequencing of lariat introns generates two distinct types of reads: one derived from the body of the intron, and the other derived from reverse transcription across the lariat branch (Figure 1C). Branch-spanning reads contain both the 5′SS and BP sequence within the lariat, and are thus diagnostic of a splicing event, somewhat analogous to exon-exon spanning reads within RNAseq data. While these reads are information rich, their identification is non-trivial because of both their inverted nature and the poor efficiency and reduced fidelity of reverse transcription across this junction (18). To systematically identify these reads in our dataset, we developed an alignment pipeline whereby all reads that failed to directly map to the genome were divided at each GU dinucleotide, corresponding to possible 5′SSs, and the pairs of divided reads were re-assessed for alignment to the genome using a split-read mapping strategy (Figure 1D). A total of 3.7 million such reads were identified by this approach with a low false discovery rate (see Materials and Methods, and Supplementary Table S2), making this by far the largest dataset of experimentally identified branch sites to date.
Importantly, the data generated from both the body-mapping and branch-spanning reads successfully identified the majority of known S. pombe introns. Over 85% of annotated introns had reads mapped to the body of the intron (Figure 1E and Supplementary Table S3), while ∼55% had branch-spanning reads that recover both the annotated 5′SS and predicted BP (Figure 1F and Supplementary Table S3). As we and others have previously seen, short intron lariats were particularly difficult to recover in these experiments (13,21). Nevertheless, because branch-reads contain the coupled information of both the 5′SS and BP sequence used to form the lariat, alternative splicing events that would be difficult to reliably predict from body-mapping reads can be definitively assigned by branch-reads. For example, whereas the peak of body-mapping reads for the btf3 transcript (Figure 1G, top) suggested a discreet 5′SS and BP, the spectrum for the ppk9 transcript (Figure 1G, bottom) suggested possible alternative splice sites. The use of branch-spanning reads readily resolved these different patterns by identifying a single 5′SS/BP combination for btf3, but three distinct combinations for ppk9. Because of the precision with which branch-reads define splicing events, we relied exclusively upon them for further analysis.
Lariat sequencing identifies widespread examples of alternative splicing
To characterize identified splice sites, a position weight matrix (PWM) scoring metric (6) was implemented (see Materials and Methods), based upon the ∼5,000 splice sites annotated on PomBase (23). Previous computational analyses had predicted the likely BP for >90% of annotated S. pombe introns; these sites were used as the basis of our PWM scoring for BPs. For the small number of introns for which multiple BPs were predicted, we considered the BP closest to the annotated 3′SS to be the primary BP, and used it for our analysis. As expected, our analysis of the set of annotated introns showed a wide range of scores for both the 5′SS and BP sequences, reflecting the degeneracy of splice site sequences in S. pombe (Figure 2A) (11). Interestingly, while the scores of the 5′SSs recovered by lariat sequencing closely match the distribution of all annotated scores, the recovered BPs included many more low scoring sequences. Remarkably, nearly 900 of the annotated introns recovered here revealed activation of multiple BPs, each of which was predicted to use the annotated 3′SS. Importantly, while this estimate represents the lower limit of the frequency of alternate BP activation because of the size limitations described previously, it is nevertheless significantly higher than a previous study indicated (21). When considering the scores of the primary BPs we identified, defined as the closest BP upstream of the annotated 3′SS, there was little difference between those annotated introns for which only a single BP was identified and those with multiple branches (Figure 2B), suggesting that alternative BP selection is not driven simply by the strength of the primary BP. Not surprisingly, however, quality scores of alternative BPs tended to be weaker than those of primary branch sites (Figure 2B). Nevertheless, many annotated introns contain alternative BP sequences with scores comparable to those of the presumed primary branch sites; representative examples are shown for the spf47 intron 1 (Figure 2B) for which the identified alternative and presumed primary branch points both have scores near the middle of their respective distributions.
Figure 2.
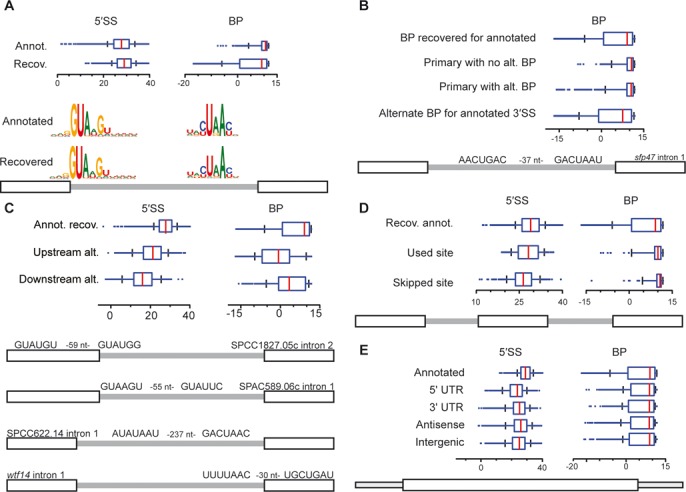
Global analysis of alternative and novel splice sites in S. pombe. (A–E) Distribution of splice-site strengths as boxplots (x-axis indicates PWM scores), together with examples of alternative site sequences. (A) Splice site scores (5′SS and BP) corresponding to annotated introns (annot.), and sites corresponding to annotated introns recovered with branch-spanning reads (recov.) (B) BP scores for indicated categories of alternative splicing events associated with alternative BPs that are paired with annotated 3′SSs. (C) Splice site scores (5′SS and BP) corresponding to alternative splice site scores partitioned into upstream and downstream alternative intron boundary sites, compared to annotated and recovered sites (annot. recov.). (D) Splice site scores (5′SS and BP) corresponding to splice site scores associated with exon-skipping events partitioned into sites participating in exon-skipping (used site) and those skipped (skipped site), compared to annotated and recovered sites (annot. recov.). (E) Splice site scores (5′SS and BP) corresponding to sites found in novel introns in indicated genomic regions, compared to annotated and recovered sites (annot. recov.).
Whereas the alternative branch points noted above are not predicted to change intron-exon boundaries, an additional 2,923 alternative splicing events (associated with 1851 annotated introns) were identified that utilize one annotated site and one alternate site and are predicted to change the coding character of the resulting mRNA. Remarkably, these alternative splicing events implicate at least half of all annotated introns as subject to alternative splicing. Included among these were 1031 events (corresponding to 858 annotated introns) where an alternative 5′SS is spliced to the canonical BP, and 1892 events (corresponding to 1276 annotated introns) where the canonical 5′SS is spliced to an alternative BP/3′SS; akin to mammalian alternative splicing. Interestingly, for both 5′SSs and BPs, alternative sites upstream of the canonical site were identified at nearly twice the frequency as they were downstream (Supplementary Table S4), consistent with a ‘first come, first served’ model of splice site selection (24).
Many of the alternative splice sites described above had sequence scores similar to those of annotated introns, however, we observed a clear relationship between the quality of the splice sites and their position relative to the annotated sites. For 5′SSs, alternative sites identified upstream of the annotated site had a distribution of scores that, while weaker, substantially overlapped those of the annotated sites (Figure 2C). In contrast, the distribution of scores corresponding to alternative downstream 5′SSs were significantly weaker than those of both the annotated and upstream 5′SS (Figure 2C). The pattern for alternate BPs was inverted: activated downstream sites had scores more similar to canonical BPs while those found upstream tended to be lower in strength (Figure 2C). Representative examples of these types of alternative splicing are shown (Figure 2C) where both the alternative and canonical events have scores near the middle of their respective distributions.
Having identified alternative 5′SSs upstream of nearly 15% of annotated introns, we wondered whether the failure to identify alternative sites for the remaining 85% of introns reflected the absence of an effective alternative splice site or the failure to utilize such sites. To address this question, we examined a 150 nucleotide window upstream of every annotated intron and identified the highest scoring potential 5′SS. Many annotated introns are flanked by upstream sequences that contain high scoring candidate-alternative 5′SSs but for which we detected no alternative splicing (Supplementary Figure S1). Perhaps deeper sequencing might reveal usage of these potential sites; alternatively, additional sequence elements or secondary structures may be functioning to preclude alternative splicing at these locations (25,26).
Previous studies identified exon skipping in S. pombe; although relatively few such examples were discovered in earlier experiments (13,21), more recent work identified over 100 high-confidence events (27). Here, we found hundreds of additional exon skipping events, expanding the repertoire of confirmed exon skipping events in S. pombe (Supplementary Table S5). Analyses of the splice site sequences associated with the events identified here (Figure 2D) revealed that the 5′SS of the upstream intron and the BP sequence of the downstream intron had sequences that were nearly indistinguishable from the composite scores of annotated introns. Remarkably, however, the skipped BPs of the upstream introns were not characterized by low information sequences, but rather appeared to have slightly stronger scores in aggregate than annotated introns, inconsistent with expectations of intron-definition based models of exon skipping. By contrast, the skipped 5′SS of the downstream introns had significantly weaker splice site scores than annotated introns. This increased propensity of exon skipping events to be associated with weak downstream 5′SSs, together with the absence of weak BP sequences, implies that spliceosome assembly via exon definition may be a more prominent aspect of splicing in S. pombe than previously appreciated (28).
In addition to alternative splicing associated with annotated introns, our data also revealed an unprecedented level of splicing across the transcriptome at sites with no characterized introns. A total of 8113 splicing events were identified associated with 7412 novel introns (Supplementary Table S6). These introns were located within the transcripts of protein-coding genes (including 857 within annotated 5′UTRs, 971 within annotated 3′UTRs, and 1567 within the coding regions of these transcripts), within anti-sense RNAs (2699), within non-coding RNAs (554), and within intergenic regions of the genome (1343). Remarkably, while the overall distribution of 5′SSs scores for these novel introns was noticeably lower than those associated with annotated introns, the majority of these novel events had 5′SSs sequences with strong PWM scores (Figure 2E). Similarly, the distribution of BP scores for novel introns was virtually indistinguishable from those found in annotated introns (Figure 2E). Importantly, although many novel events are recovered with low read counts, the splice-site score distributions are similar across high and low read counts (Supplementary Figure S2).
RNAseq validates widespread alternative splicing
Having identified widespread examples of alternative splicing via lariat sequencing, we turned to RNA sequencing as an orthogonal approach for validation. Datasets of poly(A)+ RNA were generated for both wild-type and Δdbr1 strains (Supplementary Table S7). Importantly, although loss of Dbr1 perturbed transcript levels of a small subset of genes, the overall transcriptomes of wild-type and Δdbr1 strains as determined by RNAseq were extremely similar (Pearson correlation coefficient of 0.993, P < 2.2 × 10⁻¹⁶; Supplementary Figure S3). We used TopHat2 to identify transcripts harboring alternative 5′SSs (29), and then examined the extent to which these alternative 5′SSs overlapped with those identified by lariat sequencing. Approximately 40% of alternative 5′SSs identified by lariat sequencing were detectable by RNAseq, and ∼25% of alternative 5′SSs identified by RNAseq were detected by lariat sequencing (Figure 3A and Supplementary Table S4), demonstrating that the two approaches provide complementary but not identical descriptions of the transcriptome. Importantly, the average quality of alternative 5′SSs, as judged using PWM scoring, was nearly identical when comparing alternative sites defined uniquely by lariat sequencing or RNAseq, whereas those sites identified by both methods generally corresponded to slightly stronger sites (Figure 3B). Because lariat sequencing directly identifies BPs but not 3′SS, and RNAseq identifies the inverse, to enable comparison of these datasets the first AG dinucleotide downstream of the BP identified by lariat sequencing was assumed to be the 3′SS. Using this approach, similar overlaps were also observed in the alternative BPs/3′SSs identified by lariat sequencing and RNAseq (Supplementary Figure S4).
Figure 3.
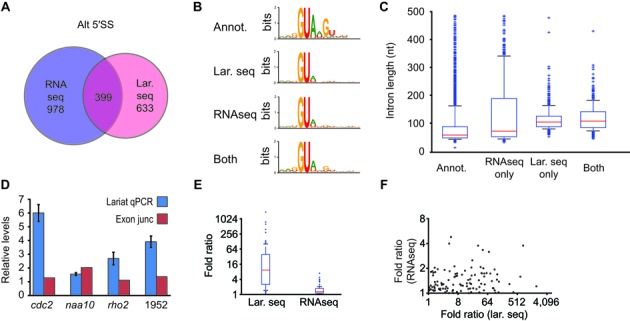
Cross validation and comparisons of alternative splicing detected using RNAseq and lariat sequencing. (A) Venn diagram illustrating alternative 5′SSs identified by RNAseq, lariat sequencing, or both. (B) Web-logo comparisons of annotated 5′SSs compared to those identified by RNAseq, lariat sequencing, or both. (C) Intron length comparisons of annotated introns compared to those identified by RNAseq, lariat sequencing, or both. (D) qRT-PCR measurements of relative lariat levels compared for pairs of lariats from two-intron genes (blue), compared to RNAseq determinations of exon-exon junction reads for the corresponding splice junctions (SPAC1952.04c labeled as 1952). (E) Boxplots indicating distributions of fold ratios (y-axis) of branch-spanning read counts for pairs of introns from multi-intron genes, compared to ratios of exon-exon spanning read counts for splice junctions from multi-intronic genes with comparably sized intron lengths. (F) Scatter-plot of values shown in (e), relating RNAseq-derived ratios (y-axis) to lariat sequencing-derived ratios (x-axis) for genes whose introns are of comparable size.
Multiple sources, both biological and technical, almost certainly contributed to the imperfect overlap between RNAseq and lariat sequencing-based definitions of the transcriptome. A major biological difference derives from the species sequenced: lariats versus mature transcript. This difference is likely to be particularly important for alternative products whose structures result in accelerated decay, leaving them poorly detected by RNAseq. Alternatively, because of the length bias of lariat sequencing, RNAseq is better positioned to capture very short or very long introns, as confirmed in Figure 3C. While investigating this length bias, however, we found an additional, and somewhat surprising, result: the levels of lariats derived from different introns of a common pre-mRNA were detected to markedly different degrees in our data, and this difference was maintained even when looking at intron pairs that were of the same general size in genes with multiple introns. Importantly, we confirmed this result using qRT-PCR on four transcripts (Figure 3D) by comparing two introns within each transcript. For each mRNA tested, RNAseq indicated that signal derived from the different exon-exon boundaries were narrowly distributed, as expected. In contrast, qRT-PCR measurements indicated that lariat introns derived from the same pre-mRNA were present at greatly different levels (Figure 3D). This result was confirmed genome-wide, using exon-exon spanning reads found in RNAseq and branch-spanning reads from lariat sequencing (Figure 3E and F). The biological basis for this result is unclear, but likely indicates variable decay rates for lariats in the absence of Dbr1. Importantly, while this result complicates quantitative comparisons for individual species detected using branch-spanning reads, genome-wide comparisons are less likely to be compromised.
In addition to evidence of extensive alternative splicing in S. pombe, our lariat sequencing data also revealed many thousands of novel introns (Figure 2E). As before, we wished to validate and compare novel introns found with lariat sequencing to those present in RNAseq. Similar to our previous findings, approximately 15% of novel introns found by lariat sequencing are also found within RNAseq, whereas ∼20% of novel introns detected by RNAseq are also found within lariat sequencing (Figure 4A and Supplementary Table S8). Importantly, the strengths of 5′SSs and BPs detected by both approaches were highly similar (Figure 4B and 4C, respectively), and the lengths of the novel introns recovered by the two approaches are consistent with the previously discussed length biases (Figure 4D). Taken together, these results imply the existence of many thousands of additional introns in S. pombe not found by either result.
Figure 4.
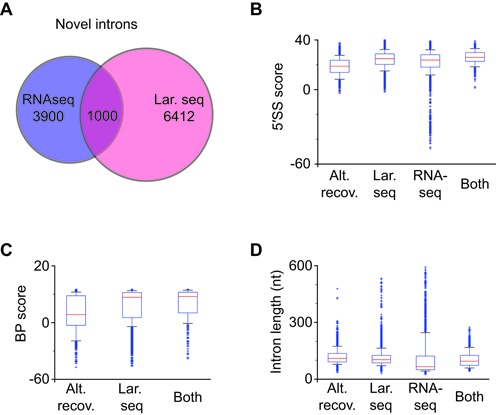
Cross validation and comparisons of novel introns detected using RNAseq and lariat sequencing. (A) Venn diagram illustrating novel introns identified by RNAseq, lariat sequencing, or both. (B) Boxplot distributions of 5′SS strength (y-axis) for 5′SSs corresponding to alternative sites recovered using lariat sequencing (alt. recov.) for annotated introns, or for novel introns identified using: lariat sequencing (lar. seq); RNAseq; or both. (C) Boxplot distributions of BP sequence strength (y-axis) for categories indicated in (B). (D) Boxplot distributions of intron length (y-axis) for categories indicated in (B).
During final preparation of our work, an analysis of publicly available RNAseq datasets from a variety of S. pombe growth conditions and mutants were examined for unannotated splicing events (27). As with the analysis of our own RNAseq data, we sought to compare the novel splicing events identified by lariat sequencing with those identified in this new study. Remarkably, even though nearly 4 billion reads of RNAseq data were analyzed, comparison of these published data with our lariat sequencing generated a similar result: significant overlap of the novel splicing events was identified between the datasets, with each approach further identifying unique subsets of events. For example, of the 2923 alternative 5′SSs and 3′SSs associated with known introns identified that were identified by lariat sequencing, only ∼15% were identified in the published RNAseq data (Supplementary Table S5). By contrast, 2472 events were uniquely identified by lariat sequencing and 1207 events were uniquely identified in the published RNAseq data. Importantly, as before, the majority of the events that went undetected by lariat sequencing were expected to generate lariats of sizes not readily recovered in our experiment. Similar patterns were observed when comparing exon skipping events, and novel introns (Supplementary Tables S4 and S8). Together, these results reinforce the idea that there are many additional locations within the S. pombe genome that are acted upon by the spliceosome but have not yet been identified by either method.
Estimating the frequency of alternative splicing
Having identified thousands of locations of alternative splicing, we next sought to characterize the frequency of these events. As a simple gauge of the extent of alternative splicing, we determined the total number of alternative splice site reads for every annotated intron relative to the sum of all annotated and alternate reads (from Supplementary Table S4). Remarkably, this yielded an alternative rate of 2.8% (Figure 5A), far higher than comparable values estimated from exon-exon spanning reads in most RNAseq-based studies (Figure 5A and references (19,27)), and moderately higher than values calculated in the background of nuclear decay mutants (27). Importantly, when the alternative splicing percentages were recalculated considering only those alternative splicing events for which the canonical lariat was within the optimal size range for lariat sequencing, and separately only those for which both the alternative and canonical lariats were within the optimal range, estimated alternative rates were determined to be 1.6% and 2.2%, respectively, still well in excess of estimates derived from our RNAseq data (Figure 5A).
Figure 5.
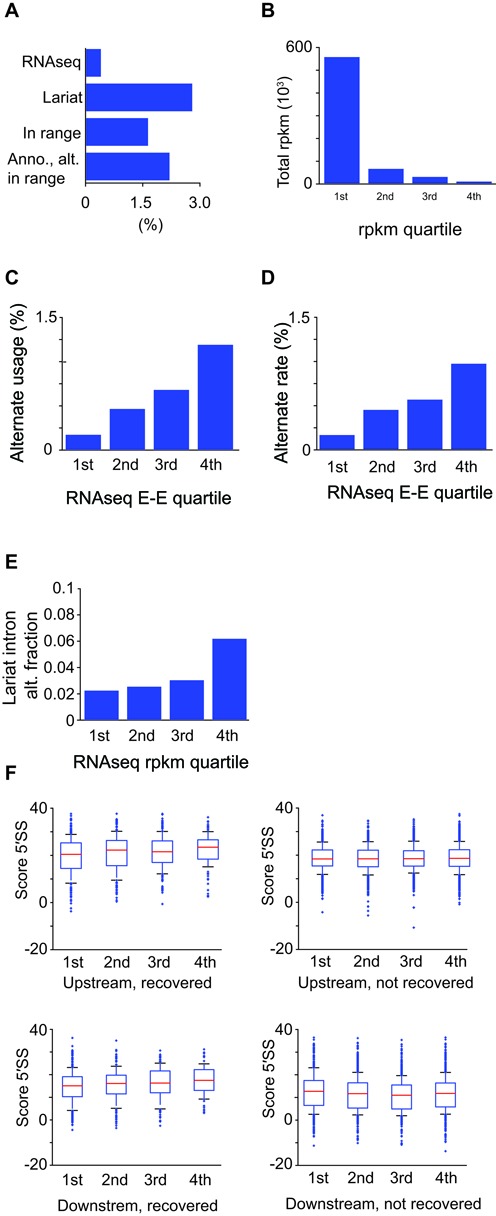
Extent of alternative splicing in S. pombe. (A) Percentage of reads corresponding to alternative splice products detected by RNAseq or lariat sequencing (lar. seq), and in lariat sequencing restricting the analysis to introns for which the annotated intron has a size optimal for detection by lariat sequencing (lar. seq opt. size; 70–150 nucleotides). (B) total RNAseq RPKM values (y axis) for intron containing transcripts separated into expression quartiles (x axis). (C) Percentage of reads corresponding to alternative splice products detected by RNAseq (y axis), shown by expression quartiles (x axis). (D) Inferred rate of alternative splicing, modeled using RNAseq data, shown by expression quartiles (x axis). (E) Percentage of reads corresponding to alternative splice products detected by lariat sequencing, shown by expression quartiles (x axis). (F) Boxplot distributions of 5′SS strength (y-axis) for upstream and downstream alternative 5′SSs for each expression quartile (x-axis; recovered), and for best-scoring upstream and downstream candidate sites whose usage was not observed (not recovered).
Although the overall rate of alternative splicing detected in our RNAseq data was significantly lower than what was measured by lariat sequencing, we noted in our data that a broad range of error rates were measured among the different transcripts. In particular, alternative splicing rates were relatively low for highly expressed genes, but more pronounced for those with low expression. Therefore, to account for any relationship between gene expression and fidelity of splicing, intron containing genes were separated into expression quartiles as determined by host-transcript RPKM values (Figure 5B). The proportion of exon-exon spanning reads in the RNAseq data that corresponded to alternative products was then separately recalculated for each of the four expression quartiles (Figure 5C). In addition, a maximum-likelihood based approach was used to estimate an alternative splicing rate within each quartile of genes (Figure 5D). Importantly, this strategy excluded from our analysis all genes for which we detected high proportions of alternative splice products, as determined by a likelihood scoring approach, reasoning that such events are more likely to correspond to bona fide alternative splicing rather than errors in splicing. Together, both of these approaches showed that highly expressed genes were spliced with extremely high fidelity, whereas the fidelity of splicing decreases as expression quartiles decrease, a result that is robust to different likelihood threshold calculations (Supplementary Figure S5). Importantly, the association of decreased fidelity of splicing with more lowly expressed genes is also observed when calculated using the percentage of alternative branch-spanning reads detected in lariat sequencing (Figure 5E), although the extent of alternative splicing detected using lariat sequencing far exceeded that detected with RNAseq, a result consistent with lariat sequencing possessing enhanced sensitivity to detect alternative isoforms subject to rapid decay. It is worth noting that no striking differences are apparent between the quartiles when comparing the scores of upstream or downstream alternative 5′SSs (Figure 5F). Moreover, the top-scoring potential alternative 5′SSs within introns for which we observed no alternative splicing were comparable to the alternative sites used (Figure 5F).
Given the large number of novel introns identified by both lariat sequencing and RNAseq, we determined their percent spliced index (PSI) (30), based upon our RNAseq data, in an effort to characterize whether these events reflected: bona fide introns whose annotations are incomplete, regulated splicing events with low PSI under standard growth conditions, or low-frequency events likely to represent splicing noise. For each novel intron, the RNAseq data were examined to identify reads spanning exon–exon or exon–intron boundaries, reflecting the spliced and unspliced isoforms, respectively. Interestingly, 93 of these introns showed a PSI of over 80%, consistent with the behavior of bona fide, canonical introns. These introns were distributed between coding and non-coding, sense and anti-sense transcripts, and argue for modifications of their genome annotations (Supplementary Table S8). Similarly, an additional 523 introns showed a PSI between 20% and 80%. While these PSI values were lower than expected for a canonical intron, they suggest the possibility that these are conditionally regulated splicing events. For the vast majority of the novel introns identified, PSI was below 20%. Although it is difficult to discern the functional significance of any given isoform simply on the basis of its PSI, we chose to refer to these low frequency events as ‘aberrant’.
The majority of alternative splicing events in S. pombe are not conserved in closely related species
To gain additional perspective on the potential functional relevance of alternative splicing in S. pombe, we investigated the extent to which alternative splice sites are significantly evolutionarily conserved. The PWM scores calculated for splice sites in S. pombe were compared with scores for the orthologous positions in three related Schizosaccharomyces species: S. octosporus, S. cryophilus and S. japonicus (Figure 6A) (19). As expected, annotated 5′SSs and BPs in S. pombe overwhelmingly maintain their splice site identity in related species (Figure 6B and 6C, respectively). In contrast, a comparison of the alternative sites identified by lariat sequencing in S. pombe showed that a large fraction (68–89%, depending on the species compared) of 5′SSs in the related species have no potential to function as splice sites (Figure 6D and Supplementary Figure S6). There are, however, many sites whose sequences in related species closely match consensus 5′SSs used as alternative splice sites in S. pombe (Figure 6E and 6F, for upstream and downstream alternative 5′SSs, respectively).
Figure 6.
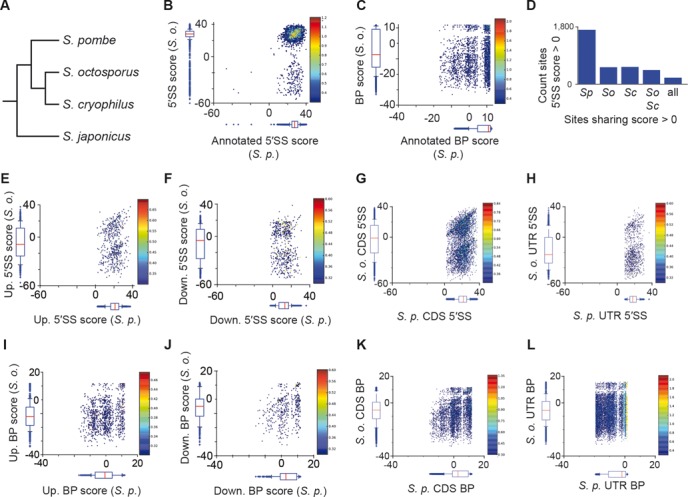
Comparative analyses of S. pombe splice sites. (A) Cladogram illustrating Schizosaccharomyces species included in subsequent analyses. (B) Heat map and boxplots indicating relationship and distributions of annotated 5′SSs in S. pombe (x-axis) and S. octosporus (y-axis). (C) Recovered annotated intron BP sequences, plotted as in (B). (D) Counts of alternative 5′SSs in S. pombe exceeding a score of zero, together with counts for sites conserved in indicated species. (E–H) Comparison of 5'SS between S. pombe and S. octosporus for: alternate upstream 5′SSs (E), alternate downstream 5'SS (F), control upstream 5′SSs (G) and control downstream 5'SSs (H); plotted as in (B). (I–L) Comparison of BPs between S. pombe and S. octosporus for: alternate upstream BPs (I), alternate downstream BPs (J), control upstream BPs (K) and control downstream BPs (L); plotted as in (B).
To determine the background level of conservation that exists independent of possible functions as 5′ splice sites, a similar analysis was performed on theoretical 5′SSs we found within coding sequences from genes for which no evidence of splicing exists, and separately, from noncoding sequence within 3′ untranslated regions (UTR). We reasoned that the level of conservation we detected from such theoretical 5′SSs would be a suitable background estimate for the extent of conservation we detected for real sites, and thus enable us to estimate the number of sequences selectively maintained to function as splice sites. This approach suggested that a small minority of alternate 5′SSs, both upstream and downstream, were selectively maintained above our background estimate (Figure 6G and H; see Supplementary Table S9 for quantification), with up to ∼10% of alternate sites potentially the result of conservation, presumably corresponding to biologically meaningful occurrences of alternative splicing. In contrast, potential conservation of orthologous alternate BPs more strongly resembled the background distribution (Figure 6I, J and Supplementary Table S9). The apparent lack of conservation might be complicated by the dilution of conservation signal due to the propensity for a given 3′SS to utilize one of several possible BPs. Regardless, the lack of strong orthologous splicing signals suggested that most alternative BP usage results from aberrant splicing.
Aberrant splicing in S. pombe
Our discovery of widespread alternative splicing in S. pombe, very little of which exhibited evidence of conservation, suggested to us that the majority of the observed alternative events represented aberrant splice site usage. At a high frequency, the alternative splicing events identified by lariat sequencing generated transcripts with expected reductions in overall stability. A total of 1661 of these alternate splicing events generated a frameshift of the resulting mRNA; an additional 376 events maintained coding frame but introduced premature stop codons in the mRNA. By contrast, only 559 of the alternative splicing events neither changed the reading frame nor introduced premature stop codons.
To better assess the stability of the aberrant splicing events we identified, additional RNAseq data were generated from a strain deficient for upf1, an essential component of the nonsense-mediated mRNA decay (NMD) pathway that selectively degrades erroneous transcripts (Supplementary Table S7). To determine whether alternative isoforms were stabilized in this strain, we carefully examined a subset of transcripts that satisfied three criteria: the same alternative event was identified in both datasets, the expression level of the host transcript varied by less than 25% between datasets, and the total number of alternative reads in the Δupf1 dataset exceeded a threshold of 10 counts. As expected, when considering only those events that satisfied these criteria, the average alternate usage rate increased by over 50%, consistent with destabilization of these isoforms in wild type cells.
We considered it likely that the frequency at which an aberrant site was activated would be related to its strength as an alternative splice site. Somewhat surprisingly, however, only a weak correlation was observed between upstream alternative 5′SS scores and their usage in the wild type RNAseq dataset (Pearson correlation coefficient of 0.12, p = 0.04; Figure 7A). A weak but more significant correlation was also seen for downstream alternative 5′SSs (ρ = 0.16; P = 0.01). By contrast, in the Δupf1 dataset the rate of utilization of both upstream and downstream alternative 5′SSs were more significantly, albeit still weakly, associated with the strength of alternative sites (ρ = 0.22, P = 5 × 10⁻⁴, and ρ = 0.23, P = 5 × 10⁻⁵, respectively). We also explored whether utilization rate of alternative sites, in RNAseq data from either wild-type or upf1-deficient cells, might correlate with conservation of splice sites; such analyses (Supplementary Figure S7) identified no such correlations. Taken together, these results indicate extensive utilization of a wide range of splice sites in S. pombe, with many of the resulting aberrant splice products substrates for cellular decay pathways.
Figure 7.
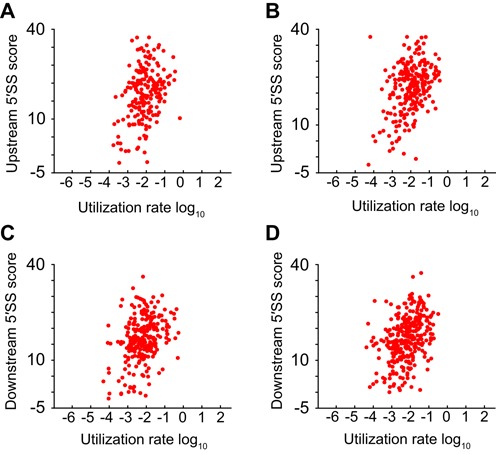
Influence of splice site strength on frequency of alternative splicing. (A–D) Scatter-plots of proportion of alternative splicing events found in RNAseq data (x-axis) plotted against predicted strength of alternative 5′SS (y-axis). Alternative events analyzed separately for upstream (A, B) and downstream alterative 5′SSs (C, D), using RNAseq from wild-type (A, C) and NMD-deficient strains (B, D).
DISCUSSION
Pre-mRNA splicing is a critical component of eukaryotic gene expression. By temporally regulating the activation of different splice sites within a transcript, the process of alternative splicing provides a powerful opportunity for organisms to expand their proteomic diversity (4). The importance of appropriate splice site selection is highlighted by the number of human diseases that are associated with mutations at or near these sites (31,32). Attempts to understand the rules that govern splice site selection have largely been driven by analysis of mRNAs present in cells, and inferences about the splice sites that were used to generate those mRNAs (33); however, a major shortcoming of this approach is its failure to detect those splicing events that lead to destabilization of the spliced product.
Here, we have used lariat sequencing to enable an understanding of splicing in S. pombe not possible with RNAseq. As a tool for elucidating the diversity of substrates acted upon by the spliceosome, the major advantage of lariat sequencing derives from directly sequencing introns, rather than sequencing mature transcripts that are subject to RNA quality control pathways. Because lariat sequencing directly identifies both the 5′SS and the BP used during the splicing reaction, the data generated here represent the largest collection of experimentally identified splice sites in an organism with degenerate splice sites, allowing an opportunity to visualize the sequence constraints of the spliceosome in a way not previously possible.
Our data reveal a remarkable level of alternative and aberrant splice site activation across the S. pombe genome, including nearly 3000 examples of alternative splice site activation surrounding annotated introns, hundreds of novel examples of exon skipping, and thousands of examples of novel introns (Figure 2). Importantly, because of the length limitations of lariat sequencing, these events underrepresent the total number of alternative and aberrant splicing events which must exist in the S. pombe genome. Together, our data suggest that rates of alternative splice site activation in S. pombe are around 3%, a value significantly higher than previous estimates (9,10,19). The difference between our lariat derived error estimates and published RNAseq estimates is particularly noteworthy given the expectation that alternative splicing in the less complex genome of S. pombe is predicted to be lower than that seen in mammals (34).
The instances of alternative 5′ and 3′SS activation identified here are remarkable not only because of the frequency with which they occur, but also because of the relative strengths of the sites that are being activated. Indeed, given the strength of many of these alternative site sequences, the more surprising finding may be that they aren't activated at higher frequency. This observation, along with the failure to identify alternative splicing at many high scoring cryptic sites, underscores the significance of context in understanding splice site strength. The identification here of both activated and silent cryptic splice sites offers a powerful opportunity to better understand the constraints that drive splice site activation. Future experiments examining the subsets of activated and silent sites should provide insights into the mechanisms by which cryptic splice sites can be activated or repressed.
Our analyses of exon skipping events also provides a surprising insight into the mechanism of spliceosome assembly in S. pombe. In higher eukaryotes, where introns can be exceptionally large and exons tend to be shorter, strong evidence exists in support of an ‘exon-definition’ model for spliceosome assembly, wherein recognition of the 5′SSs by the U1 snRNP can facilitate recognition of an upstream BP/3′SSs (35). By contrast, in lower eukaryotes like S. pombe, where introns are much shorter, assembly is thought to occur across introns, agnostic to the content of surrounding introns (28,36). In this context, our finding that exon skipping events tended to be enriched for poor scoring 5′SSs in the downstream introns was completely unexpected (Figure 2D). Interestingly, the simple model that the subset of introns identified here represent the few splicing events in S. pombe that utilize exon-definition for spliceosome assembly seems unlikely since the skipped BP sequences have scores which are largely indistinguishable from the global population. Alternatively, these results suggest the possibility that cross-exon interactions facilitate spliceosome assembly for many or all introns, including those presumed to assemble primarily by intron-definition, and that exons with weak downstream 5′SSs are more likely to exhibit exon skipping because of the decreased ability to utilize these cross-exon interactions.
Our results demonstrate that estimates of alternative splicing using RNAseq alone are likely to significantly underestimate the prevalence of alternative splicing. Splicing errors that generate aberrant transcripts will be significantly underestimated by RNAseq because they are likely to be subjected to RNA degradation pathways, including nonsense-mediated mRNA decay (NMD) and spliceosome-mediated decay (SMD) (37,38). Recent work in budding yeast, where splice sites conform to a strong consensus sequence, also revealed an unappreciated level of alternative splice site selection, much of which is masked by the NMD pathway (39). Similarly, recent work in S. pombe identified widespread alternative splicing at rates approaching those detected here in the background of nuclear decay mutants (27). Moreover, although we have associated the lariats identified here with splicing events that have completed both chemical steps, a fascinating example of biologically-relevant, first-step only splicing has been demonstrated for the TER1 transcript in S. pombe (40). As such, we cannot preclude the possibility that some of the lariats identified here are the products of reactions that have only undergone the first chemical step of the splicing pathway. Additional experiments will be necessary to fully understand the mechanisms by which these alternative splicing events are generated and subsequently linked with cellular decay pathways.
A surprising consequence of sequencing intron lariats was our discovery that lariats derived from different introns of multi-intronic genes have highly discrepant abundances, both as measured by lariat sequencing and confirmed with qRT-PCR and RNAseq. In organisms from yeast to humans, and including S. pombe, the nuclear processing of many non-coding RNAs is accomplished through endonucleolytic cleavage by RNase III homologs (Pac1 in S. pombe) (41). Recent work in budding yeast demonstrates that Rnt1, the homolog of Pac1, cleaves more targets than previously expected (38,42); it remains unknown whether Pac1 or an as yet unidentified endonuclease contributes to the degradation of lariat introns.
While our data make it clear that alternative splicing is widespread in S. pombe, from the perspective of S. pombe biology, it is less clear that these events are functionally significant. Sites that have been selectively maintained over evolutionary time likely correspond to biologically meaningful alternative splicing events, whereas sites that have diverged at a neutral evolutionary rate are more likely to correspond to errors in splicing (43,44). Our comparative analyses of alternative splice site sequences indicate that the preponderance of alternative splicing in S. pombe has not been maintained, even in closely related species. In the absence of evolutionary conservation, we conclude that the majority of the alternative splice sites we detected in S. pombe correspond either to rapidly evolving functional splicing events in S. pombe, likely true for only a very small subset of sites, or splicing errors that have arisen as a consequence of neutral genome evolution in the S. pombe lineage. Nevertheless, although the majority of the alternative events detected here likely have no physiological function in S. pombe, the widespread aberrant splicing identified here almost certainly plays an important role in genome evolution. Presumably, permissive alternative splicing, typically resulting in aberrant transcripts that are selectively degraded, provides the raw material from which advantageous events are selected during evolution. Our study suggests that the error rate intrinsic to splicing, acting upon cryptic splice sites, greatly exceeds previous estimates, perhaps facilitating more rapid acquisition of conserved alternative splicing events.
Although lariat sequencing is not readily amenable to sequencing introns from higher eukaryotes, chiefly because electrophoretic separation of large lariats is impractical, it will be important to develop variations on this approach that are suitable for intron sequencing from any species. Given the conservation of the splicing apparatus, and the overall similarity of splice site sequences between S. pombe and humans, we predict that a similar, or higher level of aberrant splice site activation will occur in humans as well. Knowledge of the locations and identities of splice sites activated in the human genome, together with the information derived here, will help in better understanding the mechanistic bases of splice site selection.
SUPPLEMENTARY DATA
Supplementary Data are available at NAR Online.
Acknowledgments
We would like to acknowledge members of the Pleiss and Grimson labs for critical input throughout the project. This work was funded by NIGMS grants GM098634 to JAP and funds provided by Cornell University to AG.
Authors Contributions: Experiments were conceived and designed by N.S., M.R., E.A.F., A.G., and J.A.P. Experiments were performed by N.S., M.R., and E.A.F. Data were analyzed by N.S., M.R., A.G., and J.A.P. The manuscript was written by N.S., A.G. and J.A.P.
FUNDING
National Institutes of Health (NIH) [GM098634]. Funding for open access charge: NIH [GM098634].
Conflict of interest statement. None declared.
REFERENCES
- 1.Lee Y., Rio D.C. Mechanisms and regulation of alternative pre-mRNA splicing. Annu. Rev. Biochem. 2015;84:291–323. doi: 10.1146/annurev-biochem-060614-034316. [DOI] [PMC free article] [PubMed] [Google Scholar]
- 2.Moore M., Query C., Sharp P. The RNA World. Vol. 1. NY: Cold Spring Harbor Laboratory Press; 1993. Splicing of precursors to messenger RNAs by the spliceosome; pp. 303–357. [Google Scholar]
- 3.Domdey H., Apostol B., Lin R.-J., Newman A., Brody E., Abelson J. Lariat structures are in vivo intermediates in yeast pre-mRNA splicing. Cell. 1984;39:611–621. doi: 10.1016/0092-8674(84)90468-9. [DOI] [PubMed] [Google Scholar]
- 4.Nilsen T.W., Graveley B.R. Expansion of the eukaryotic proteome by alternative splicing. Nature. 2010;463:457–463. doi: 10.1038/nature08909. [DOI] [PMC free article] [PubMed] [Google Scholar]
- 5.Chen M., Manley J.L. Mechanisms of alternative splicing regulation: insights from molecular and genomics approaches. Nat. Rev. Mol. Cell Biol. 2009;10:741–754. doi: 10.1038/nrm2777. [DOI] [PMC free article] [PubMed] [Google Scholar]
- 6.Lim L.P., Burge C.B. A computational analysis of sequence features involved in recognition of short introns. Proc. Natl. Acad. Sci. U.S.A. 2001;98:11193–11198. doi: 10.1073/pnas.201407298. [DOI] [PMC free article] [PubMed] [Google Scholar]
- 7.Hamid F.M., Makeyev E.V. Emerging functions of alternative splicing coupled with nonsense-mediated decay. Biochem. Soc. Trans. 2014;42:1168–1173. doi: 10.1042/BST20140066. [DOI] [PubMed] [Google Scholar]
- 8.Fox-Walsh K.L., Hertel K.J. Splice-site pairing is an intrinsically high fidelity process. Proc. Natl. Acad. Sci. U.S.A. 2009;106:1766–1771. doi: 10.1073/pnas.0813128106. [DOI] [PMC free article] [PubMed] [Google Scholar]
- 9.Melamud E., Moult J. Stochastic noise in splicing machinery. Nucleic Acids Res. 2009;37:4873–4886. doi: 10.1093/nar/gkp471. [DOI] [PMC free article] [PubMed] [Google Scholar]
- 10.Pickrell J.K., Pai A.A., Gilad Y., Pritchard J.K. Noisy splicing drives mRNA isoform diversity in human cells. PLoS Genet. 2010;6:e1001236. doi: 10.1371/journal.pgen.1001236. [DOI] [PMC free article] [PubMed] [Google Scholar]
- 11.Wood V., Gwilliam R., Rajandream M.-A., Lyne M., Lyne R., Stewart A., Sgouros J., Peat N., Hayles J., Baker S., et al. The genome sequence of Schizosaccharomyces pombe. Nature. 2002;415:871–880. doi: 10.1038/nature724. [DOI] [PubMed] [Google Scholar]
- 12.Kuhn A.N., Käufer N.F. Pre-mRNA splicing in Schizosaccharomyces pombe. Curr. Genet. 2002;42:241–251. doi: 10.1007/s00294-002-0355-2. [DOI] [PubMed] [Google Scholar]
- 13.Awan A.R., Manfredo A., Pleiss J.A. Lariat sequencing in a unicellular yeast identifies regulated alternative splicing of exons that are evolutionarily conserved with humans. Proc. Natl. Acad. Sci. U.S.A. 2013;110:12762–12767. doi: 10.1073/pnas.1218353110. [DOI] [PMC free article] [PubMed] [Google Scholar]
- 14.Gilbert W. Why genes in pieces? Nature. 1978;271:501–501. doi: 10.1038/271501a0. [DOI] [PubMed] [Google Scholar]
- 15.Forsburg S.L., Rhind N. Basic methods for fission yeast. Yeast Chichester Engl. 2006;23:173–183. doi: 10.1002/yea.1347. [DOI] [PMC free article] [PubMed] [Google Scholar]
- 16.Bolger A.M., Lohse M., Usadel B. Trimmomatic: a flexible trimmer for Illumina sequence data. Bioinforma. Oxf. Engl. 2014;30:2114–2120. doi: 10.1093/bioinformatics/btu170. [DOI] [PMC free article] [PubMed] [Google Scholar]
- 17.Langmead B., Salzberg S.L. Fast gapped-read alignment with Bowtie 2. Nat. Methods. 2012;9:357–359. doi: 10.1038/nmeth.1923. [DOI] [PMC free article] [PubMed] [Google Scholar]
- 18.Taggart A.J., DeSimone A.M., Shih J.S., Filloux M.E., Fairbrother W.G. Large-scale mapping of branchpoints in human pre-mRNA transcripts in vivo. Nat. Struct. Mol. Biol. 2012;19:719–721. doi: 10.1038/nsmb.2327. [DOI] [PMC free article] [PubMed] [Google Scholar]
- 19.Rhind N., Chen Z., Yassour M., Thompson D.A., Haas B.J., Habib N., Wapinski I., Roy S., Lin M.F., Heiman D.I., et al. Comparative functional genomics of the fission yeasts. Science. 2011;332:930–936. doi: 10.1126/science.1203357. [DOI] [PMC free article] [PubMed] [Google Scholar]
- 20.Crooks G.E., Hon G., Chandonia J.-M., Brenner S.E. WebLogo: a sequence logo generator. Genome Res. 2004;14:1188–1190. doi: 10.1101/gr.849004. [DOI] [PMC free article] [PubMed] [Google Scholar]
- 21.Bitton D.A., Rallis C., Jeffares D.C., Smith G.C., Chen Y.Y.C., Codlin S., Marguerat S., Bähler J. LaSSO, a strategy for genome-wide mapping of intronic lariats and branch points using RNA-seq. Genome Res. 2014;24:1169–1179. doi: 10.1101/gr.166819.113. [DOI] [PMC free article] [PubMed] [Google Scholar]
- 22.Mercer T.R., Clark M.B., Andersen S.B., Brunck M.E., Haerty W., Crawford J., Taft R.J., Nielsen L.K., Dinger M.E., Mattick J.S. Genome-wide discovery of human splicing branchpoints. Genome Res. 2015;25:290–303. doi: 10.1101/gr.182899.114. [DOI] [PMC free article] [PubMed] [Google Scholar]
- 23.Wood V., Harris M.A., McDowall M.D., Rutherford K., Vaughan B.W., Staines D.M., Aslett M., Lock A., Bähler J., Kersey P.J., et al. PomBase: a comprehensive online resource for fission yeast. Nucleic Acids Res. 2012;40:D695–D699. doi: 10.1093/nar/gkr853. [DOI] [PMC free article] [PubMed] [Google Scholar]
- 24.Aebi M., Weissman C. Precision and orderliness in splicing. Trends Genet. 1987;3:102–107. [Google Scholar]
- 25.Webb C.J., Romfo C.M., van Heeckeren W.J., Wise J.A. Exonic splicing enhancers in fission yeast: functional conservation demonstrates an early evolutionary origin. Genes Dev. 2005;19:242–254. doi: 10.1101/gad.1265905. [DOI] [PMC free article] [PubMed] [Google Scholar]
- 26.Pérez-Valle J., Vilardell J. Intronic features that determine the selection of the 3′ splice site. Wiley Interdiscip. Rev. RNA. 2012;3:707–717. doi: 10.1002/wrna.1131. [DOI] [PubMed] [Google Scholar]
- 27.Bitton D.A., Atkinson S.R., Rallis C., Smith G.C., Ellis D.A., Chen Y.Y.C., Malecki M., Codlin S., Lemay J.-F., Cotobal C., et al. Widespread exon skipping triggers degradation by nuclear RNA surveillance in fission yeast. Genome Res. 2015 doi: 10.1101/gr.185371.114. doi:10.1101/gr.185371.114. [DOI] [PMC free article] [PubMed] [Google Scholar]
- 28.Romfo C.M., Alvarez C.J., van Heeckeren W.J., Webb C.J., Wise J.A. Evidence for Splice Site Pairing via Intron Definition in Schizosaccharomyces pombe. Mol. Cell. Biol. 2000;20:7955–7970. doi: 10.1128/mcb.20.21.7955-7970.2000. [DOI] [PMC free article] [PubMed] [Google Scholar]
- 29.Kim D., Pertea G., Trapnell C., Pimentel H., Kelley R., Salzberg S.L. TopHat2: accurate alignment of transcriptomes in the presence of insertions, deletions and gene fusions. Genome Biol. 2013;14:R36. doi: 10.1186/gb-2013-14-4-r36. [DOI] [PMC free article] [PubMed] [Google Scholar]
- 30.Venables J.P., Klinck R., Bramard A., Inkel L., Dufresne-Martin G., Koh C., Gervais-Bird J., Lapointe E., Froehlich U., Durand M., et al. Identification of Alternative Splicing Markers for Breast Cancer. Cancer Res. 2008;68:9525–9531. doi: 10.1158/0008-5472.CAN-08-1769. [DOI] [PubMed] [Google Scholar]
- 31.Cooper T.A., Wan L., Dreyfuss G. RNA and disease. Cell. 2009;136:777–793. doi: 10.1016/j.cell.2009.02.011. [DOI] [PMC free article] [PubMed] [Google Scholar]
- 32.Xiong H.Y., Alipanahi B., Lee L.J., Bretschneider H., Merico D., Yuen R.K.C., Hua Y., Gueroussov S., Najafabadi H.S., Hughes T.R., et al. RNA splicing. The human splicing code reveals new insights into the genetic determinants of disease. Science. 2015;347:1254806. doi: 10.1126/science.1254806. [DOI] [PMC free article] [PubMed] [Google Scholar]
- 33.Wang Z., Burge C.B. Splicing regulation: from a parts list of regulatory elements to an integrated splicing code. RNA N. Y. N. 2008;14:802–813. doi: 10.1261/rna.876308. [DOI] [PMC free article] [PubMed] [Google Scholar]
- 34.Kim E., Magen A., Ast G. Different levels of alternative splicing among eukaryotes. Nucleic Acids Res. 2007;35:125–131. doi: 10.1093/nar/gkl924. [DOI] [PMC free article] [PubMed] [Google Scholar]
- 35.De Conti L., Baralle M., Buratti E. Exon and intron definition in pre-mRNA splicing. Wiley Interdiscip. Rev. RNA. 2013;4:49–60. doi: 10.1002/wrna.1140. [DOI] [PubMed] [Google Scholar]
- 36.Shao W., Kim H.-S., Cao Y., Xu Y.-Z., Query C.C. A U1-U2 snRNP interaction network during intron definition. Mol. Cell. Biol. 2012;32:470–478. doi: 10.1128/MCB.06234-11. [DOI] [PMC free article] [PubMed] [Google Scholar]
- 37.Volanakis A., Passoni M., Hector R.D., Shah S., Kilchert C., Granneman S., Vasiljeva L. Spliceosome-mediated decay (SMD) regulates expression of nonintronic genes in budding yeast. Genes Dev. 2013;27:2025–2038. doi: 10.1101/gad.221960.113. [DOI] [PMC free article] [PubMed] [Google Scholar]
- 38.Roy K., Chanfreau G. Stress-induced nuclear RNA degradation pathways regulate yeast bromodomain factor 2 to promote cell survival. PLoS Genet. 2014;10:e1004661. doi: 10.1371/journal.pgen.1004661. [DOI] [PMC free article] [PubMed] [Google Scholar]
- 39.Kawashima T., Douglass S., Gabunilas J., Pellegrini M., Chanfreau G.F. Widespread Use of Non-productive Alternative Splice Sites in Saccharomyces cerevisiae. PLoS Genet. 2014;10:e1004249. doi: 10.1371/journal.pgen.1004249. [DOI] [PMC free article] [PubMed] [Google Scholar]
- 40.Box J.A., Bunch J.T., Tang W., Baumann P. Spliceosomal cleavage generates the 3′ end of telomerase RNA. Nature. 2008;456:910–914. doi: 10.1038/nature07584. [DOI] [PubMed] [Google Scholar]
- 41.Chanfreau G. Conservation of RNase III Processing Pathways and Specificity in Hemiascomycetes. Eukaryot. Cell. 2003;2:901–909. doi: 10.1128/EC.2.5.901-909.2003. [DOI] [PMC free article] [PubMed] [Google Scholar]
- 42.Gagnon J., Lavoie M., Catala M., Malenfant F., Elela S.A. Transcriptome wide annotation of eukaryotic RNase III reactivity and degradation signals. PLoS Genet. 2015;11:e1005000. doi: 10.1371/journal.pgen.1005000. [DOI] [PMC free article] [PubMed] [Google Scholar]
- 43.Merkin J., Russell C., Chen P., Burge C.B. Evolutionary dynamics of gene and isoform regulation in mammalian tissues. Science. 2012;338:1593–1599. doi: 10.1126/science.1228186. [DOI] [PMC free article] [PubMed] [Google Scholar]
- 44.Barbosa-Morais N.L., Irimia M., Pan Q., Xiong H.Y., Gueroussov S., Lee L.J., Slobodeniuc V., Kutter C., Watt S., Colak R., et al. The evolutionary landscape of alternative splicing in vertebrate species. Science. 2012;338:1587–1593. doi: 10.1126/science.1230612. [DOI] [PubMed] [Google Scholar]
Associated Data
This section collects any data citations, data availability statements, or supplementary materials included in this article.