


Abstract
SOX9 is a transcriptional activator required for chondrogenesis, and SOX5 and SOX6 are closely related DNA-binding proteins that critically enhance its function. We use here genome-wide approaches to gain novel insights into the full spectrum of the target genes and modes of action of this chondrogenic trio. Using the RCS cell line as a faithful model for proliferating/early prehypertrophic growth plate chondrocytes, we uncover that SOX6 and SOX9 bind thousands of genomic sites, frequently and most efficiently near each other. SOX9 recognizes pairs of inverted SOX motifs, whereas SOX6 favors pairs of tandem SOX motifs. The SOX proteins primarily target enhancers. While binding to a small fraction of typical enhancers, they bind multiple sites on almost all super-enhancers (SEs) present in RCS cells. These SEs are predominantly linked to cartilage-specific genes. The SOX proteins effectively work together to activate these SEs and are required for in vivo expression of their associated genes. These genes encode key regulatory factors, including the SOX trio proteins, and all essential cartilage extracellular matrix components. Chst11, Fgfr3, Runx2 and Runx3 are among many other newly identified SOX trio targets. SOX9 and SOX5/SOX6 thus cooperate genome-wide, primarily through SEs, to implement the growth plate chondrocyte differentiation program.
INTRODUCTION
The advent of the chondrocyte lineage contributed fundamentally during evolution to the foundation of the vertebrate phylum. Chondrocytes build hundreds of cartilaginous anlagen during vertebrate embryogenesis. These structures provide morphological and mechanical body support, and their unique ability to elongate fast drives body growth. Cartilage is either maintained throughout life, namely in articular joints and airways, or is progressively remodeled during fetal and postnatal development to give rise to most craniofacial, axial and appendicular bones (1–3). Cartilage disorders exist in many forms in humans. Chondrodysplasias affect skeleton patterning, growth and ossification (4). They can be lethal in early life or cause lifelong disadvantages, such as dwarfism. Cartilage degenerative diseases, in contrast, typically develop in middle and old age. Their most prevalent form, osteoarthritis, leads to progressive deterioration of articular cartilage and to remodeling of adjacent tissues, causing severe joint pain, deformation and incapacitation (5). The present study was designed based on the principle that reaching a deep understanding of the regulatory mechanisms that underlie normal chondrogenesis will be instrumental to offer rational approaches to improve the treatments that today are still suboptimal for most of these diseases.
Chondrocytes arise in development from multipotent mesenchymal progenitor cells, as do osteoblasts, synovial fibroblasts, bone marrow stromal cells and adipocytes (1–3). Once settled in skeletogenic sites, progenitor cells coalesce into precartilaginous condensations and activate the chondrocyte differentiation program. Early-stage chondrocytes proliferate and build an abundant, cartilage-specific extracellular matrix. They express such genes as Col2a1 (encoding collagen type II) and Acan (proteoglycan aggrecan). Elongation of cartilage anlagen occurs in growth plates, structures in which chondrocytes proceed through terminal maturation steps in a precise spatial and temporal manner. They proliferate and produce cartilage matrix while aligning into longitudinal columns. They then cease proliferation, become prehypertrophic and express novel markers, such as Ihh (Indian hedgehog). As they become hypertrophic, they turn off most early markers and activate unique ones, including Col10a1 (collagen type X). They eventually die or switch to the osteoblast fate to participate in endochondral ossification. Chondrocytes forming permanent cartilage never proceed through these growth plate maturation steps. They keep expressing pancartilaginous early-chondrocyte markers and also express tissue-specific markers. For instance, superficial articular chondrocytes distinctively express Prg4 (lubricin).
Complex molecular networks regulate the lineage commitment, differentiation status and activity of chondrocytes. Ranking high in these networks is a trio of transcription factors composed of SOX5 (originally referred to as L-SOX5 (6) or SOX5L (7)), SOX6 and SOX9. These proteins exhibit a DNA-binding domain ≥50% identical to that of their family founder, SRY (encoded by the sex-determining region on the Y chromosome) (8). Within the SOX family, SOX5 and SOX6 belong to the SOXD group (9). They share >90% identity in their SRY-related box (SOX) domain and in their coiled-coil homodimerization domain. As a SOXE group member, SOX9 shares only 50% identity with SOX5 and SOX6 in the SOX domain and possesses a different type of homodimerization domain (10). SOX9 also carries a potent transactivation domain, whereas SOX5 and SOX6 do not. Sox9 expression in mesenchymal progenitors precedes chondrogenesis and increases at the onset of Sox5 and Sox6 expression in early chondrocytes (6,11,12). Expression of the three SOX genes culminates in growth plate proliferating and prehypertrophic chondrocytes, and is abruptly turned off when chondrocytes undergo hypertrophy. SOX9 is required for chondrogenesis. Its importance in this process was first revealed when heterozygous mutations within and around its gene were found to cause campomelic dysplasia, a human syndrome with severely malformed cartilage (13,14). Conditional inactivation of Sox9 in mouse embryo mesenchymal progenitors was shown to preclude precartilaginous condensation and its inactivation at the onset of chondrocyte differentiation to hinder overt chondrogenesis (15). Sox9 inactivation in fully differentiated chondrocytes triggers growth plate and articular cartilage failure (16,17). Unlike SOX9, SOX5 and SOX6 are not required for chondrogenesis. They are nevertheless necessary for efficient chondrogenesis. Global inactivation of either Sox5 or Sox6 leads to mild defects in skeletogenesis (18–20). However, co-inactivation of the two genes results in stunted, matrix-deficient cartilage primordia and in underdeveloped growth plate and articular cartilage, despite close-to-normal expression of Sox9. Based on these in vivo data and on virtually identical DNA-binding and transactivation properties in vitro, it is believed that SOX5 and SOX6 have largely redundant functions in the chondrocyte lineage. Results from molecular analyses, performed so far for only a limited set of genes, have proposed that SOX9 is required to turn on and maintain chondrocyte-specific genes and that SOX5/6 strikingly augment SOX9's transcriptional activity by securing SOX9 binding to DNA (6,21). Recent high-throughput chromatin immunoprecipitation-based experiments (ChIP-on-chip and ChIP-seq) have added support to this proposed role for SOX9 and have suggested that the factor might directly control a large set of genes in chondrocytes (22,23). Such studies, however, have not yet been reported for SOX5 and SOX6 in chondrocytes. In addition to transactivating genes, the SOX trio proteins have been proposed to directly repress genes in chondrocytes and other cell types. For instance, evidence was put forward that SOX9 might cooperate with GLI factors to repress hypertrophic chondrocyte markers (24); that SOX5 and/or SOX6 compete with SOX9 for DNA binding and thereby block oligodendrocyte and melanocyte differentiation (25,26); and that SOX6 also represses specific gene sets in erythroid cells and in skeletal myoblasts (27–29). Interestingly, a recent study in the hair follicle cell lineage has uncovered an additional, pioneer role for SOX9 in transcription (30). This role is to serve as a chromatin rheostat of the dynamic profiles of super-enhancers (SEs). The notion of SEs was recently introduced to designate very active enhancers or clusters of enhancers that are used as hubs by master transcription factors to govern the expression of major cell identity genes in embryonic stem cells and other cell types (31,32). Cells generally exhibit of a few hundreds of SEs and several thousands of other enhancers, referred to as typical enhancers (TEs).
We here use state-of-the-art genome-wide approaches to deepen our knowledge and understanding of the genomic actions of SOX9 and SOX5/6 in chondrocytes. Using a cell line that faithfully models growth plate chondrocytes, we uncover that the SOX trio proteins closely cooperate with each other genome-wide. They use SEs to effectively activate a large set of chondrocyte-specific genes and thereby implement the unique differentiation and regulatory program of these cells.
MATERIALS AND METHODS
Cells and animals
Rat chondrosarcoma (RCS) cells were a gift from Dr Kimura (33). HEK-293 and COS-7 cells were obtained from the American Type Culture Collection (ATCC). All cells were cultured in monolayer in Dulbecco's modified Eagle's medium (Sigma-Aldrich) supplemented with 10% heat-inactivated fetal bovine serum (Life Technologies), 2 mM glutamine and 100 U/ml penicillin/streptomycin. Animal experiments were performed as approved by the Cleveland Clinic Institutional Animal Care and Use Committee. Neonatal Sprague-Dawley rats (Charles River) were used to harvest rib cartilage immediately upon euthanasia. Mice carrying Sox5 (34), Sox6 (35) or Sox9 (36) conditional null alleles, and an ATC (17) or Prx1Cre transgene (37) were as described. ATC is a bi-transgene that produces the Cre recombinase in the cartilage-specific domain of an Acan enhancer upon mouse treatment with doxycycline (tetracycline analogue), whereas Prx1Cre produces Cre in limb bud mesenchyme. Pregnant mothers carrying Sox5fl/fl6fl/flATC or Sox9fl/flATC embryos received drinking water supplemented with doxycycline from gestation day 13.5 (E13.5) and fetuses were harvested at E16.5, as described (17).
RNA-seq assay and data analysis
RCS cells were harvested at 95% confluence in Buffer RLT (Qiagen). Neonatal rat rib cartilage was dissected with scalpels to remove most adjacent tissue, but to leave growth plate, articular cartilage and perichondrium intact. Samples were homogenized using an Omni TH Tissue Homogenizer equipped with a hard-tissue probe (Omni International). Total RNA was extracted and purified using RNeasy Mini Kit (Qiagen). RNA samples were prepared in triplicates from independently cultured RCS cell populations and from different rats. RNA quality and quantity were assessed using a 2100 Bioanalyzer (Agilent Technologies). Only samples with an RNA integrity number (RIN) >7.5 were used. Libraries were generated from 250 ng RNA using TruSeq Stranded Total RNA Sample Prep Kit (Illumina). Sequencing was carried out using Illumina HiSeq 2500 System (Genomics Core Facility, University of Chicago). FASTQ files from these samples and from 2-week-old female rat liver (GEO SRA SRP037986 database, NCBI) were uploaded in Strand NGS software for analysis. Single-end reads were mapped to the rn5 rat genome assembly. Ensembl tools were used for transcript annotation and gene expression analysis. RNA levels were normalized using DESeq (38). RNAs whose level was ≥3 NRPKM (normalized reads per kilobase of exon model per million mapped sequence) were considered significantly present. For analyses of differential expression levels between RCS cells and ribs, the cut-off was set at greater than or equal to two-fold change with a P-value < 0.05 in a Moderated t-test followed by Benjamin-Hochberg multiple testing corrections.
ChIP-seq assay
Chromatin was prepared and immunoprecipitated following a modified procedure (39). Briefly, RCS cells were cultured in three or four dishes (10-cm in diameter) per sample and incubated for 15 min at room temperature in culture medium supplemented with 1 or 1.5% paraformaldehyde. Chromatin crosslinking was stopped by adding 5% of 2.5 M glycine solution and incubating cells on ice for 5 min. Cells were then rinsed three times with ice-cold phosphate buffered saline and lysed on ice in buffer 1 (1 ml per dish; 50 mM HEPES, pH 7.5, 140 mM NaCl, 1 mM ethylenediaminetetraacetic acid (EDTA), 10% glycerol, 0.5% IGEPAL® CA-630, 0.25% Triton X-100 and Protease Inhibitor Cocktail [Roche]). Following centrifugation, cell pellets were treated with buffer 2 (1 ml per dish; 10 mM Tris–HCl, pH 8, 200 mM NaCl, 1 mM EDTA, 0.5 mM ethylene glycol tetraacetic acid (EGTA) and protease inhibitor cocktail) at room temperature for 10 min. Chromatin was resuspended in buffer 3 (1 ml per immunoprecipitation; 10 mM Tris–HCl, pH 8, 1 mM EDTA, 0.5 mM EGTA, 0.1% sodium deoxycholate, 5% Sarkosyl and PIC) and sheared into 100- to 500-bp fragments using a Branson D250 Sonifier or Diagenode Bioruptor. Supernatants were recovered after centrifugation at 6000 g for 5 min. Five microgram of rabbit polyclonal antibodies against SOX9 (AB5535, Millipore) or SOX6 (ab30455, Abcam), 2 μg of rabbit polyclonal antibodies against H3K27ac (ab4729, Abcam), H3K4me1 (ab8895, Abcam), H3K4me3 (ab8580, Abcam) or H3K9me3 (ab8889, Abcam), or an equal amount of rabbit non-immune IgG (12–370, Millipore) were coupled to 20 μl Dynabeads (Life Technologies). Chromatin samples were incubated with antibody-conjugated beads at 4°C overnight. Immunoprecipitated chromatin was washed with RIPA buffer (1% IGEPAL CA-630 [Sigma-Aldrich], 1% sodium deoxycholate, 1 mM EDTA, 50 mM HEPES, pH 7.5 and 0.5 M LiCl) and recovered by incubation in elution buffer (50 mM Tris, pH 8.0, 10 mM EDTA and 1% SDS) at 65°C for 15 min. After centrifugation at 13 000 rpm for 1 min, supernatants were collected and incubated overnight at 65°C to reverse crosslinking. DNA was purified by phenol/chloroform/isoamyl alcohol extraction and ethanol precipitation. Ten ng of ChIP-ed DNA was used per sample for library preparation. Single-end 50-base sequence reads were obtained using Illumina HiSeq 2500 System and mapped to rn5 using Strand NGS software (version 1.6).
Analyses of ChIP-seq peaks, SOX motifs and super-enhancers
Peaks for SOX6, SOX9 and histone modifications were identified using MACS software (version 1.4.5) with default settings (40). Peaks displaying a false discovery rate ≤1% were retained for analysis. Input libraries were used as controls for peak calling. Strand NGS software was used for peak visualization and region comparison, and the PAVIS tool was used for peak annotation (41). Each peak was assigned to the nearest gene as follows: (1) peaks present within a gene were assigned to this gene; (2) peaks located between two genes were assigned to the gene having the closer transcription start or stop site; and (3) peaks located > 250 kb away from any gene were not assigned to any gene (intergenic peaks). The overlap of SOX6 and SOX9 peaks was calculated by entering the peak chromosomal coordinates in the Compare Two Region Lists program of Strand NGS software. Distances between SOX6 and SOX9 peak summits were calculated by entering the summit chromosomal coordinates in the same program. Fold enrichment differences between SOX peak groups were analyzed using GraphPad Prism 6 and statistical significance (P < 0.05) was calculated using the one-way ANOVA followed by Tukey multiple comparison test. De novo motif discovery was performed by uploading 500-bp sequences centered on SOX peak summits into the MEME suite MEME-ChIP and GLAM2 programs and using default algorithm parameters (42). MEME suite CentriMo was used using default settings to analyze central enrichment of DNA motifs in ChIP-seq peaks (43). The probability that the best match to a SOX9 or SOX6 motif would be located in the central region of ChIP-seq peaks, if these motifs were randomly distributed, was calculated as the percentage of the 500-bp peak region occupied by the central region. The MEME suite Analysis of Motif Enrichment (AME) program was used to identify known motifs enriched in SOX peaks (44). findPeaks was used to identify SEs (45). As previously described (31,45), H3K27ac enhancer peaks were stitched together if they were located within 12.5 kb of each other. Enhancers were then ranked based on normalized H3K27ac signals. The curve slope was used to distinguish TEs (<1) from SEs (≥1). The numbers of SOX peaks present within genetic loci were calculated using a Strand NGS customized script. Correlations between SOX peak numbers, genetic locus lengths and RNA levels were evaluated using the Spearman Rank-Order Correlation test in GraphPad Prism 6. Gene ontology analyses of selected peak or gene sets were performed using knowledge-based Ingenuity Pathway Analysis (IPA, QIAGEN Redwood City, www.qiagen.com/ingenuity).
RNA insitu hybridization
RNA in situ hybridization was carried out using 35S-labeled RNA probes, as described (46). Sox5 and Sox6 3′ untranslated RNA probes were used for Sox9fl/flATC mice and coding exon probes for Sox5fl/fl6fl/flATC mice (34,35). Fgfr3 (18) and Runx2 (47) probes were as described. DNA templates for other probes were polymerase chain reaction (PCR)-amplified from mouse genomic DNA or cDNA using appropriate primers (Supplementary Table S1). Products were cloned into pCR4-TOPO (Life Technologies) and verified by sequencing.
Reporter assay
ChIP-seq peak regions were PCR-amplified from rat genomic DNA using specific primers (Supplementary Table S2). Products were cloned into a reporter plasmid upstream of a minimal Col2a1 promoter driving the firefly luciferase gene (48) and sequence-verified. RCS and HEK-293 cells were transfected using plasmid:FuGENE6 (Promega) mixtures as described (49). Briefly, plasmids included 150 ng reporter, 75 ng pSV2bgal plasmid (control for transfection efficiency) and 50 ng empty or SOX expression plasmid (6). Reporter activities were normalized for transfection efficiency and calculated as means with standard deviation for technical triplicates. The two-tailed Student's t-test was used to calculate the statistical significance (P < 0.05) of differences between datasets.
Western blot and electrophoretic mobility shift assays
Nuclear extracts were prepared from COS-7 cells forced to express flag-tagged SOX9, SOX5 and SOX6 as described (49). Proteins were detected in western blot using anti-Flag M2-peroxidase-conjugated antibody (1:2000, Sigma-Aldrich A8592). Electrophoretic mobility shift assays (EMSAs) were carried out using [α-32P]-dCTP-labeled probes and nuclear protein incubated in buffer containing poly(dG-dC) as non-specific DNA competitor (49). Samples were run on native polyacrylamide gels and signals detected on X-ray films.
RESULTS
RCS cells faithfully express a proliferating/early prehypertrophic growth plate chondrocyte phenotype
The highly dynamic nature of epigenetic and transcriptional landscapes of cells implies that cartilage growth plates are not well suited to unveil relationships between chromatin features and cell type- and differentiation stage-specific gene expression because they are composed of chondrocytes at various stages of maturation. We therefore sought to use a well-characterized, homogenous cell line for our study. The RCS cell line (also called LTR86) was originally derived from a rat Swarm chondrosarcoma and subjected to serial selection steps that only kept a population of cells stably maintaining a chondrocytic appearance in standard monolayer culture (33). The line was shown to robustly express chondrocyte early markers and has therefore been used as a convenient chondrocyte model in many studies (48,50–53). Its exact phenotype, however, has never been fully defined. We therefore used the RNA-seq approach to profile the whole transcriptome of RCS cells and thereby more definitively characterize them. We used neonatal rat ribs (containing growth plate, articular cartilage and non-cartilaginous tissue residues) and 2-week-old female rat liver (non-cartilaginous tissue) as controls. Based on a threshold of 3 NRPKM, RCS cells, ribs and liver were expressing 10 962, 12 494 and 10 679 genes, respectively (Figure 1A). The three samples were sharing 8364 genes. These genes represented 76% of the RCS transcriptome and likely included many ubiquitous housekeeping genes. Two-thirds of the other genes expressed in RCS cells were shared with ribs but not with liver (16%, 1791 genes) and thus likely comprised many chondrocyte-specific genes. The remaining genes were unique to RCS cells (6%, 621 genes) or shared with liver (2%, 186 genes). Of all RCS RNAs, almost 60% were present at levels within a two-fold range of those present in ribs (Figure 1B). The same was true for the gene set uniquely shared by RCS cells and ribs (Figure 1C). Many pancartilaginous markers were analyzed and all were found expressed at loyal levels in RCS cells (within five-fold of those in ribs; Table 1A and Supplementary Figure S3). These markers included the genes for SOX5, SOX6 and SOX9; other important regulatory factors, such as WWP2 (a WW domain-containing E3 ubiquitin protein ligase that augments SOX9's transcriptional activity; (54,55)) and Mir-140; and major cartilage-specific extracellular matrix components. Remarkably, markers of proliferating growth plate chondrocytes were strongly expressed in RCS cells (up to four-fold more highly than in ribs). An example was Fgfr3 (fibroblast growth factor receptor 3; Table 1B). Early prehypertrophic markers, namely Pth1r (parathyroid hormone 1 receptor), Runx2 (RUNT-related transcription factor 2) and Runx3, were strongly expressed too (up to two-fold more highly than in ribs). In contrast, late prehypertrophic markers and hypertrophic markers, such as Ihh and Col10a1, and terminal markers, such as Mmp13 (matrix metalloproteinase 13), were undetectable in RCS cells. Articular cartilage markers, such as Prg4, and fibrocartilage and elastic cartilage markers, such as Eln (elastin) and Col1a1, were also silent in RCS cells, as so were mesenchymal cell, osteoblast, tenocyte and adipocyte markers (Table 1C–E). The phenotype of RCS cells thus faithfully matches that of growth plate chondrocytes at the proliferating/early prehypertrophic stage. This phenotype elected the cells as a reliable model for our genome-wide study.
Figure 1.
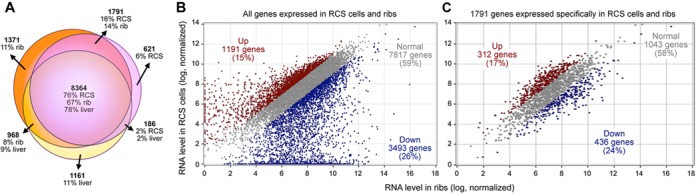
RCS cell transcriptome analysis. (A) Venn diagram of the transcriptomes of RCS cells, neonatal rib cartilage and juvenile liver. Gene numbers are written in bold figures. The transcriptome percentages in each section are indicated. (B) Scatter plot comparing RNA levels between RCS cells and rib cartilage. Each dot represents one RNA species. RNAs whose level is more than two-fold higher in RCS cells are shown in red (Moderated t-test, 95% confidence). RNAs whose level is more than two-fold lower in RCS cells are shown in blue. RNAs whose levels are less than two-fold different between RCS cells and ribs are shown in gray. The percentage of RNAs making up each group is indicated. (C) Similar plot as in (B), but limited to the 1791 genes expressed in RCS cells and rib cartilage, but not in liver.
Table 1. RNA levels of chondrocyte and other cell lineage markers assessed by RNA-seq in RCS cells and rib cartilage.
| Gene | RCS cells | Ribs | Gene | RCS cells | Ribs |
|---|---|---|---|---|---|
| A. Pancartilaginous markers | C. Other types of cartilage markers | ||||
| Acan | 246.88 ± 41.77 | 165.35 ± 27.34 | Articular cartilage | ||
| Col2a1 | 145.65 ± 27.35 | 723.65 ± 230.48 | Erg | 0.86 ± 2.08 | 67.36 ± 4.26 |
| Col9a1 | 64.26 ± 5.93 | 59.10 ± 16.21 | Prg4 | 0.82 ± 0.20 | 5.79 ± 1.38 |
| Col11a1 | 174.89 ±17.31 | 297.90 ± 57.10 | Cilp2 | 0.09 ± 0.03 | 71.98 ± 8.40 |
| Hapln1 | 65.14 ± 2.22 | 53.94 ± 13.11 | Gdf5 | 0.07 ± 0.1 | 15.79 ± 2.95 |
| Mir140 | 29.05 ± 12.21 | 39.16 ± 12.17 | Fibrocartilage and elastic cartilage | ||
| Sox5 | 45.93 ± 1.35 | 31.06 ± 10.30 | Bgn | 6.97 ±0.73 | 300.95 ± 38.62 |
| Sox6 | 35.19 ± 0.97 | 37.83 ± 6.40 | Col1a1 | 1.26 ± 0.18 | 890.50 ± 380.38 |
| Sox9 | 49.78 ± 5.83 | 49.93 ± 8.37 | Col3a1 | 0.54 ± 0.20 | 413.79 ± 93.10 |
| Wwp2 | 168.07 ± 6.98 | 139.00 ± 30.47 | Dcn | 0.02 ± 0.04 | 117.10 ± 8.14 |
| B. Growth plate markers | Eln | 0.07 ± 0.05 | 115.74 ± 11.46 | ||
| Proliferating/columnar chondrocytes | D. Mesenchyme markers | ||||
| Comp | 175.05 ± 28.66 | 98.00 ± 8.29 | Col1a1 | 1.26 ± 0.18 | 890.50 ± 380.38 |
| Matn1 | 166.83 ± 16.11 | 40.86 ± 7.49 | Tnc | 0.06 ± 0.01 | 106.82 ± 15.81 |
| Ptch1 | 62.63 ± 7.44 | 33.09 ± 4.25 | Fn1 | 64.10 ± 5.88 | 212.50 ± 6.87 |
| Fgfr3 | 273.28 ± 23.57 | 94.92 ± 16.80 | Sox2 | 23.29 ± 0.97 | 0.27 ± 0.05 |
| Proliferating, pre/hypertrophic chondrocytes | E. Non-chondrocytic lineage markers | ||||
| Runx2 | 32.76 ± 2.59 | 21.96 ± 1.32 | Osteoblast | ||
| Runx3 | 21.88 ± 3.03 | 9.95 ± 2.33 | Ank1 | 0.03 ± 0.03 | 9.42 ± 3.48 |
| Prehypertrophic chondrocytes | Bglap | 0.94 ± 0.60 | 30.45 ± 21.85 | ||
| Sp7 | 29.06 ± 0.87 | 23.50 ± 8.65 | Col1a1 | 1.26 ± 0.18 | 890.50 ± 380.38 |
| Pth1r | 69.95 ± 6.80 | 66.05 ± 13.10 | Ibsp | 0.45 ± 0.11 | 44.08 ± 33.25 |
| Pre/hypertrophic chondrocytes | Runx2 | 32.76 ± 2.59 | 21.96 ± 1.32 | ||
| Ihh | 0.13 ± 0.05 | 22.15 ± 6.23 | Sp7 | 29.06 ± 0.87 | 23.50 ± 8.65 |
| Col10a1 | 0.79 ± 0.17 | 191.35 ± 104.07 | Tenocyte | ||
| Bmp6 | 0.92 ± 0.11 | 16.42 ± 2.78 | Col1a1 | 1.26 ± 0.18 | 890.50 ± 380.38 |
| Terminal chondrocytes | Scx | 2.61 ± 0.26 | 30.90 ± 9.46 | ||
| Ibsp | 0.45 ± 0.11 | 44.08 ± 33.25 | Tnmd | 0.00 | 113.04 ± 29.61 |
| Mmp13 | 0.79 ± 0.37 | 42.81 ± 30.83 | Adipocyte | ||
| Adipoq | 0.25 ± 0.23 | 27.90 ±16.23 | |||
| Fabp4 | 1.17 ± 0.54 | 110.57 ± 33.59 | |||
RNA levels are reported as NRPKM. RNAs whose levels are ≥3.00 NRPKM are considered significantly expressed.
SOX6 and SOX9 bind thousand of sites in the chondrocyte genome
We employed the ChIP-seq approach to uncover the full spectrum of genomic targets of SOX9 and SOX5/6 in RCS cells. We tested SOX6 and SOX9 using antibodies previously shown to be highly specific (17,28). We did not test SOX5 because of lack of suitable antibodies for this protein and because SOX5 and SOX6 are likely redundant in chondrocytes. Close to 100 million reads were obtained for each protein. SOX9 reads formed 9143 peaks and SOX6 reads formed 12 072 peaks (Figure 2A; Supplementary Tables S3 and S4). Over a third of these peaks occurred within gene exons and introns. Another third were located upstream of genes. Less than a quarter laid downstream of genes, and a few percent were found >250 kb away from any gene. Altogether, the SOX9 peaks were associated with 5168 genes and the SOX6 peaks with 6151 genes (Figure 2B). Detailed analysis indicated that >40% of these genes had at least one internal SOX peak; about 30% featured their closest SOX peak <10 kb outside of their transcriptional boundaries and the rest had their closest peak between 10 and 50 kb more frequently than between 50 and 250 kb. The SOX trio might thus directly control several thousand genes.
Figure 2.
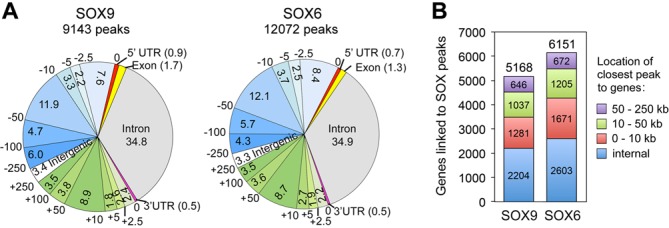
Distribution of SOX6 and SOX9 peaks in the RCS cell genome. (A) Pie charts showing the positions of SOX6 and SOX9 peaks relative to genes. Each peak was assigned to the closest gene located within 250 kb. The genome is split into 17 regions. Regions upstream of genes are shown in blue shades, with boundaries indicated in kb (from 0 to −250 kb). Downstream regions are shown in green shades. The intergenic (white), 5′ untranslated (5′ UTR; red), exonic (yellow), 3′ UTR (pink) and intronic (gray) regions are shown too. The percentages of peaks falling into each region are shown within pie slices or in parentheses. (B) Numbers of genes associated with SOX6 and SOX9 peaks (above stacked columns) and numbers of genes (within columns) that have their closest SOX peak in the transcribed region (internal), proximal regions (0–10kb upstream or downstream of transcribed regions), distal regions (10–50 kb) and far-distant regions (50–250 kb).
SOX6 and SOX9 bind to distinct, but closely spaced sequences in the chondrocyte genome
Previous analyses of about a dozen genes led to the paradigm that SOX5/6 bind to the same enhancers as SOX9 and thereby secure SOX9 binding to DNA (21). Extending this concept genome-wide, we observed that 65% of SOX9 peaks were overlapping with 50% of SOX6 peaks (Figure 3A). Most overlapping peaks had their summits ≤150 bp apart (51% of all SOX9 peaks; Figure 3B). Others (14% of all SOX9 peaks) had their summits 150- to 500-bp apart, which is still within the width of most transcriptional units. Noticeably, SOX9 and SOX6 peaks having their summits within 150 bp of each other were more enriched (9.4- and 13.2-fold, respectively) than those having their summits 150 to 500 bp apart (8.3- and 12.1-fold, respectively; Figure 3C). The latter were more enriched than non-overlapping peaks (6.7- and 10.0-fold, respectively). Previous DNA motif analyses indicated that SOX9 contacts cartilage targets by homodimerizing on sequences featuring two SOX motifs oriented head-to-head and separated by 4 nt (A/TA/TCAAA/TG[4Ns]CA/TTTGA/TA/T) (21,56,57). The SOX motifs often present one or two mismatches and are thus called SOX-like motifs. SOX5 and SOX6 were also shown to bind as dimers (homo- or heterodimers) on sequences featuring two SOX or SOX-like sites (6,21). The distance between the sites and their relative configuration appeared, however, less critical than for SOX9. To identify the sequences most often bound by SOX9 and SOX6 genome-wide, we subjected peak sequences to de novo motif analyses using MEME-ChIP (software designed to discover ungapped motifs). The first and third best-scoring motifs identified by this program in SOX9 peaks matched the previously deduced SOX9 consensus, except that the two SOX sites were separated by 3 or 4 nt (Figure 3D and Supplementary Figure S1A). The second best-scoring motif was a RUNT-domain consensus. For SOX6, MEME-ChIP gave its best score to a 21-bp A-rich motif (Figure 3E). The second place went to a single-SOX motif and the third place to a motif resembling a zinc-finger domain motif (Figure 3E and Supplementary Figure S1B). GLAM2 (software designed to discover motifs with variable-length patterns) gave its best score for SOX9 peaks to a pair of inverted SOX motifs separated by 3 to 5 nt (Supplementary Figure S1C). It also gave high scores to motifs resembling the A-rich motif found by MEME-ChIP in SOX6 peaks. Its best scores for SOX6 peaks went to motifs resembling the SOX6 A-rich motif, followed by a SOX9 consensus motif (Supplementary Figure S1D). An AME search for known DNA-binding protein motifs validated the presence of RUNT motifs in SOX9 and SOX6 peaks and also identified motifs for Forkhead (FOX), zinc-finger and a few other proteins (Supplementary Figure S2A and B).
Figure 3.
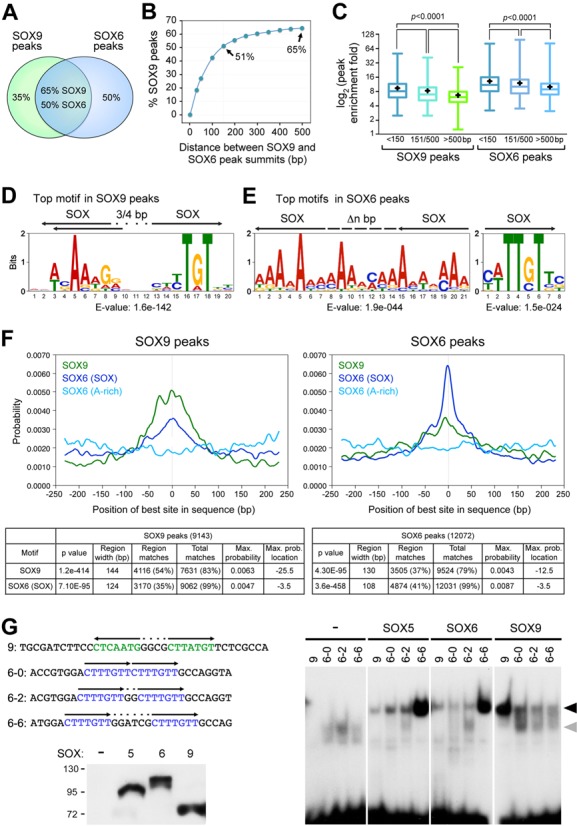
SOX6 and SOX9 peak overlap and DNA motif analyses. (A) Overlap between SOX6 and SOX9 peaks in the RCS genome. (B) Cumulative graph showing the percentages of all SOX9 peaks that have their summits within 500 bp of SOX6 peak summits. (C) Global analysis of the fold enrichment of SOX9 and SOX6 peaks that have their summits within 150, 151–500 and >500 bp of each other. Boxes indicate first quartiles (bottom line), medians (middle) and third quartiles (top). Whiskers represent maximum and minimum values. Black crosses denote means. Statistical significance of differences between groups was determined by one-way ANOVA. (D and E) Best-scoring motif discovered in SOX9 (D) and SOX6 (E) peaks using MEME-ChIP. E-values are indicated. DNA sequences are presented with letter sizes proportional to nucleotide occurrence. Black arrows indicate the predicted position and orientation of SOX sites (SOX). Dots schematize intervening nucleotides. The left logo in panel E features multiple overlapping SOX-like sites (the arrows only show two examples). The discontinuous line represents sequences that could be part of SOX-like binding sites or intervening sequence between two sites. (F) CentriMo analysis of SOX9 and SOX6 peak sequences using SOX9 and SOX6 motifs identified by MEME-ChIP and shown in (D) and (E). Data output from CentriMO analysis are shown in the tables. These data indicate, for each motif, the central enrichment P-value, the width of the most enriched central region (region width), the number of ChIP-seq peak regions whose best match to the motif falls within the central region (region matches), the number of sequences containing a match to the motif above the score threshold (total matches), the maximum probability that the best match occurs at any single sequence position (max. probability) and the sequence position where the match-probability curve for the motif attains its maximum (max. prob. location). (G) EMSA. Top left, probe names and sequences. The first figure in the names indicates that the sequences are predicted to preferentially bind SOX9 or SOX6. The second figure indicates the number of nucleotides separating SOX sites. These sites are shown in color in the DNA sequence and with arrows indicating their orientation. The SOX9 probe corresponds to a predicted SOX9 site in the Sox9 E195 enhancer. The SOX6 probes were designed manually. Only the upper-strand sequence is shown. Bottom left, western blot of nuclear extracts from COS-7 cells forced to express no protein (−), FLAG-tagged SOX5, SOX6 or SOX9. Proteins were detected with a FLAG antibody to demonstrate the presence of similar amounts of SOX protein in all samples. Right, EMSA with COS-7 nuclear extracts and labeled probes. Arrowheads, complexes formed between the probes and SOX5, SOX6 and SOX9 dimers (black) or SOX9 monomers (gray). Free probes are seen at the bottom of the gel.
We used CentriMo to determine whether the motifs identified in SOX9 and SOX6 peaks were centrally enriched. The SOX9 motif showed strong central enrichment in SOX9 peaks, and lower, but still significant central enrichment in SOX6 peaks (Figure 3F). Its profile was multimodal, suggesting that some peaks might involve several SOX9 sites. The SOX6 A-rich motif did not show central enrichment in SOX6 and SOX9 peaks. In contrast, the single-SOX motif exhibited strong central enrichment in SOX6 peaks, and weaker, but still significant central enrichment in SOX9 peaks. Since the SOX9 motif is a pair of SOX sites, we reasoned that the profile obtained for this single-SOX motif was possibly contributed by both SOX6 and SOX9. However, since this motif had a higher maximum probability than the SOX9 motif in SOX6 peaks and a lower maximum probability than the SOX9 motif in SOX9 peaks, we concluded that this motif belonged at least in part to SOX6. CentriMo determined that the SOX9 motif was present in 83% of all SOX9 peaks and in 79% of all SOX6 peaks. The best match to the SOX9 motif in each sequence was centrally enriched in 54% of SOX9 peaks and in 37% of all SOX6 peaks, which is much more than what would be expected from random distribution (29 and 26%, respectively). The single-SOX motif was found in 99% of SOX6 and SOX9 peaks. Its best match in each sequence was centrally enriched in 41% of SOX6 peaks and in 35% of SOX9 peaks, which is also more often than what would be expected from random distribution (22 and 25%, respectively). The peaks that featured a central motif were significantly more enriched than the others, arguing that these peaks reflected high-affinity binding of the SOX proteins to DNA (Supplementary Figure S3A). CentriMo analysis revealed low central enrichment for the RUNT and FOX motifs in SOX6 and SOX9 peaks and no central enrichment for the zinc-finger motif (Supplementary Figure S3B).
These findings and those from previous studies prompted us to further investigate which motif(s) are selected by SOX6 in the chondrocyte genome. We reasoned that the single-SOX motif might only represent a partial SOX6 binding site, since SOX6 binds more avidly in vitro to sequences harboring two SOX or SOX-like motifs than to sequences harboring a single motif and since the sequences binding and mediating the function of SOX5/6 in an Acan enhancer contained at least two SOX-like motifs (21). These motifs were present in the same orientation, but were differentially spaced (Supplementary Figure S3C). Since SOX proteins make most of their DNA contacts with A/T pairs (8), we thus reasoned that the A-rich motif might be recognized by SOX6 as a tandem pair of SOX-like motifs. Because the ability of SOX5/6 to bind to tandem SOX sites separated by a variable number of nucleotides had never been tested, we performed EMSAs to address this point and compare SOX5/6 to SOX9. As expected, SOX9 was binding more efficiently to a sequence resembling its consensus than to sequences carrying tandem SOX sites (Figure 3G). SOX5 and SOX6 were able to bind to the SOX9 consensus as easily as to tandem sites separated by 0 or 2 nt, but they markedly preferred tandem SOX sites separated by 6 nt. Altogether, these data supported the notion that SOX6 might preferentially bind tandem SOX or SOX-like sites in the chondrocyte genome. We further tested this possibility by analyzing the sequences of SOX6 and SOX9 peaks in enhancer regions associated with chondrocyte-specific genes (Acan, Chst11, Fgfr3, Runx2 and Runx3). This analysis identified strong SOX9 motifs close to SOX9 peak summits and weak ones close to SOX6 peak summits (Supplementary Figure S3C). It also identified strong single-SOX and A-rich motifs close to the SOX6 summits and weak ones close to SOX9 peak summits. Importantly, the single-SOX motifs were frequently present in tandem orientation.
Taken together, these data indicated that SOX6 and SOX9 often and most efficiently bind near each other in the chondrocyte genome, but contact distinct DNA motifs. While SOX9 preferentially binds inverted SOX motifs separated by 3 to 5 nt, SOX6 appears to favor pairs of tandem SOX motifs. RUNT domain and possibly other types of transcription factors might directly interact with the SOX trio functionally.
SOX6 and SOX9 bind preferentially to super-enhancers associated with cartilage-specific genes
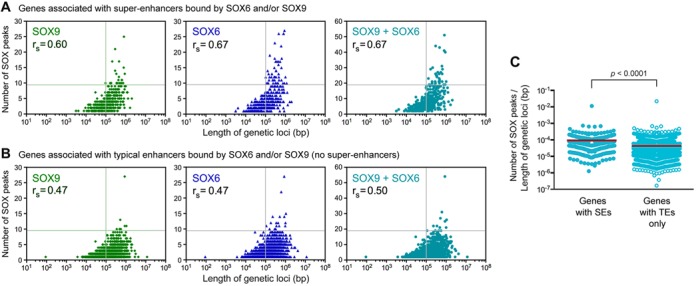
To start exploring the functional implications of the binding of SOX9 and SOX6 to genomic sequences in chondrocytes, we compared the distribution of the SOX peaks with that of histone modifications. We found that more than two-thirds of the SOX9 and SOX6 peaks (75 and 66%, respectively) were located in regions carrying the H3K27ac signature of active enhancers, and almost as many (65 and 61%) were occupying regions carrying the H3K4me1 mark of poised and active enhancers (Figure 4A). Less than one-third (27 and 29%) were associated with the H3K4me3 mark of active promoters. A few percent coincided with an H3K9me3 mark of transrepression (5 and 4%) and the rest were not associated with any of the histone modifications that we analyzed (6 and 10%). Taking the frequent overlap of histone modifications into account, we deduced that SOX9 and SOX6 were bound almost always at enhancers (92 and 86%, respectively) and only occasionally (2 and 4%) in regions carrying only a repressor or promoter signature (Figure 4B). We then asked whether the SOX trio proteins preferred SEs or TEs. We found that RCS cells contained 19 126 TEs and 724 SEs (Figure 4C; Supplementary Table S6). Interestingly, 89% of the SEs, including all strongest ones, were bound by both SOX6 and SOX9, compared to only 20% of the TEs (Figure 4D and E). The remaining SEs were bound in similar proportions by neither SOX protein (3%), by SOX6 only (4%) and by SOX9 only (4%), whereas other TEs more often lacked SOX peaks (62%) than carried SOX6 peaks (10%) or SOX9 peaks (8%). The RNA levels of genes associated with SEs were significantly higher than those of genes associated only with TEs, but irrespective of the presence of SOX peaks (Figure 4F). This result is consistent with the concept that SEs ensure high expression of their target genes. Although it indicated that SOX proteins do not confer such a quantitative advantage to their targets, it did not rule out that SOX proteins confer a qualitative advantage to their targets, i.e. specific expression in chondrocytes. Validating this possibility by looking at the genes that were associated with the strongest SEs, we found essential cartilage-specific genes (Figure 4D). These genes included Chst11 (encoding a chondroitin sulfate transferase essential in cartilage proteoglycan synthesis;(58), Col9a1 (α1 chain of collagen type 9), Wwp2, Acan, Sox9, Sox6, Runx2 and Fgfr3. Furthermore, ingenuity pathway analyses demonstrated that disease and physiological system categories highlighting the musculoskeletal system, and cartilage in particular, were the best fits for the 411 genes that were both expressed in RCS cells and associated with SOX6/9-bound SEs (Figure 4G). In contrast, these categories were not included in the top five categories for the genes that were both expressed in RCS cells and associated only with SOX6/9-bound TEs (Figure 4H). Taken together, these data revealed that the SOX trio might critically govern chondrogenesis through SEs.
Figure 4.
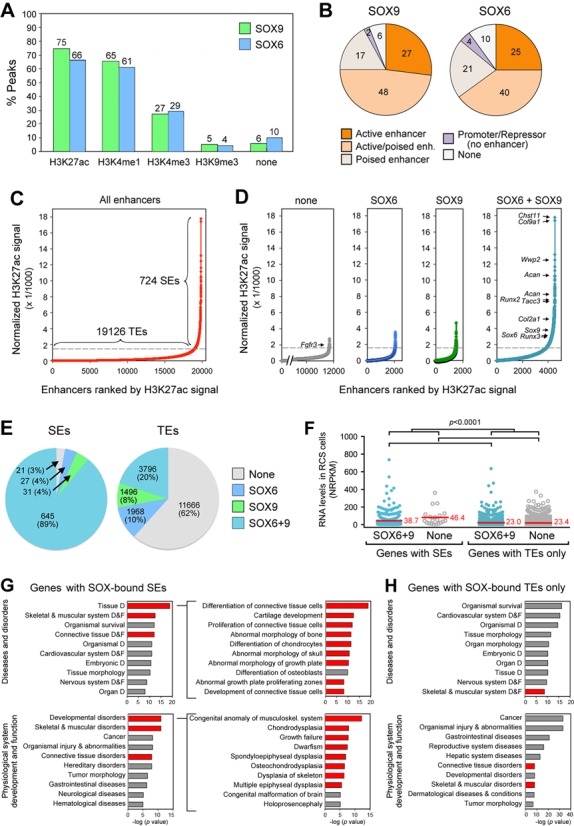
Association of SOX peaks with histone modifications, super-enhancers (SEs) and gene categories. (A) Percentages of SOX6 and SOX9 peaks associated with histone modifications. (B) Association of SOX peaks with promoters only (positive for H3K4me3, and negative for the other histone modifications), active enhancers (positive for H3K27ac and negative for H3K4me1), mixed active/poised enhancers (positive for H3K27ac and H3K4me1), poised enhancers (positive for H3K4me1, but negative for H3K27ac), repressors (positive only for H3K9me3), or none of the analyzed histone modifications. The percentages of peaks corresponding to each category are indicated. (C) Ranking of all enhancers detected in RCS cells, based on normalized H3K27ac ChIP-seq signals. The dotted line identifies the boundary (curve slope = 1) between typical enhancers (TEs) and SEs. The number of enhancers in each group is indicated. (D) Sorting of enhancers into groups, based on overlap with no SOX peaks (none), SOX6 peaks, SOX9 peaks, and SOX6 and SOX9 peaks. A few genes associated with SEs are indicated. (E) Percentages and number of SEs and TEs in each of the four groups shown in panel D. (F) Comparison of RNA levels between gene categories made according to the association of genes with SEs or with TEs only and according to the presence or absence of peaks for SOX6 and SOX9 in these enhancers. Red bars indicate mean values. Brackets indicate the gene categories for which one-way ANOVA statistical analysis was performed and showed a P-value < 0.0001. (G and H) Ingenuity pathway analysis of the 411 genes that were expressed in RCS cells and were associated with SE(s) bound by SOX6 and SOX9 (G) and the 2275 genes that were associated only with TE(s) bound by SOX6 and SOX9 (H). Categories most specifically related to cartilage are highlighted in red. Bars represent the –log of the P-value for the association of genes with each category. The top subcategories in the tissue development and developmental disorders categories are shown for the SE group. D, Development. F, Function.
SOX6 and SOX9 predominantly target active cartilage-specific genes
Global analyses of ChIP-seq data provided new insights on the mechanisms that likely underlie the chondrogenic actions of the SOX trio, but intrinsic limitations, such as predefined criteria for peak assignment to genes, motivated us to complement these analyses by manually inspecting the loci of genes with pivotal functions in cartilage. Col2a1 spans about 30 kb in mammalian genomes (Figure 5A). Its 5′ neighbor (Tmem106c) and 3′ neighbor (Atf1) are located only 17 and 5 kb away, respectively. A 24-kb-long SE encompassed the Col2a1 promoter and most of the gene body. It included the first and sixth introns, where three peaks for each of SOX6 and SOX9 were present. This result was consistent with previous reports (22,23,48). Acan spans 61 kb in the rat genome and while its 3′ neighbor (Hapln3) is only 3 kb away, its 5′ neighbor (Isg20) is 150 kb away (Figure 5B). Three SEs were occupying most of the 5′ domain and first intron of Acan. They were displaying 16 SOX9 peaks and 13 SOX6 peaks. Most of the enhancers constituting these SEs were orthologs of cartilage-specific enhancers previously described in human and mice (21,59), and half of them had an H3K27ac signature in E14.5 mouse limbs (Supplementary Figure S4). Other genes involved in the making of the cartilage extracellular matrix resembled Col2a1 in that their locus was relatively short and featured only one SE bound once or a few times by the SOX proteins. They included Col9a2 (Figure 5C) and Matn1 (matrilin-1; Supplementary Figure S5A). Others resembled Acan in that their locus was large and featured several SEs bound multiple times by SOX6 and SOX9. They included Chst11, Col9a1 and Col11a1 (Figure 5D and Supplementary Figure S5B and C).
Figure 5.
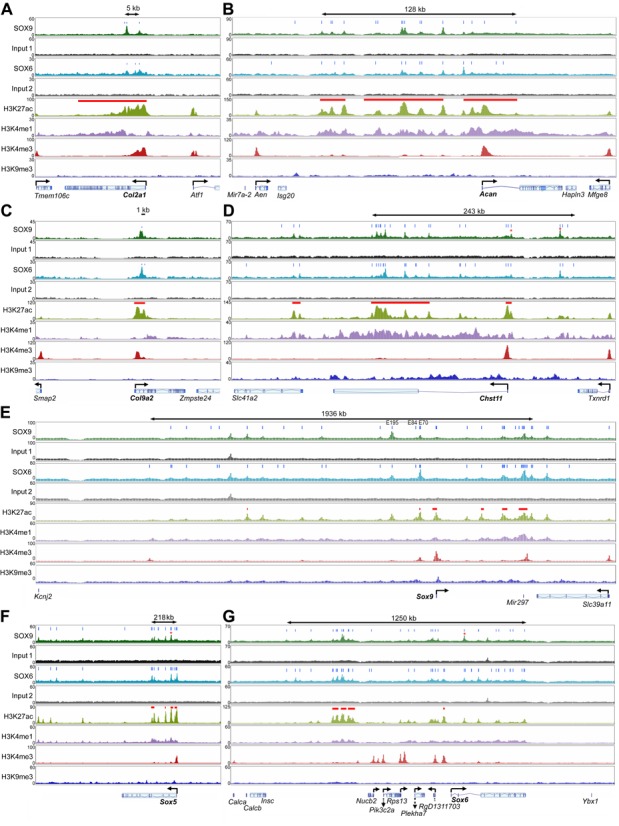
Distribution of SOX9, SOX6 and histone modification peaks within and around various genes of interest (A to M). Input material is shown for SOX9 (1) and SOX6 (2). ChIP-seq signals are plotted on the Y-axis as total read numbers calculated on a read-per-million basis. They are shown for genomic windows (X-axis) adjusted in each panel to the length of the genetic locus of interest. A double arrow at the top of each panel denotes the size of SOX6/9-bound enhancer clusters that might influence genes of interest. Gene bodies are shown with angled arrows at the transcription start site. Genes of interest are indicated in bold letters. Vertical blue bars indicate the summit of SOX6 and SOX9 peaks. Horizontal red bars denote SEs. Red asterisks indicate peaks selected for reporter assays (see Figure 8). Note that Sox6, Wwp2 and Arid5a display a promoter mark several kb upstream of the reported reference genes. Three cartilage-specific enhancers (E195, E84 and E70) are indicated in the Sox9 locus.
Many master transcription factors positively regulate their own genes and those of functional partners, but evidence of this property is incomplete or lacking for the SOX trio (15,60,61). Sox9 is compact (5.5 kb), but located 2.0 and 0.5 Mb away, respectively, from its 5′ (Kcnj2) and 3′ (Slc39a11) coding neighbors (Figure 5E). A total of 25 SOX9 peaks and 30 SOX6 peaks were detected within Sox9 and its flanking regions. They were distributed within six SEs and a dozen TEs. Among the three enhancers that we previously proposed to be involved in Sox9 auto-regulation (49,60), E70 was classified as a SE, but E195 and E84 were classified as TEs. Three of the SEs were located 3′ of Sox9 in a region that is near to Slc39a11 and that houses Mir297. Since Mir297 and Slc39a11 are expressed in RCS cells (see Supplementary Table S3 for a list of RNA levels for all genes expressed in RCS cells), it is possible that these SEs control Mir297 or Slc39a11 rather than, or in addition to Sox9. Sox9 inactivation in mouse embryo mesenchyme was previously shown to preclude expression of Sox5 and Sox6 (15), arguing that SOX9 might directly control the genes for its co-factors. Sox5 and Sox6 are very large genes (370 and 560 kb, respectively) and their neighbors are 50–800 kb away (Figure 5F and G). Four SEs were spread over the 5′ half of Sox5 and a few TEs were dispersed in the 3′ flanking region. Most of these enhancers were bound by both SOX6 and SOX9. Sox6 featured one SE at the level of its alleged promoter (marked by an H3K4me3 signature) and multiple TEs spread over its body. Here too, most enhancers were SOX6/9-bound. Altogether, the data consolidated the notion that the SOX trio might directly control its genes in chondrocytes. Intriguingly, a cluster of SOX6/9-bound SEs was located far upstream of Sox6 and several active neighbors (Nucb2, Pik3c2a, Rps13, Plekha7, RgD1311703), raising the possibility that this cluster might remotely coordinate the expression of Sox6 and its neighbors.
We examined other chondrocyte-specific regulatory genes. Nkx3.2 (encoding the transcriptional repressor NKX3.2/BAPX1) was proposed to form an auto-regulatory loop with SOX9 at the onset of chondrogenesis (62) and to be a direct target of SOX9 (63). Nkx3.2 was expressed in RCS cells and featured a TE over its promoter (Figure 5H). This region showed a small peak for SOX6, but none for SOX9, arguing that Nkx3.2 expression was possibly controlled by SOX6, but not by SOX9 in RCS cells. An in vitro study previously proposed that the AT-rich interactive domain-containing protein 5, encoded by Arid5a, might stimulate the transcriptional activity of SOX9 in chondrocytes (64). Arid5a featured a TE bound by SOX6 and SOX9, but no SE (Figure 5I). The SOX trio might thus directly control Arid5a expression in chondrocytes. Wwp2 houses Mir140 in one of its distal introns. Both genes importantly contribute to gene expression in chondrocytes (65–68). SOX9 was proposed to activate Wwp2 in chondrocytes by binding to a promoter site and in hair follicle stem cells by binding to an intronic sequence (30,55). A large SE bound multiple times by SOX6 and SOX9 encompassed Wwp2 and Mir140, and a smaller SE, also bound by the SOX proteins was located upstream of Wwp2 (Figure 5J). These findings corroborated that Wwp2 and Mir140 are major targets of the SOX trio in chondrocytes. Fgfr3 is strongly expressed in growth plate chondrocytes and is essential to prompt cell cycle exit and hypertrophic maturation (69). The Fgfr3 promoter featured one of the few SEs present in RCS cells that were not bound by SOX6 and SOX9 (Figure 5K). Another SE, larger and carrying SOX6 and SOX9 peaks, was located 20–47kb 5′ of Fgfr3 and 1–28 kb 3′ of Tacc3 (transforming, acidic coiled coil-containing protein 3). The latter gene is active in RCS cells and important in cartilage development (70). These data thus evoked the possibility that this SOX6/9-bound SE might control both Fgfr3 and Tacc3. Runx2 and Runx3 encode RUNT-domain proteins required for growth plate chondrocyte maturation (71). Both SOX6 and SOX9 were bound to multiple enhancers within and around these genes. They included several SEs within and around Runx2 and its overlapping neighbor (Supt3h), and a large SE encompassing the Runx3 body (Figure 5L and M). These results advocated that the SOX trio might directly control Runx2 and Runx3 in growth plate chondrocytes.
We then asked whether markers of chondrocyte differentiation stages distinct from that modeled by RCS cells were bound by the SOX trio in these cells. Col10a1, a marker of chondrocyte hypertrophy, is turned on in SOX trio-positive prehypertrophic chondrocytes. Gdf5 (growth and differentiation factor 5) is co-expressed with the SOX trio in embryonic joint progenitor cells (72,73). Prg4 is a specific marker of SOX trio-expressing joint surface-lining chondrocytes (74). None of these genes was expressed in RCS cells and featured SOX peaks within or around its transcribed region (Supplementary Figure S5D to F). Lastly, we examined genes reported to be targets of SOX9 in hair follicle cells (66). Fzd9 (frizzled homolog 9) and Msrb3 (methionine sulfoxide reductase B3) were highly expressed and had SOX6/9-bound SEs in RCS cells, whereas S100a4 (S100 calcium-binding protein A4) and Inhbb (inhibin beta-B) were hardly expressed in RCS cells and lacked any significant SOX6/9-bound enhancer (Supplementary Figure S5G to J). In conclusion, this analysis of individual genetic loci provided additional insights on important possible actions of the chondrogenic SOX trio. SOX6 and SOX9 mainly bind to genes that are co-expressed with them. These genes include major cartilage structural and regulatory genes, including the SOX trio genes. The SOX proteins often bind multiple enhancers located within, nearby, and sometimes far away from genes. Several instances were highlighted where SOX6/9-bound enhancers might simultaneously control several genes.
The density of SOX6/9-bound enhancers correlates with gene expression levels
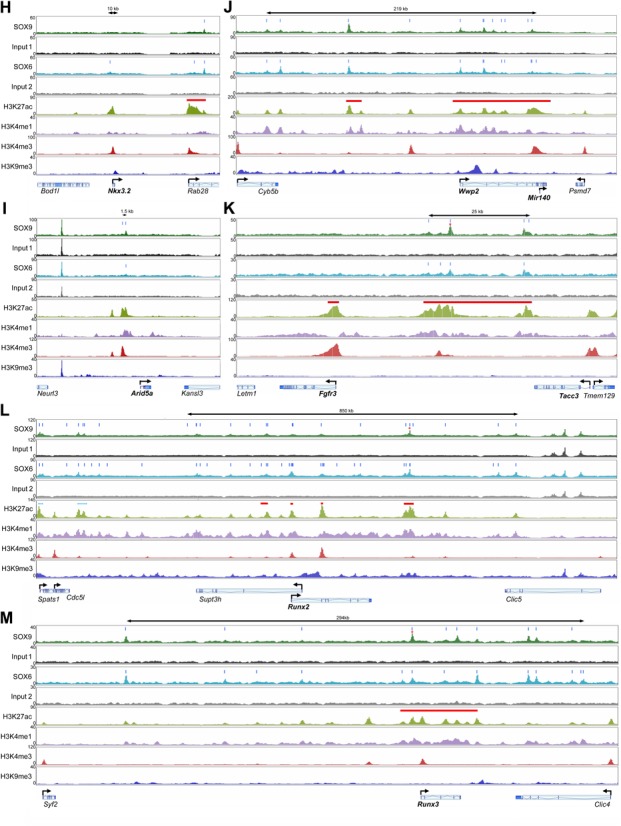
Having uncovered that SOX6 and SOX9 are often bound to multiple sets of TEs and SEs within and around gene bodies, especially when gene bodies and their flanking regions are very large, we next asked to which extent the number of SOX6/9 peaks was linked to the length of genetic loci and RNA levels. We defined genetic loci as gene bodies plus 5′ regions (distance between the closer end of the 5′ neighbor and the 3′ end of the gene of interest) and used a customized script to count SOX6/9 peaks embedded in these loci. As we had anticipated, the number of SOX6/9 peaks significantly correlated with the size of genetic loci (Figure 6A and B). The correlation was strong for SE-associated genes (Spearman's ranked correlation coefficient rs between 0.60 and 0.79) and moderate for genes associated only with TEs (rs between 0.40 and 0.59). Expectedly, the SOX peak density (number of SOX peaks per genetic locus length) was higher for SE-linked genes than for genes linked to TEs only (Figure 6C). In contrast, no significant correlation was found between RNA levels and either genetic locus lengths (Supplementary Figure S6A) or SOX6/9 peak numbers (Supplementary Figure S6B), whether genes were analyzed based on the presence of SEs or TEs only. We thus concluded that the density of SOX-bound enhancers, a characteristic of chondrocyte-specific SEs, likely underlies the expression level of genes rather than the absolute number of SOX-bound enhancers. This explains that large genetic loci, such as that of Acan, house more SEs than small genetic loci, such as that of Col2a1.
Figure 6.
Correlation between the number of SOX peaks and the size of genetic loci. Genes were sorted based on their association with SEs (A) or TEs only (B). Spearman's correlation coefficients (rs) are indicated. Graphs are divided into quadrants to help visualize the distribution of data points. (C) Comparison of the density of SOX peaks between genes linked to SEs and genes linked to TEs only. Red bars indicate mean values. Statistical analysis was done using the Student's t-test.
SOX trio-dependency of genes associated with SOX trio-bound super-enhancers
ChIP-seq data identified SOX peaks and SEs within and around several genes that had not been previously suggested or proven to be targets of the SOX trio. Vice versa, they also pointed to genes that did not exhibit SOX peaks and SEs in RCS cells, even though they had previously been proposed to be SOX9 targets. In view of these data and because binding of transcription factors to DNA suggests, but does not demonstrate functional consequences on gene expression, we performed RNA in situ hybridization assays in mice with the goal of determining whether these genes depend on the SOX trio for expression in the growth plate in vivo. We generated fetuses in which we induced inactivation of either Sox5/Sox6 or Sox9 in differentiated chondrocytes using an Acan enhancer-driven, doxycycline-inducible Cre-expression transgene (Sox9fl/flATC fetuses and Sox5fl/fl6fl/flATC fetuses). As expected, Sox5 and Sox6 were expressed robustly in control fetus growth plates, but not in the ATC domain in Sox5fl/fl6fl/flATC fetuses (Figure 7A). Downregulation of their RNA levels in Sox9fl/flATC growth plates concurred with ChIP-seq data to conclude that Sox5 and Sox6 are directly dependent upon SOX9 for expression in growth plate chondrocytes. Chst11 and Fgfr3 RNAs were abundant in control growth plate chondrocytes, but not in Sox5/6 or Sox9 mutant cells (Figure 7B). In contrast, Tacc3 RNA was detected at a low level in chondrocytes and adjacent cell types, and no significant difference was appreciable between control and mutant cells. Together with ChIP-seq profiles, these data thus strongly suggested that the SOX trio is directly involved in the high and specific expression of Fgfr3 and Chst11 in growth plate chondrocytes, and that the SE located between Fgfr3 and Tacc3 powerfully influences Fgfr3 expression, but not Tacc3 expression. As shown previously (17,18), Runx2 expression was upregulated in growth plate chondrocytes upon deletion of either Sox9 or Sox5/6 (Figure 7C). In contrast, Runx3 expression was reduced upon loss of SOX trio members. Since both genes featured SOX6/9-bound SEs, these data suggested that the SOX trio positively participates in Runx2 and Runx3 expression in growth plate chondrocytes, while being also involved in mechanisms keeping Runx2 expression in check in these cells. Consistent with previous reports (62,63), we found that Sox9 inactivation in limb bud mesenchyme using a Prx1Cre transgene (Sox9fl/flPrx1Cre) precluded skeletogenic progenitors from forming precartilaginous condensations and from expressing of Nkx3.2 (Figure 7D). Interestingly, Nkx3.2 expression was very low in wild-type growth plates and was not detectably changed upon inactivation of Sox5/6 or Sox9 (Figure 7E). Along with ChIP-seq data, these findings thus supported the concept that Nkx3.2 requires SOX9 for expression in prechondrocytes, but is not a significant target of the SOX trio in growth plate chondrocytes. Like Nkx3.2, Arid5a was expressed at a low level in growth plate chondrocytes and inactivation of SOX trio genes had no detectable effect (Figure 7F). Along with the presence of only small peaks for SOX6 and SOX9 and with the absence of SE at the level of Arid5a in RCS cells, these data led us to conclude that Arid5a is probably not a significant target of the SOX trio in growth plate chondrocytes. Altogether, these in vivo data functionally validated predictions made from ChIP-seq data in RCS cells by highlighting that only genes associated with SOX6/9-bound SE(s) were highly expressed and dependent upon the SOX trio in the growth plate.
Figure 7.
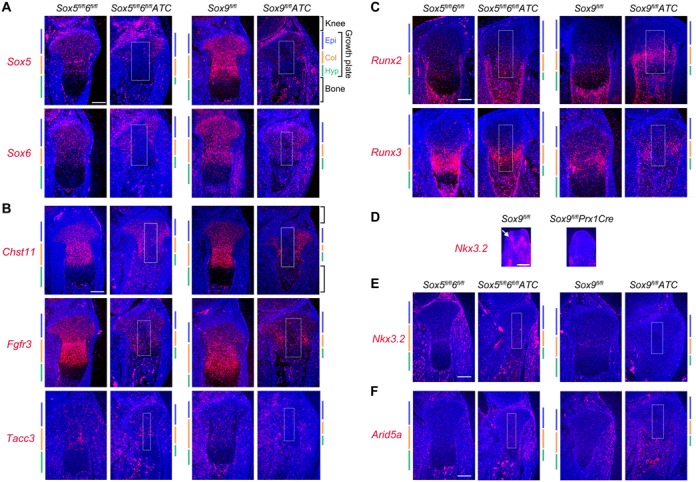
RNA in situ hybridization for candidate SOX trio targets in mutant mice. (A–C and E–F) Control fetuses (Sox5fl/fl6fl/fl and Sox9fl/fl) and mutant littermates (Sox5fl/fl6fl/fl ATC and Sox9fl/flATC, respectively) were treated with doxycycline from E13.5 to E16.5 to recombine the floxed alleles into null alleles. (D) Sox9fl/fl control and Sox9fl/flPrx1Cre mutant embryos were collected at E12.5. Sections were generated through tibia proximal growth plates (A–C and E–F) or through hind paws (D) and hybridized with RNA probes for the indicated genes. The growth plate region in which the ATC transgene is active is shown with a white box. The epiphyseal, columnar and hypertrophic zones of growth plates are indicated with colored bars. The white arrow in panel D points to a digital precartilaginous condensation. RNA signals are seen in red and cell nuclei (Hoechst staining of DNA) in blue. Scale bar is 100 μm (A–C and E–F) or 200 μm (D). All images are representative of data obtained in technical duplicates per experiment and using different embryos in at least two independent experiments.
SOX5 and SOX6 empower SOX9 to activate super-enhancer units
Our data so far have suggested that the SOX trio efficiently activates key cartilage identity genes through binding to SEs. Reporter assays constitute an important, complementary approach to further validate the impact that SOX protein binding to enhancers may have on gene expression. To perform such assays, we selected several genes of interest identified by our ChIP-seq data and picked region(s) displaying the most pronounced peaks for H3K27ac, SOX6 and SOX9 in their genetic locus (Figures 5 and 8A). Two of these regions were classified as TEs and the others as SE subunits. We cloned them in a reporter plasmid upstream of a minimally active Col2a1 promoter (48). When tested through transient transfection in RCS cells, all selected regions were able to act as enhancers (Figure 8B). Interestingly, the TEs regions were one to three orders of magnitude less potent than the SE subunits. To assess whether these enhancer activities could be mediated by the SOX trio, we co-transfected non-chondrocytic HEK-293 cells with the reporters and SOX expression plasmids (Figure 8C and Supplementary Figure S7). Importantly, the SOX trio proteins were unable to activate the TEs, but they acted cooperatively to activate all four SE subunits. Among the latter, the SE subunit located upstream of Fgfr3 was the most potent both in RCS cells and in SOX trio-overexpressing HEK-293 cells, followed by the Runx3 region. Taken together, these data added valuable support to the concept that the SOX trio activates key chondrocyte-specific genes by binding to SEs.
Figure 8.
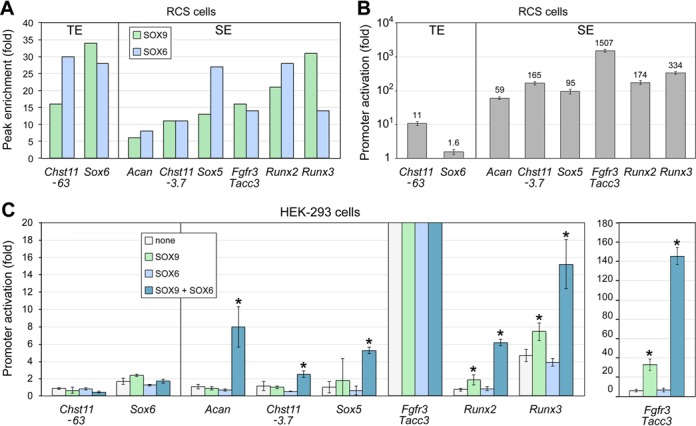
Functional test of SOX trio-bound enhancers. (A) Fold enrichment of SOX6 and SOX9 peaks associated with specific genes. Fold enrichment is calculated as the ratio of read counts obtained for SOX peaks and input samples. Regions corresponding to TEs are shown on the left and regions belonging to SEs are shown on the right. These regions are shown with red asterisks in Figure 5. (B) Reporter activities in RCS cells. Promoter activation folds achieved by enhancer regions were calculated by dividing the activities of reporter constructs containing a promoter and an enhancer region by the activities of constructs containing only a promoter. Data are presented as means with standard deviation of technical triplicates in an experiment representative of at least three independent experiments. (C) Reporter activities in HEK-293 cells forced to express no protein (none), SOX6 and/or SOX9. Data are presented as described in (B). Asterisks indicate the statistical significance of transactivation effects achieved by SOX proteins (P < 0.05).
DISCUSSION
This study has provided novel insights into the actions of the SOX5/6/9 chondrogenic trio. It has revealed that SOX6 and SOX9 often and most efficiently bind genomic sites near one another, but recognize distinct DNA motifs. The number of SOX-bound enhancers greatly varies from gene to gene, correlating in number with the size of genetic loci and in density with gene expression levels. The most remarkable targets of the SOX proteins are SEs associated with active cartilage-specific genes. These genes encode all essential cartilage extracellular matrix components, the SOX trio proteins themselves and key regulatory factors controlling the activity of the trio or their genes.
This study was carried out using RCS cells predominantly. These cells have been instrumental in many previous projects owing to their stable chondrocytic features, but with the caveat that their phenotype was incompletely characterized. The discovery made here that RCS cells are bona fide growth plate proliferating/prehypertrophic chondrocytes establishes them as an excellent tool to study mechanisms specific to the growth plate as well as mechanisms pertaining to all cartilage types. Since growth plate chondrocytes quickly proceed through maturation steps and since wild-type chondrocytes quickly dedifferentiate in culture, one can predict that the faithful growth plate phenotype of RCS cells is stabilized by specific mutations that the cells have acquired during or following their oncogenic transformation and during their chondrogenic selection in vitro (75). Beyond validating RCS cells as a solid experimental model, the complete transcriptome profile of RCS cells and the ChIP-seq data generated here will certainly be resourceful in the future to further decipher cartilage-specific pathways.
The concept that SOX5/6 and SOX9 work together to effect chondrogenesis was proposed years ago based on results from mutant mouse analyses and molecular assays limited to a few genes (6,19,21,76–78). The present study institutes this concept at the whole-genome scale. SOX6 and SOX9 bind thousands of genomic sites and they do so most efficiently when they bind together to the same enhancers. Previous biochemical assays failed to detect physical contacts between SOX5/6 and SOX9, possibly because they were performed in the absence of a DNA target long enough to reconstitute enhanceosomes (6). One can thus predict that close binding on DNA helps the SOX proteins adopt configurations that allow them to interact with one another or with other partners and that they thereby form stable chondrocyte-specific enhanceosomes. As we found that only two-thirds of SOX9 peaks were associated with SOX6 peaks, one could ask whether the remaining SOX9 peaks were associated with SOX5 peaks. This possibility cannot be presently ruled out, but we believe that the answer is no. SOX5 and SOX6 are indeed highly similar proteins and they display virtually identical DNA-binding and transactivation properties in vitro (6,7). Moreover, the ability of each protein to compensate effectively for the loss of the other in knockout mice strongly suggests that the proteins are largely redundant in chondrocytes and thus that they alternate in the wild-type for binding to genomic sites (19). In contrast to the large number of SEs bound by both SOX6 and SOX9, only a few SEs were bound solely by SOX9 or SOX6. This strongly suggests that the SOX trio proteins fulfill most of their main transcriptional functions in differentiated chondrocytes in concert rather than independently of one another.
All SOX proteins bind with high affinity in vitro to motifs matching or closely resembling the C[A/T]TTG[A/T][A/T] sequence (79). ChIP-seq experiments have defined motifs frequently bound by SOX proteins in vivo that are consistent with this consensus. For instance, SOX2 preferentially binds CATTGTT in embryonic stem cells (80); SOX11 selects the [A/T]TTG motif in mantle cell lymphoma (81); and the SOX6 targets AACAATGG motifs in skeletal myotubes (28). Intriguingly, SOX9 was found to bind DNA motifs in hair follicle progenitors that do not resemble the SOX consensus (66). Using RCS cells and primary chondrocytes, Oh et al. identified a best motif for SOX9 in chondrocytes that matches the top-ranking motifs found in SOX9 peaks in our study (22). Both studies expand, at the genome scale, the model previously proposed that SOX9 homodimers bind to genomic targets presenting as pairs of inverted SOX sites separated by 3–5 nt (21,56,57). The actual motifs preferentially bound by SOX6 in the genome appear to be distinct from the SOX9 motif and variable. De novo motif analyses proposed an A-rich motif as a first choice and a single-SOX site as a second choice. Complementary EMSAs and reporter assays performed here and in previous studies concur to indicate that SOX6 requires a pair of SOX or SOX-like motifs rather than a single-SOX motif for efficient binding to target gene regulatory sequences. Close analyses of the SE sequences bound by SOX6 and SOX9 and cooperatively activated by these proteins have strengthened this notion and revealed that SOX6 is likely to bind to its genomic targets at pairs of tandem SOX or SOX-like motifs. The paired motifs may either overlap with each other or be separated by a few nucleotides. High flexibility in SOX motif sequence and in pair arrangement likely explains that de novo motif software identified A-rich motifs and single-SOX motifs in SOX6 peaks rather a more defined SOX6-specific motif. CentriMo found central enrichment for the single-SOX motif, but not for the A-rich motif. Close analysis of sequences revealed that SOX9 motifs were often centrally enriched in SOX6 peaks (as well as in SOX9 peaks) and often contained single-SOX motifs. The central enrichment of the single-SOX motif was thus likely contributed by both SOX6 and SOX9. The fact that A-rich motifs were selected by CentriMo based on sequence matches to the de novo motif identified by MEME-ChIP rather than based on actual fitness to the SOX consensus motif may explain why such motifs were not centrally enriched in SOX peaks. The reason why SOX6 is a more accommodating DNA-binding protein than SOX9 may rely on the protein structures. SOX9 has its dimerization domain directly adjacent to its DNA-binding domain (56). This proximity of the two domains likely explains why the two SOX sites can only be 3–5 bp apart in the SOX9 consensus motif. This sequence arrangement places the SOX9 dimer subunits on the same side of the DNA helix, which is likely optimal for protein dimerization. SOX5 and SOX6, in contrast, have their primary coiled-coil dimerization domain >250 residues away from their SOX domain, and their secondary (weaker) coiled-coil domain >60 residues away (6). These features likely allow for great flexibility in the distance between SOX-binding sites recognized by the protein dimers on DNA. Differences reported in other studies for the preferred DNA motifs bound by SOX6 and SOX9 in non-chondrocytic lineages could be due to the methods used to generate and analyze the data. We cannot exclude, however, that they might also be due to true differences between cell types, differences that would likely be imposed by cell type-specific transcriptional partners.
SOX9 and SOX5/6 form a trio that is not only necessary, but also sufficient for chondrogenesis. Their unique ability among SOX proteins to bind DNA as homodimers might waive their need for non-SOX partners to bind DNA efficiently, a mechanism that appears otherwise universal among SOX proteins (79). DNA motif analyses of SOX6 and SOX9 peaks, however, suggest that the transcriptional activities of the SOX trio might be dependent, or at least modulated, by RUNT, zinc-finger and FOX proteins. FOX proteins are pioneer factors that open chromatin at specific genetic loci in several lineages (82,83). Several FOX proteins, namely FOXC1 and FOXC2, are expressed in chondroprogenitors and are critical for skeletogenesis (84–87). These proteins might thus have pioneer functions in these cells. They might act together with the SOX trio, since SOX9 was proposed to act as a pioneer in hair follicle stem cells (30). The presence of RUNT domain binding sites in SOX trio enhancer targets was also described by Oh et al. (22). Zhou et al. (88) showed that RUNX2 and SOX9 interfere with one another in reporter assays in vitro, and they proposed that this mechanism might contribute to the respective abilities of SOX9 and RUNX2 to inhibit and promote growth plate chondrocyte maturation. Together, these data suggest that RUNX2/3 might compete with the SOX trio on cartilage-specific targets. Alternatively, since the SOX trio is actually necessary for chondrocyte maturation, RUNX2/3 might cooperate with the SOX trio proteins, at least on a subset of enhancers, to render the peak of expression observed for many early-chondrocyte markers in proliferating/early-prehypertrophic chondrocytes.
Several groups have put forward the notion that SOX9 might directly repress genes and might have opposite effects at distinct chondrocyte differentiation stages. For instance, SOX9 was proposed to repress Col10a1 in non-hypertrophic chondrocytes (24) but to activate it in prehypertrophic cells (17). SOX5/6 act mainly as repressors in the melanocyte, neuronal and oligodendrocyte lineages, and achieve this action by competing with SOX9 for binding to cis-acting elements (25,26). SOX6 also acts as a repressor in erythroid cells and skeletal myocytes (27,29). We found, however, that SOX6 and SOX9 are rarely associated with histone signatures of transrepression in RCS cells, and we did not detect binding of the proteins within and around Col10a1 and other genes previously proposed to be direct targets of SOX9 at chondrocyte differentiation stages not modeled by RCS cells. This finding is consistent with our finding that SOX9 binds to its recognition motif in the Col10a1 promoter only upon induction of chondrocyte hypertrophy (17). Together, these data thus strongly suggest that the primary role of the SOX trio in growth plate chondrocytes is to transactivate genes.
Our novel observation that RCS cells possess hundreds of SEs and that most of these SEs are bound by the SOX trio and are linked to chondrocyte-specific genes consolidates the notion, so far supported by only a few examples, that such enhancers are hubs for master transcription factors and control key cell identity genes. It is believed that the clustering of enhancers, which defines SEs, allows these enhancers to act synergistically. Our data have also raised the new concept that SEs contain at least one enhancer that is particularly powerful, up to several orders of magnitude stronger than TEs. This finding suggests that this master enhancer might act as a catalyzer for the establishment of super-enhanceosomes and calls for complementary studies to fully decode the mechanisms that functionally distinguish SEs from TEs.
We showed that several cartilage-specific genes are linked to very large SOX-bound SEs or multiple typical SOX-bound enhancers, totaling up to two dozens enhancers. This prompts a question on the need for so many enhancers. As explained above, this enhancer multiplicity may underlie the robustness of SE-mediated gene activation. In addition, we showed that the number of SOX-bound enhancers correlates with the length of genetic loci and that, rather than conferring stronger gene expression, large numbers of SOX-bound enhancers could be necessary to ensure efficient expression of genes embedded in large genetic loci. Multiplication of enhancers might also have occurred evolutionarily to guarantee suitable gene expression even if one enhancer were mutated or to guarantee proper gene expression modulation at specific times and in various locations. Supporting this idea, we recently showed that the Sox9 genetic locus comprises several SOX trio-bound enhancers that display differential activity patterns during chondrocyte differentiation (49) and that deletion of one of the Sox9 SEs affected the Sox9 expression level, but not enough to cause a major disease (60).
The present study broadened evidence that the SOX trio directly controls the genes for all major components of the cartilage extracellular matrix, and it also newly uncovered numerous relationships between the SOX trio and key regulatory genes in cartilage. These targets include Fgfr3. As Sox9 expression was shown to be upregulated by FGFR3 signaling (89,90), our finding suggests the existence of a positive regulatory loop between SOX9 and FGFR3. This loop could contribute to explain that the expression of Sox9 and many of its targets culminates along with that of Fgfr3 in lower columnar/prehypertrophic chondrocytes. Our data also strongly suggest that Runx2 and Runx3 expression is positively controlled by the SOX trio in the growth plate. These data contrast with the upregulation of Runx2 that occurs upon inactivation of the SOX genes in this tissue, and which reflects the switch of growth plate chondrocytes to the osteoblast lineage (17,18). RUNX2 has two hats as a master skeletal transcription factor: it acts (along with RUNX3) to drive growth plate chondrocyte maturation and it is also required (without RUNX3) for osteoblast differentiation. Runx2 expression might be under distinct regulatory mechanisms in these two lineages. The SOX trio might ensure Runx2 (and Runx3) expression in chondrocytes while at the same time repressing osteoblastic mechanisms, namely through blocking canonical/WNT signaling (17). As explained earlier, our data suggest that RUNX2/3 and the SOX trio might cooperatively activate some chondrocyte-specific genes. In this context, the existence of feedback positive loops between their genes would not be surprising. Last but not least, data shown here have newly substantiated the notion that the SOX trio targets its own genes. This finding was expected based on evidence that other master transcription factors directly regulate their own gene expression and based on indirect in vitro and in vivo data suggesting this important property for the SOX trio (15,49,60,61). We recently described four enhancers that are located in the 350-kb genomic domain upstream of Sox9 and that are active at overlapping times during chondrocyte differentiation (49,60). The present study suggests that additional enhancers, both further upstream and downstream of Sox9, might also participate in Sox9 expression in chondrocytes. This result is consistent with evidence that campomelic dysplasia can be caused by chromosomal translocations occurring beyond the 350-kb domain located upstream of SOX9 or downstream of SOX9 (91). The Sox9 gene, like other cartilage genes, including Sox5 and Sox6, is thus likely to be controlled by complex, overlapping mechanisms, including auto-regulation.
In conclusion, this study has significantly increased knowledge of the actions of the SOX5/6/9 chondrogenic trio and it has newly uncovered molecular links in the chondrogenesis regulatory network. It has also raised new questions for future investigations. For instance, it has set a framework for complementary studies to further dissect the actions of the SOX trio at distinct stages of chondrocyte differentiation, in distinct types of cartilage and in other cell lineages. It also invites further studies to uncover transcription factors that are likely to functionally interact positively or negatively with the SOX trio in chondrocyte-specific super-enhanceosomes.
Supplementary Material
Acknowledgments
We thank Pallavi Bhattaram, Daniel Factor, Kenji Kato, Steven Lietman, Paul Tesar and Baojin Yao for scientific insights and suggestions throughout the study; Abhilash Gadi for technical help; Tracy Ballock for supplying neonatal rats; and the Strand NGS support team for providing generous advice.
SUPPLEMENTARY DATA
Supplementary Data are available at NAR Online.
FUNDING
NIAMS [R01-AR46249, R01-AR60016 to V.L.]; Lerner Research Institute Morgenthaler Postdoctoral Fellowship (to C.F.L.). Funding for open access charge: Cleveland Clinic.
Conflict of interest statement. None declared.
REFERENCES
- 1.Kobayashi T., Kronenberg H.M. Overview of skeletal development. Methods Mol. Biol. 2014;1130:3–12. doi: 10.1007/978-1-62703-989-5_1. [DOI] [PubMed] [Google Scholar]
- 2.Kozhemyakina E., Lassar A.B., Zelzer E. A pathway to bone: signaling molecules and transcription factors involved in chondrocyte development and maturation. Development. 2015;142:817–831. doi: 10.1242/dev.105536. [DOI] [PMC free article] [PubMed] [Google Scholar]
- 3.Long F., Ornitz D.M. Development of the endochondral skeleton. Cold Spring Harb. Perspect. Biol. 2013;5:a008334. doi: 10.1101/cshperspect.a008334. [DOI] [PMC free article] [PubMed] [Google Scholar]
- 4.Warman M.L., Cormier-Daire V., Hall C., Krakow D., Lachman R., LeMerrer M., Mortier G., Mundlos S., Nishimura G., Rimoin D.L., et al. Nosology and classification of genetic skeletal disorders: 2010 revision. Am. J. Med. Genet. A. 2011;155:943–968. doi: 10.1002/ajmg.a.33909. [DOI] [PMC free article] [PubMed] [Google Scholar]
- 5.Musumeci G., Aiello F.C., Szychlinska M.A., Di Rosa M., Castrogiovanni P., Mobasheri A. Osteoarthritis in the XXIst century: risk factors and behaviours that influence disease onset and progression. Int. J. Mol. Sci. 2015;16:6093–6112. doi: 10.3390/ijms16036093. [DOI] [PMC free article] [PubMed] [Google Scholar]
- 6.Lefebvre V., Li P., de Crombrugghe B. A new long form of Sox5 (L-Sox5), Sox6 and Sox9 are coexpressed in chondrogenesis and cooperatively activate the type II collagen gene. EMBO J. 1998;17:5718–5733. doi: 10.1093/emboj/17.19.5718. [DOI] [PMC free article] [PubMed] [Google Scholar]
- 7.Hiraoka Y., Ogawa M., Sakai Y., Kido S., Aiso S. The mouse Sox5 gene encodes a protein containing the leucine zipper and the Q box. Biochim. Biophys. Acta. 1998;1399:40–46. doi: 10.1016/s0167-4781(98)00086-4. [DOI] [PubMed] [Google Scholar]
- 8.Kamachi Y., Kondoh H. Sox proteins: regulators of cell fate specification and differentiation. Development. 2013;140:4129–4144. doi: 10.1242/dev.091793. [DOI] [PubMed] [Google Scholar]
- 9.Lefebvre V. The SoxD transcription factors–Sox5, Sox6, and Sox13–are key cell fate modulators. Int. J. Biochem. Cell. Biol. 2010;42:429–432. doi: 10.1016/j.biocel.2009.07.016. [DOI] [PMC free article] [PubMed] [Google Scholar]
- 10.Akiyama H., Lefebvre V. Unraveling the transcriptional regulatory machinery in chondrogenesis. J. Bone Miner. Metab. 2011;29:390–395. doi: 10.1007/s00774-011-0273-9. [DOI] [PMC free article] [PubMed] [Google Scholar]
- 11.Zhao Q., Eberspaecher H., Lefebvre V., De Crombrugghe B. Parallel expression of Sox9 and Col2a1 in cells undergoing chondrogenesis. Dev. Dyn. 1997;209:377–386. doi: 10.1002/(SICI)1097-0177(199708)209:4<377::AID-AJA5>3.0.CO;2-F. [DOI] [PubMed] [Google Scholar]
- 12.Ng L.J., Wheatley S., Muscat G.E., Conway-Campbell J., Bowles J., Wright E., Bell D.M., Tam P.P., Cheah K.S., Koopman P. SOX9 binds DNA, activates transcription, and coexpresses with type II collagen during chondrogenesis in the mouse. Dev. Biol. 1997;183:108–121. doi: 10.1006/dbio.1996.8487. [DOI] [PubMed] [Google Scholar]
- 13.Wagner T., Wirth J., Meyer J., Zabel B., Held M., Zimmer J., Pasantes J., Bricarelli F.D., Keutel J., Hustert E., et al. Autosomal sex reversal and campomelic dysplasia are caused by mutations in and around the SRY-related gene SOX9. Cell. 1994;79:1111–1120. doi: 10.1016/0092-8674(94)90041-8. [DOI] [PubMed] [Google Scholar]
- 14.Foster J.W., Dominguez-Steglich M.A., Guioli S., Kwok C., Weller P.A., Stevanovic M., Weissenbach J., Mansour S., Young I.D., Goodfellow P.N., et al. Campomelic dysplasia and autosomal sex reversal caused by mutations in an SRY-related gene. Nature. 1994;372:525–530. doi: 10.1038/372525a0. [DOI] [PubMed] [Google Scholar]
- 15.Akiyama H., Chaboissier M.C., Martin J.F., Schedl A., de Crombrugghe B. The transcription factor Sox9 has essential roles in successive steps of the chondrocyte differentiation pathway and is required for expression of Sox5 and Sox6. Genes Dev. 2002;16:2813–2828. doi: 10.1101/gad.1017802. [DOI] [PMC free article] [PubMed] [Google Scholar]
- 16.Henry S.P., Liang S., Akdemir K.C., de Crombrugghe B. The postnatal role of Sox9 in cartilage. J. Bone Miner. Res. 2012;27:2511–2525. doi: 10.1002/jbmr.1696. [DOI] [PMC free article] [PubMed] [Google Scholar]
- 17.Dy P., Wang W., Bhattaram P., Wang Q., Wang L., Ballock R.T., Lefebvre V. Sox9 directs hypertrophic maturation and blocks osteoblast differentiation of growth plate chondrocytes. Dev. Cell. 2012;22:597–609. doi: 10.1016/j.devcel.2011.12.024. [DOI] [PMC free article] [PubMed] [Google Scholar]
- 18.Smits P., Dy P., Mitra S., Lefebvre V. Sox5 and Sox6 are needed to develop and maintain source, columnar, and hypertrophic chondrocytes in the cartilage growth plate. J. Cell Biol. 2004;164:747–758. doi: 10.1083/jcb.200312045. [DOI] [PMC free article] [PubMed] [Google Scholar]
- 19.Smits P., Li P., Mandel J., Zhang Z., Deng J.M., Behringer R.R., de Crombrugghe B., Lefebvre V. The transcription factors L-Sox5 and Sox6 are essential for cartilage formation. Dev. Cell. 2001;1:277–290. doi: 10.1016/s1534-5807(01)00003-x. [DOI] [PubMed] [Google Scholar]
- 20.Dy P., Smits P., Silvester A., Penzo-Mendez A., Dumitriu B., Han Y., de la Motte C.A., Kingsley D.M., Lefebvre V. Synovial joint morphogenesis requires the chondrogenic action of Sox5 and Sox6 in growth plate and articular cartilage. Dev. Biol. 2010;341:346–359. doi: 10.1016/j.ydbio.2010.02.024. [DOI] [PMC free article] [PubMed] [Google Scholar]
- 21.Han Y., Lefebvre V. L-Sox5 and Sox6 drive expression of the aggrecan gene in cartilage by securing binding of Sox9 to a far-upstream enhancer. Mol. Cell. Biol. 2008;28:4999–5013. doi: 10.1128/MCB.00695-08. [DOI] [PMC free article] [PubMed] [Google Scholar]
- 22.Oh C.D., Lu Y., Liang S., Mori-Akiyama Y., Chen D., de Crombrugghe B., Yasuda H. SOX9 regulates multiple genes in chondrocytes, including genes encoding ECM proteins, ECM modification enzymes, receptors, and transporters. PLoS One. 2014;9:e107577. doi: 10.1371/journal.pone.0107577. [DOI] [PMC free article] [PubMed] [Google Scholar]
- 23.Oh C.D., Maity S.N., Lu J.F., Zhang J., Liang S., Coustry F., de Crombrugghe B., Yasuda H. Identification of SOX9 interaction sites in the genome of chondrocytes. PLoS One. 2010;5:e10113. doi: 10.1371/journal.pone.0010113. [DOI] [PMC free article] [PubMed] [Google Scholar]
- 24.Leung V.Y., Gao B., Leung K.K., Melhado I.G., Wynn S.L., Au T.Y., Dung N.W., Lau J.Y., Mak A.C., Chan D., et al. SOX9 governs differentiation stage-specific gene expression in growth plate chondrocytes via direct concomitant transactivation and repression. PLoS Genet. 2011;7:e1002356. doi: 10.1371/journal.pgen.1002356. [DOI] [PMC free article] [PubMed] [Google Scholar]
- 25.Stolt C.C., Lommes P., Hillgartner S., Wegner M. The transcription factor Sox5 modulates Sox10 function during melanocyte development. Nucleic Acids Res. 2008;36:5427–5440. doi: 10.1093/nar/gkn527. [DOI] [PMC free article] [PubMed] [Google Scholar]
- 26.Stolt C.C., Schlierf A., Lommes P., Hillgartner S., Werner T., Kosian T., Sock E., Kessaris N., Richardson W.D., Lefebvre V., et al. SoxD proteins influence multiple stages of oligodendrocyte development and modulate SoxE protein function. Dev. Cell. 2006;11:697–709. doi: 10.1016/j.devcel.2006.08.011. [DOI] [PubMed] [Google Scholar]
- 27.Yi Z., Cohen-Barak O., Hagiwara N., Kingsley P.D., Fuchs D.A., Erickson D.T., Epner E.M., Palis J., Brilliant M.H. Sox6 directly silences epsilon globin expression in definitive erythropoiesis. PLoS Genet. 2006;2:e14. doi: 10.1371/journal.pgen.0020014. [DOI] [PMC free article] [PubMed] [Google Scholar]
- 28.An C.I., Dong Y., Hagiwara N. Genome-wide mapping of Sox6 binding sites in skeletal muscle reveals both direct and indirect regulation of muscle terminal differentiation by Sox6. BMC Dev. Biol. 2011;11:59. doi: 10.1186/1471-213X-11-59. [DOI] [PMC free article] [PubMed] [Google Scholar]
- 29.Quiat D., Voelker K.A., Pei J., Grishin N.V., Grange R.W., Bassel-Duby R., Olson E.N. Concerted regulation of myofiber-specific gene expression and muscle performance by the transcriptional repressor Sox6. Proc. Natl. Acad. Sci. U.S.A. 2011;108:10196–10201. doi: 10.1073/pnas.1107413108. [DOI] [PMC free article] [PubMed] [Google Scholar]
- 30.Adam R.C., Yang H., Rockowitz S., Larsen S.B., Nikolova M., Oristian D.S., Polak L., Kadaja M., Asare A., Zheng D., et al. Pioneer factors govern super-enhancer dynamics in stem cell plasticity and lineage choice. Nature. 2015;521:366–370. doi: 10.1038/nature14289. [DOI] [PMC free article] [PubMed] [Google Scholar]
- 31.Whyte W.A., Orlando D.A., Hnisz D., Abraham B.J., Lin C.Y., Kagey M.H., Rahl P.B., Lee T.I., Young R.A. Master transcription factors and mediator establish super-enhancers at key cell identity genes. Cell. 2013;153:307–319. doi: 10.1016/j.cell.2013.03.035. [DOI] [PMC free article] [PubMed] [Google Scholar]
- 32.Hnisz D., Abraham B.J., Lee T.I., Lau A., Saint-Andre V., Sigova A.A., Hoke H.A., Young R.A. Super-enhancers in the control of cell identity and disease. Cell. 2013;155:934–947. doi: 10.1016/j.cell.2013.09.053. [DOI] [PMC free article] [PubMed] [Google Scholar]
- 33.King K.B., Kimura J.H. The establishment and characterization of an immortal cell line with a stable chondrocytic phenotype. J. Cell. Biochem. 2003;89:992–1004. doi: 10.1002/jcb.10571. [DOI] [PubMed] [Google Scholar]
- 34.Dy P., Han Y., Lefebvre V. Generation of mice harboring a Sox5 conditional null allele. Genesis. 2008;46:294–299. doi: 10.1002/dvg.20392. [DOI] [PMC free article] [PubMed] [Google Scholar]
- 35.Dumitriu B., Dy P., Smits P., Lefebvre V. Generation of mice harboring a Sox6 conditional null allele. Genesis. 2006;44:219–224. doi: 10.1002/dvg.20210. [DOI] [PubMed] [Google Scholar]
- 36.Kist R., Schrewe H., Balling R., Scherer G. Conditional inactivation of Sox9: a mouse model for campomelic dysplasia. Genesis. 2002;32:121–123. doi: 10.1002/gene.10050. [DOI] [PubMed] [Google Scholar]
- 37.Logan M., Martin J.F., Nagy A., Lobe C., Olson E.N., Tabin C.J. Expression of Cre Recombinase in the developing mouse limb bud driven by a Prxl enhancer. Genesis. 2002;33:77–80. doi: 10.1002/gene.10092. [DOI] [PubMed] [Google Scholar]
- 38.Anders S., Huber W. Differential expression analysis for sequence count data. Genome Biol. 2010;11:R106. doi: 10.1186/gb-2010-11-10-r106. [DOI] [PMC free article] [PubMed] [Google Scholar]
- 39.Park J.S., Ma W., O'Brien L.L., Chung E., Guo J.J., Cheng J.G., Valerius M.T., McMahon J.A., Wong W.H., McMahon A.P. Six2 and Wnt regulate self-renewal and commitment of nephron progenitors through shared gene regulatory networks. Dev. Cell. 2012;23:637–651. doi: 10.1016/j.devcel.2012.07.008. [DOI] [PMC free article] [PubMed] [Google Scholar]
- 40.Feng J., Liu T., Qin B., Zhang Y., Liu X.S. Identifying ChIP-seq enrichment using MACS. Nat. Protoc. 2012;7:1728–1740. doi: 10.1038/nprot.2012.101. [DOI] [PMC free article] [PubMed] [Google Scholar]
- 41.Huang W., Loganantharaj R., Schroeder B., Fargo D., Li L. PAVIS: a tool for peak annotation and visualization. Bioinformatics. 2013;29:3097–3099. doi: 10.1093/bioinformatics/btt520. [DOI] [PMC free article] [PubMed] [Google Scholar]
- 42.Bailey T.L., Boden M., Buske F.A., Frith M., Grant C.E., Clementi L., Ren J., Li W.W., Noble W.S. MEME SUITE: tools for motif discovery and searching. Nucleic Acids Res. 2009;37:W202–W208. doi: 10.1093/nar/gkp335. [DOI] [PMC free article] [PubMed] [Google Scholar]
- 43.Bailey T.L., Machanick P. Inferring direct DNA binding from ChIP-seq. Nucleic Acids Res. 2012;40:e128. doi: 10.1093/nar/gks433. [DOI] [PMC free article] [PubMed] [Google Scholar]
- 44.McLeay R.C., Bailey T.L. Motif Enrichment Analysis: a unified framework and an evaluation on ChIP data. BMC Bioinformatics. 2010;11:165. doi: 10.1186/1471-2105-11-165. [DOI] [PMC free article] [PubMed] [Google Scholar]
- 45.Heinz S., Benner C., Spann N., Bertolino E., Lin Y.C., Laslo P., Cheng J.X., Murre C., Singh H., Glass C.K. Simple combinations of lineage-determining transcription factors prime cis-regulatory elements required for macrophage and B cell identities. Mol. Cell. 2010;38:576–589. doi: 10.1016/j.molcel.2010.05.004. [DOI] [PMC free article] [PubMed] [Google Scholar]
- 46.Bhattaram P., Penzo-Mendez A., Kato K., Bandyopadhyay K., Gadi A., Taketo M.M., Lefebvre V. SOXC proteins amplify canonical WNT signaling to secure nonchondrocytic fates in skeletogenesis. J. Cell Biol. 2014;207:657–671. doi: 10.1083/jcb.201405098. [DOI] [PMC free article] [PubMed] [Google Scholar]
- 47.Ducy P., Zhang R., Geoffroy V., Ridall A.L., Karsenty G. Osf2/Cbfa1: a transcriptional activator of osteoblast differentiation. Cell. 1997;89:747–754. doi: 10.1016/s0092-8674(00)80257-3. [DOI] [PubMed] [Google Scholar]
- 48.Lefebvre V., Zhou G., Mukhopadhyay K., Smith C.N., Zhang Z., Eberspaecher H., Zhou X., Sinha S., Maity S.N., de Crombrugghe B. An 18-base-pair sequence in the mouse proalpha1(II) collagen gene is sufficient for expression in cartilage and binds nuclear proteins that are selectively expressed in chondrocytes. Mol. Cell. Biol. 1996;16:4512–4523. doi: 10.1128/mcb.16.8.4512. [DOI] [PMC free article] [PubMed] [Google Scholar]
- 49.Yao B., Wang Q., Liu C.F., Bhattaram P., Li W., Mead T.J., Crish J.F., Lefebvre V. The SOX9 upstream region prone to chromosomal aberrations causing campomelic dysplasia contains multiple cartilage enhancers. Nucleic Acids Res. 2015;43:5394–5408. doi: 10.1093/nar/gkv426. [DOI] [PMC free article] [PubMed] [Google Scholar]
- 50.Mukhopadhyay K., Lefebvre V., Zhou G., Garofalo S., Kimura J.H., de Crombrugghe B. Use of a new rat chondrosarcoma cell line to delineate a 119-base pair chondrocyte-specific enhancer element and to define active promoter segments in the mouse pro-alpha 1(II) collagen gene. J. Biol. Chem. 1995;270:27711–27719. doi: 10.1074/jbc.270.46.27711. [DOI] [PubMed] [Google Scholar]
- 51.Shinomura T., Ito K., Hook M., Kimura J.H. A newly identified enhancer element responsible for type II collagen gene expression. J. Biochem. 2012;152:565–575. doi: 10.1093/jb/mvs110. [DOI] [PubMed] [Google Scholar]
- 52.Bosserhoff A.K., Kondo S., Moser M., Dietz U.H., Copeland N.G., Gilbert D.J., Jenkins N.A., Buettner R., Sandell L.J. Mouse CD-RAP/MIA gene: structure, chromosomal localization, and expression in cartilage and chondrosarcoma. Dev. Dyn. 1997;208:516–525. doi: 10.1002/(SICI)1097-0177(199704)208:4<516::AID-AJA7>3.0.CO;2-L. [DOI] [PubMed] [Google Scholar]
- 53.Fernandes R.J., Schmid T.M., Harkey M.A., Eyre D.R. Incomplete processing of type II procollagen by a rat chondrosarcoma cell line. Eur. J. Biochem. 1997;247:620–624. doi: 10.1111/j.1432-1033.1997.00620.x. [DOI] [PubMed] [Google Scholar]
- 54.Zou W., Chen X., Shim J.H., Huang Z., Brady N., Hu D., Drapp R., Sigrist K., Glimcher L.H., Jones D. The E3 ubiquitin ligase Wwp2 regulates craniofacial development through mono-ubiquitylation of Goosecoid. Nat. Cell Biol. 2011;13:59–65. doi: 10.1038/ncb2134. [DOI] [PMC free article] [PubMed] [Google Scholar]
- 55.Nakamura Y., Yamamoto K., He X., Otsuki B., Kim Y., Murao H., Soeda T., Tsumaki N., Deng J.M., Zhang Z., et al. Wwp2 is essential for palatogenesis mediated by the interaction between Sox9 and mediator subunit 25. Nat. Commun. 2011;2:251. doi: 10.1038/ncomms1242. [DOI] [PMC free article] [PubMed] [Google Scholar]
- 56.Sock E., Pagon R.A., Keymolen K., Lissens W., Wegner M., Scherer G. Loss of DNA-dependent dimerization of the transcription factor SOX9 as a cause for campomelic dysplasia. Hum. Mol. Genet. 2003;12:1439–1447. doi: 10.1093/hmg/ddg158. [DOI] [PubMed] [Google Scholar]
- 57.Bridgewater L.C., Walker M.D., Miller G.C., Ellison T.A., Holsinger L.D., Potter J.L., Jackson T.L., Chen R.K., Winkel V.L., Zhang Z., et al. Adjacent DNA sequences modulate Sox9 transcriptional activation at paired Sox sites in three chondrocyte-specific enhancer elements. Nucleic Acids Res. 2003;31:1541–1553. doi: 10.1093/nar/gkg230. [DOI] [PMC free article] [PubMed] [Google Scholar]
- 58.Kluppel M., Wight T.N., Chan C., Hinek A., Wrana J.L. Maintenance of chondroitin sulfation balance by chondroitin-4-sulfotransferase 1 is required for chondrocyte development and growth factor signaling during cartilage morphogenesis. Development. 2005;132:3989–4003. doi: 10.1242/dev.01948. [DOI] [PubMed] [Google Scholar]
- 59.Hu G., Codina M., Fisher S. Multiple enhancers associated with ACAN suggest highly redundant transcriptional regulation in cartilage. Matrix Biol. 2012;31:328–337. doi: 10.1016/j.matbio.2012.06.001. [DOI] [PMC free article] [PubMed] [Google Scholar]
- 60.Mead T.J., Wang Q., Bhattaram P., Dy P., Afelik S., Jensen J., Lefebvre V. A far-upstream (-70 kb) enhancer mediates Sox9 auto-regulation in somatic tissues during development and adult regeneration. Nucleic Acids Res. 2013;41:4459–4469. doi: 10.1093/nar/gkt140. [DOI] [PMC free article] [PubMed] [Google Scholar]
- 61.Kumar D., Lassar A.B. The transcriptional activity of Sox9 in chondrocytes is regulated by RhoA signaling and actin polymerization. Mol. Cell. Biol. 2009;29:4262–4273. doi: 10.1128/MCB.01779-08. [DOI] [PMC free article] [PubMed] [Google Scholar]
- 62.Zeng L., Kempf H., Murtaugh L.C., Sato M.E., Lassar A.B. Shh establishes an Nkx3.2/Sox9 autoregulatory loop that is maintained by BMP signals to induce somitic chondrogenesis. Genes Dev. 2002;16:1990–2005. doi: 10.1101/gad.1008002. [DOI] [PMC free article] [PubMed] [Google Scholar]
- 63.Yamashita S., Andoh M., Ueno-Kudoh H., Sato T., Miyaki S., Asahara H. Sox9 directly promotes Bapx1 gene expression to repress Runx2 in chondrocytes. Exp. Cell Res. 2009;315:2231–2240. doi: 10.1016/j.yexcr.2009.03.008. [DOI] [PMC free article] [PubMed] [Google Scholar]
- 64.Amano K., Hata K., Muramatsu S., Wakabayashi M., Takigawa Y., Ono K., Nakanishi M., Takashima R., Kogo M., Matsuda A., et al. Arid5a cooperates with Sox9 to stimulate chondrocyte-specific transcription. Mol. Biol. Cell. 2011;22:1300–1311. doi: 10.1091/mbc.E10-07-0566. [DOI] [PMC free article] [PubMed] [Google Scholar]
- 65.Miyaki S., Sato T., Inoue A., Otsuki S., Ito Y., Yokoyama S., Kato Y., Takemoto F., Nakasa T., Yamashita S., et al. MicroRNA-140 plays dual roles in both cartilage development and homeostasis. Genes Dev. 2010;24:1173–1185. doi: 10.1101/gad.1915510. [DOI] [PMC free article] [PubMed] [Google Scholar]
- 66.Kadaja M., Keyes B.E., Lin M., Pasolli H.A., Genander M., Polak L., Stokes N., Zheng D., Fuchs E. SOX9: a stem cell transcriptional regulator of secreted niche signaling factors. Genes Dev. 2014;28:328–341. doi: 10.1101/gad.233247.113. [DOI] [PMC free article] [PubMed] [Google Scholar]
- 67.Nakamura Y., He X., Kato H., Wakitani S., Kobayashi T., Watanabe S., Iida A., Tahara H., Warman M.L., Watanapokasin R., et al. Sox9 is upstream of microRNA-140 in cartilage. Appl. Biochem. Biotechnol. 2012;166:64–71. doi: 10.1007/s12010-011-9404-y. [DOI] [PMC free article] [PubMed] [Google Scholar]
- 68.Tuddenham L., Wheeler G., Ntounia-Fousara S., Waters J., Hajihosseini M.K., Clark I., Dalmay T. The cartilage specific microRNA-140 targets histone deacetylase 4 in mouse cells. FEBS Lett. 2006;580:4214–4217. doi: 10.1016/j.febslet.2006.06.080. [DOI] [PubMed] [Google Scholar]
- 69.Rozenblatt-Rosen O., Mosonego-Ornan E., Sadot E., Madar-Shapiro L., Sheinin Y., Ginsberg D., Yayon A. Induction of chondrocyte growth arrest by FGF: transcriptional and cytoskeletal alterations. J. Cell Sci. 2002;115:553–562. doi: 10.1242/jcs.115.3.553. [DOI] [PubMed] [Google Scholar]
- 70.Yao R., Natsume Y., Noda T. TACC3 is required for the proper mitosis of sclerotome mesenchymal cells during formation of the axial skeleton. Cancer Sci. 2007;98:555–562. doi: 10.1111/j.1349-7006.2007.00433.x. [DOI] [PMC free article] [PubMed] [Google Scholar]
- 71.Yoshida C.A., Yamamoto H., Fujita T., Furuichi T., Ito K., Inoue K., Yamana K., Zanma A., Takada K., Ito Y., et al. Runx2 and Runx3 are essential for chondrocyte maturation, and Runx2 regulates limb growth through induction of Indian hedgehog. Genes Dev. 2004;18:952–963. doi: 10.1101/gad.1174704. [DOI] [PMC free article] [PubMed] [Google Scholar]
- 72.Storm E.E., Kingsley D.M. GDF5 coordinates bone and joint formation during digit development. Dev. Biol. 1999;209:11–27. doi: 10.1006/dbio.1999.9241. [DOI] [PubMed] [Google Scholar]
- 73.Settle S.H. Jr, Rountree R.B., Sinha A., Thacker A., Higgins K., Kingsley D.M. Multiple joint and skeletal patterning defects caused by single and double mutations in the mouse Gdf6 and Gdf5 genes. Dev. Biol. 2003;254:116–130. doi: 10.1016/s0012-1606(02)00022-2. [DOI] [PubMed] [Google Scholar]
- 74.Rhee D.K., Marcelino J., Baker M., Gong Y., Smits P., Lefebvre V., Jay G.D., Stewart M., Wang H., Warman M.L., et al. The secreted glycoprotein lubricin protects cartilage surfaces and inhibits synovial cell overgrowth. J. Clin. Invest. 2005;115:622–631. doi: 10.1172/JCI200522263. [DOI] [PMC free article] [PubMed] [Google Scholar]
- 75.Stevens J.W., Patil S.R., Jordan D.K., Kimura J.H., Morcuende J.A. Cytogenetics of swarm rat chondrosarcoma. Iowa Orthop. J. 2005;25:135–140. [PMC free article] [PubMed] [Google Scholar]
- 76.Bi W., Deng J.M., Zhang Z., Behringer R.R., de Crombrugghe B. Sox9 is required for cartilage formation. Nat. Genet. 1999;22:85–89. doi: 10.1038/8792. [DOI] [PubMed] [Google Scholar]
- 77.Szenasi T., Kenesi E., Nagy A., Molnar A., Balint B.L., Zvara A., Csabai Z., Deak F., Boros Olah B., Mates L., et al. Hmgb1 can facilitate activation of the matrilin-1 gene promoter by Sox9 and L-Sox5/Sox6 in early steps of chondrogenesis. Biochim. Biophys. Acta. 2013;1829:1075–1091. doi: 10.1016/j.bbagrm.2013.07.004. [DOI] [PubMed] [Google Scholar]
- 78.Yamashita S., Miyaki S., Kato Y., Yokoyama S., Sato T., Barrionuevo F., Akiyama H., Scherer G., Takada S., Asahara H. L-Sox5 and Sox6 proteins enhance chondrogenic miR-140 microRNA expression by strengthening dimeric Sox9 activity. J. Biol. Chem. 2012;287:22206–22215. doi: 10.1074/jbc.M112.343194. [DOI] [PMC free article] [PubMed] [Google Scholar]
- 79.Kondoh H., Kamachi Y. SOX-partner code for cell specification: Regulatory target selection and underlying molecular mechanisms. Int. J. Biochem. Cell Biol. 2010;42:391–399. doi: 10.1016/j.biocel.2009.09.003. [DOI] [PubMed] [Google Scholar]
- 80.Chen X., Xu H., Yuan P., Fang F., Huss M., Vega V.B., Wong E., Orlov Y.L., Zhang W., Jiang J., et al. Integration of external signaling pathways with the core transcriptional network in embryonic stem cells. Cell. 2008;133:1106–1117. doi: 10.1016/j.cell.2008.04.043. [DOI] [PubMed] [Google Scholar]
- 81.Kuo P.Y., Leshchenko V.V., Fazzari M.J., Perumal D., Gellen T., He T., Iqbal J., Baumgartner-Wennerholm S., Nygren L., Zhang F., et al. High-resolution chromatin immunoprecipitation (ChIP) sequencing reveals novel binding targets and prognostic role for SOX11 in mantle cell lymphoma. Oncogene. 2014;34:1231–1240. doi: 10.1038/onc.2014.44. [DOI] [PMC free article] [PubMed] [Google Scholar]
- 82.Zaret K.S., Watts J., Xu J., Wandzioch E., Smale S.T., Sekiya T. Pioneer factors, genetic competence, and inductive signaling: programming liver and pancreas progenitors from the endoderm. Cold Spring Harb. Symp. Quant. Biol. 2008;73:119–126. doi: 10.1101/sqb.2008.73.040. [DOI] [PMC free article] [PubMed] [Google Scholar]
- 83.Cuesta I., Zaret K.S., Santisteban P. The forkhead factor FoxE1 binds to the thyroperoxidase promoter during thyroid cell differentiation and modifies compacted chromatin structure. Mol. Cell. Biol. 2007;27:7302–7314. doi: 10.1128/MCB.00758-07. [DOI] [PMC free article] [PubMed] [Google Scholar]
- 84.Kume T., Deng K.Y., Winfrey V., Gould D.B., Walter M.A., Hogan B.L. The forkhead/winged helix gene Mf1 is disrupted in the pleiotropic mouse mutation congenital hydrocephalus. Cell. 1998;93:985–996. doi: 10.1016/s0092-8674(00)81204-0. [DOI] [PubMed] [Google Scholar]
- 85.Inman K.E., Purcell P., Kume T., Trainor P.A. Interaction between Foxc1 and Fgf8 during mammalian jaw patterning and in the pathogenesis of syngnathia. PLoS Genet. 2013;9:e1003949. doi: 10.1371/journal.pgen.1003949. [DOI] [PMC free article] [PubMed] [Google Scholar]
- 86.Kume T., Jiang H., Topczewska J.M., Hogan B.L. The murine winged helix transcription factors, Foxc1 and Foxc2, are both required for cardiovascular development and somitogenesis. Genes Dev. 2001;15:2470–2482. doi: 10.1101/gad.907301. [DOI] [PMC free article] [PubMed] [Google Scholar]
- 87.Yoshida M., Hata K., Takashima R., Ono K., Nakamura E., Takahata Y., Murakami T., Iseki S., Takano-Yamamoto T., Nishimura R., et al. The transcription factor Foxc1 is necessary for Ihh-Gli2-regulated endochondral ossification. Nat. Commun. 2015;6:6653. doi: 10.1038/ncomms7653. [DOI] [PubMed] [Google Scholar]
- 88.Zhou G., Zheng Q., Engin F., Munivez E., Chen Y., Sebald E., Krakow D., Lee B. Dominance of SOX9 function over RUNX2 during skeletogenesis. Proc. Natl. Acad. Sci. U.S.A. 2006;103:19004–19009. doi: 10.1073/pnas.0605170103. [DOI] [PMC free article] [PubMed] [Google Scholar]
- 89.Zhou Z.Q., Ota S., Deng C., Akiyama H., Hurlin P.J. Mutant activated FGFR3 impairs endochondral bone growth by preventing SOX9 downregulation in differentiating chondrocytes. Hum. Mol. Genet. 2014;24:1764–1773. doi: 10.1093/hmg/ddu594. [DOI] [PMC free article] [PubMed] [Google Scholar]
- 90.Murakami S., Balmes G., McKinney S., Zhang Z., Givol D., de Crombrugghe B. Constitutive activation of MEK1 in chondrocytes causes Stat1-independent achondroplasia-like dwarfism and rescues the Fgfr3-deficient mouse phenotype. Genes Dev. 2004;18:290–305. doi: 10.1101/gad.1179104. [DOI] [PMC free article] [PubMed] [Google Scholar]
- 91.Gordon C.T., Tan T.Y., Benko S., Fitzpatrick D., Lyonnet S., Farlie P.G. Long-range regulation at the SOX9 locus in development and disease. J. Med. Genet. 2009;46:649–656. doi: 10.1136/jmg.2009.068361. [DOI] [PubMed] [Google Scholar]
Associated Data
This section collects any data citations, data availability statements, or supplementary materials included in this article.