

Abstract
CAPZB is an actin-capping protein that caps the growing end of F-actin and modulates the cytoskeleton and tethers actin filaments to the Z-line of the sarcomere in muscles. Whole-genome sequencing was performed on a subject with micrognathia, cleft palate and hypotonia that harbored a de novo, balanced chromosomal translocation that disrupts the CAPZB gene. The function of capzb was analyzed in the zebrafish model. capzb−/− mutants exhibit both craniofacial and muscle defects that recapitulate the phenotypes observed in the human subject. Loss of capzb affects cell morphology, differentiation and neural crest migration. Differentiation of both myogenic stem cells and neural crest cells requires capzb. During palate morphogenesis, defective cranial neural crest cell migration in capzb−/− mutants results in loss of the median cell population, creating a cleft phenotype. capzb is also required for trunk neural crest migration, as evident from melanophores disorganization in capzb−/− mutants. In addition, capzb over-expression results in embryonic lethality. Therefore, proper capzb dosage is important during embryogenesis, and regulates both cell behavior and tissue morphogenesis.
Introduction
The dynamic actin cytoskeleton mediates diverse cellular processes, including cell morphology, migration, cell differentiation, cytokinesis, endocytosis and epithelial-mesenchymal transformation (1). The cytoskeleton also produces intracellular mechanical forces that impact morphogenesis (1–3). Cytoskeletal defects that accrue through genetic or environmental factors can result in aberrant cellular movements and produce congenital malformations (4–6). However, the relative contribution of the cytoskeleton to cellular functions may vary widely between different cell types.
Orofacial clefts such as clefts of the lip and/or palate are among the most common congenital malformations, and represent nearly one-half of all craniofacial anomalies (7,8). Indeed, 1% of infants born worldwide each year exhibit some form of facial dysmorphology. Several lines of evidence indicate that a strong genetic component underlies isolated clefts, and a variety of approaches, including chromosomal rearrangements and genome-wide association studies (9–14), have been employed to identify genes and loci implicated in cleft pathogenesis. The application of next-generation sequencing to large-scale studies of chromosomal rearrangements has brought an unprecedented era of gene discovery (10,15–18). This rapid pace of genetic association with clinical phenotypes has resulted in a critical need for robust, high-throughput validation methods that provide mechanistic insight.
We and others have shown that zebrafish, Danio rerio, can be used effectively to model human craniofacial anomalies (19–21). Gene expression, cell lineage tracing and functional studies suggest that the zebrafish ethmoid plate is developmentally analogous to the amniote primary palate (19,22). Given the central role of the actin cytoskeleton in various cellular processes that regulate cell shape and cell movements, we sought to determine whether regulation of actin localization translates to craniofacial morphogenesis.
Organization of the actin cytoskeleton is partly under the spatial and temporal control of actin-binding proteins (ABP) that regulate the assembly and disassembly of actin filaments, mainly by sequestering globular (G)-actin and depolymerizing filamentous (F)-actin (23). The actin capping protein CAPZ is found in all eukaryotes. It is a heterodimer of α and β subunits and caps the fast-growing (barbed) end of actin filaments (24,25). In muscles, CAPZβ is first localized to the Z-disk of the sarcomere, after which it nucleates filament formation and plays an important role in normal muscle development (26,27). In humans, CAPZB (OMIM# 601572) has been mapped to the short arm of chromosome 1 [cytogenetic location: 1p36.13, 19 665 267–19 812 066 (GRCh37/hg19)]. CAPZB is highly expressed in pharyngeal arch (PA) 1, a conserved embryonic structure that develops into the palate and lower jaw structures during the fourth and fifth weeks of human development (28).
capzb loss of function (LOF) in capzb−/− mice is known to result in embryonic lethality (https://www.sanger.ac.uk/resources/mouse/). Moreover, transgenic mice overexpressing capzb show myofibrillar disarray, cardiac hypertrophy, and early death (29). cpb−/− Drosophila die during early larval development (30). Furthermore, the macrochaetae in viable trans-heterozygous adult fruit flies are known to be uniformly shorter and rougher. The cpb LOF results in an abnormal accumulation of actin that eventually results in cell death and retinal tissue degeneration (31).
In this study, we report a human subject (designated DGAP198) where phenotypes of micrognathia, cleft palate and hypotonia are associated with a balanced chromosomal abnormality (BCA) that disrupts CAPZB. In order to gain biological insight into CAPZB function in craniofacial development, we examined a capzb zebrafish mutant and investigated the role of capzb during embryogenesis and palatal morphogenesis.
Results
Subject with craniofacial anomalies and hypotonia exhibits LOF of CAPZB
A 6-month-old female with congenital cleft palate, micrognathia and muscular hypotonia, was enrolled in the Developmental Genome Anatomy Project (DGAP, https://dgap.harvard.edu) as DGAP198 (Fig. 1A). The cleft palate was repaired around 1 year of age. DGAP198 also exhibited developmental delay, and feeding and respiratory issues. Her ears were mildly low set and rotated posteriorly. The subject did not exhibit other phenotypes, had a normal renal ultrasound, ophthalmological exam, cardiac echocardiogram and no hearing loss. A high-resolution GTG-banded karyotype detected a BCA between the short arm of chromosome 1 (in 1p36.1) and the long arm of chromosome 13 (in 13q12.1) with an initial karyotype of 46,XX,t(1;13)(p36.1;q12.1), for which the translocation was determined to be de novo (Fig. 1B and C).
Figure 1.

(A). Photograph of DGAP198 at 6 months of age showing micrognathia. (B). GTG-banded normal chromosomes 1 and 13 and der(1) and der(13) chromosomes identified in DGAP198's karyotype. (C). Ideogram of the BCA of DGAP198. Asterisks identify the derivative chromosomes in the ideogram. (D). Breakpoint in chromosome 1 is in the second intron of CAPZB. Arrows mark position of the primers used for qPCR. (E). qRT-PCR expression of CAPZB in the patient and control lymphoblastoid cell lines, using primers spanning the breakpoint. CAPZB transcripts are ∼50% reduced in the patient compared with control.
Whole-genome sequencing using a customized large-insert jumping library method was performed to an average physical coverage of 150× genome-wide which resulted in a revision of the karyotype to 46,XX,t(1;13)(p36.13;q12.11)dn. The chromosomes 1 and 13 breakpoints showed a loss of 3026 and 3151 bp from chr1: 19 731 464 to chr1: 19 734 491 and chr13: 22 056 275 to chr13: 22 059 427, respectively. The chromosome 1 breakpoint (chr1: 19 731 464) disrupted the second intron of CAPZB (Fig. 1D); no gene was disrupted on chromosome 13. Analysis of the three-dimensional genome organization (32) in a 6 Mb window surrounding the breakpoints of both chromosomes 1 and 13 did not reveal any additional genes for which further investigation was indicative of a potential role in the DGAP198 phenotype (Supplementary Material, Fig. S1). Array CGH revealed one genomic imbalance, a 22.8 kb deletion at 2p22.3 [34 840 514–34 863 332 (NCBI build 36.1/hg18)], which was found to be a non-genic region and interpreted not to be of clinical significance.
Quantitative reverse transcription-polymerase chain reaction (qRT-PCR) performed to investigate expression of CAPZB in lymphoblastoid cell lines showed that CAPZB exhibited a ∼50% reduction of wild-type mRNA expression compared with control samples (Fig. 1E) suggesting that the subject's phenotype was caused by LOF of CAPZB. Four additional cases were identified in the DECIPHER database (https://decipher.sanger.ac.uk/; DECIPHER 1803, 249937, 254939) and published literature (33) with deletions including CAPZB. Three of the four cases were female and all displayed muscular hypotonia, intellectual disability and a range of craniofacial malformations including micrognathia, microcephaly, high palate, abnormal nasal bridge, hypoplastic nasal alae and short philtrum (Table 1).
Table 1.
Summary of subjects with chromosomal deletions encompassing CAPZB and associated craniofacial malformations identified from the DECIPHER database and the literature
| Reference and subject identifier | Start–Stop (hg19) | Size (Mb) | Heredity | Craniofacial malformations | Hypotonia |
|---|---|---|---|---|---|
| DECIPHER 1803 distal | 18382579–19879460 | 1.5 | Unknown | High palate, micrognathia, prominent nasal bridge | Yes |
| DECIPHER 249937 | 19023845–19899537 | 0.88 | Unknown | Abnormality of nasal bridge, wide mouth | Yes |
| DECIPHER 254939 | 15325975–21141171 | 5.82 | de novo constitutional | High palate, hypoplastic nasal alae, microcephaly, short philtrum, prominent metopic ridge | No |
| Kang et al. (33), Case 1 | 9124551–21782714 | 12.7 | Unknown | Micrognathia, microcephaly, ridging of metopic and coronal sutures, short columella | Yes |
capzb is widely expressed during zebrafish embryogenesis
RNA in situ hybridization experiments showed that capzb transcripts are maternally inherited (Fig. 2A and B) and ubiquitously expressed from the one-cell stage through 72 h post-fertilization (hpf), with strong expression in the somites at 24 hpf (Fig. 2C–E and H). At 48 and 72 hpf, capzb expression was most prominent in the PAs and in the fin buds (Fig. 2F, G, I and J). In situ hybridization experiments carried out with the capzb sense probe produced no staining at any developmental stage or in any larval tissue (Supplementary Material, Fig. S2).
Figure 2.
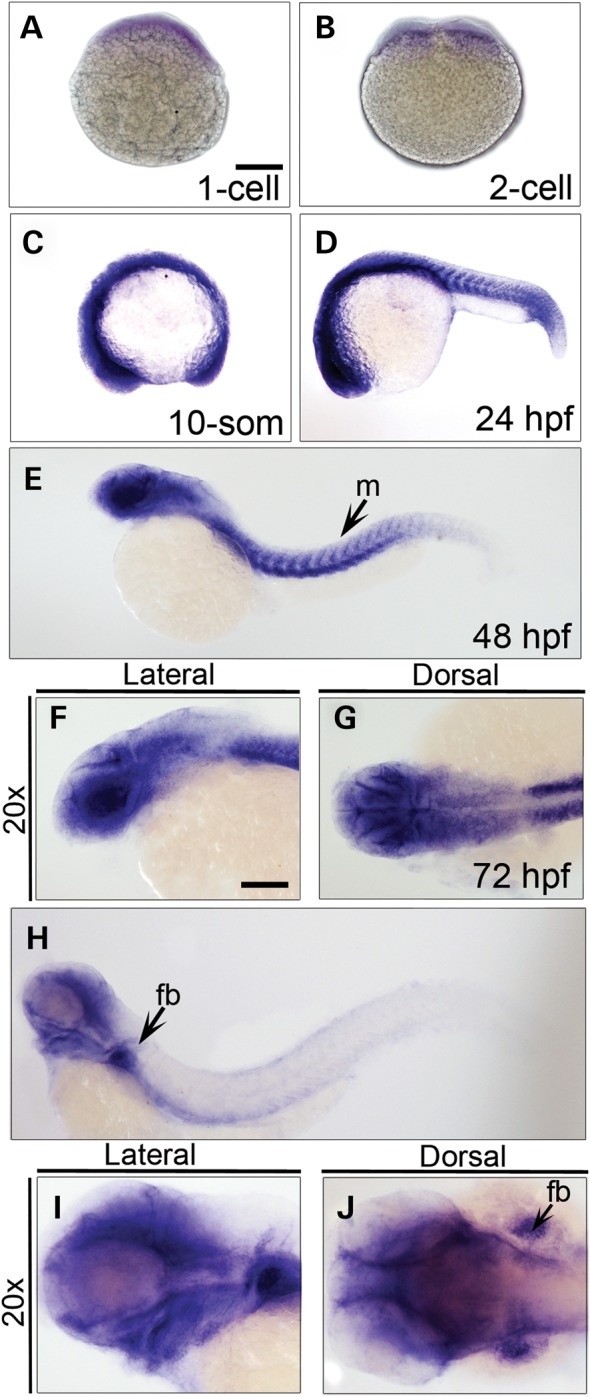
Spatiotemporal expression of zebrafish capzb during embryogenesis. Images of whole-mount embryos from one-cell stage (A) to 72 hpf (H). Strong expression was observed in the muscles (m) and the fin bud (fb) at 48 hpf (E) and 72 hpf (H), respectively. capzb was expressed ubiquitously in the craniofacial region at 48 and 72 hpf (F, G, I and J). Scale bars: 500 μm (A–E and H) and 250 μm (F, G, I and J), respectively.
Loss of capzb leads to micrognathia and cleft phenotype in zebrafish
To analyze the capzb function in zebrafish, a mutant line, capzbhi1858bTg/+ was examined (34–36), (Supplementary Material, Fig. S3A and B), where a retrovirus integrated 272 bp within the second intron. A number of morphological anomalies were observed in a capzbhi1858bTg/+ intercross. Starting from 65 hpf, the mutants developed microcephaly (Supplementary Material, Fig. S3C and D) and smaller body size; thereafter, they became increasingly immobile, displayed little spontaneous swimming, were insensitive to touch, and died by 4.5 days post-fertilization (dpf). Genotype-phenotype correlations confirmed that the phenotypes were present in capzbhi1858bTg/hi1858bTg homozygotes (Supplementary Material, Fig. S3E). Expression analysis by qRT-PCR performed in capzbhi1858bTg/hi1858bTg embryos demonstrated ∼95% reduction of capzb mRNA level in capzbhi1858bTg/hi1858bTg (hereafter referred to as capzb−/−) mutants compared with wild-type embryos (Supplementary Material, Fig. S3F), confirming that the phenotypes were caused by capzb LOF. The capzb heterozygotes developed normally in embryonic and larval stages and only subtle phenotypes were observed in adulthood (Supplementary Material, Fig. S4).
Alcian blue staining revealed that capzb−/− mutants exhibited hypoplastic craniofacial structures with the lower jaw being shorter and retrusive (Fig. 3A, B, F and G). Examination of the craniofacial structures demonstrated that the Meckel's cartilage of capzb−/− mutants was also hypoplastic (Fig. 3C and H) and the ethmoid plate (hereafter, palate) had an absence of the median element, resembling a cleft (Fig. 3D and I). The leading edge of the palate in capzb−/− mutants was dysmorphic and rounded, failing to adopt a fan-like shape when compared with the wild-type palate, and the median chondrocytes that are derived from the frontonasal prominence (FNP) were decreased in number, contributing to the cleft phenotype. Thus, zebrafish capzb mutants present with cleft and micrognathia phenotypes analogous to those in DGAP198.
Figure 3.

Craniofacial cartilage and muscles in capzb−/− mutants. Wild-type craniofacial structures (A, lateral; B, ventral), flat mount of the lower jaw (C) and the dissected palate (D) are shown. capzb−/− mutants (F–I) have a shorter lower jaw (F–H) and an anterior cleft in the palate (I, black arrow). Craniofacial muscles, observed with anti-myosin heavy chain (MHC) staining, are malformed in the capzb−/− mutants (J) compared with wild-type (E). Injection of wild-type full-length capzb mRNA into capzb+/− intercross rescued the phenotypes (K–O). (P). Graph representing the efficiency of rescue with capzb mRNA injection and the lethality observed with overexpression of capzb mRNA by injection in wild-type embryos. The expected (exp.) and observed (obs.) number of embryos is on the y-axis. The different genotypes expected or observed after the injection are depicted on the stacked column: dotted (capzb+/−), solid (unrescued capzb−/−), white (rescued capzb−/−), shaded (wild-type) and gray (dead). The asterisk near the shaded (wild-type) column depicts very low percentage of wild-type survivors in injection into capzb+/− intercross. (Q). Length, width and length/width ratio of lower jaw (C, H and M, arrows) and palate (D, I and N, arrows) were measured in wild-type, capzb−/− and rescued capzb−/− embryos. The L of the lower jaw was measured from the joint between the Meckel's cartilage (m) to the joint between the ceratohyal (ch). Likewise the W was across the joints between the Meckel's cartilage (m) and the palatoquadrate (pq). L and L/W, lower jaw, *P < 0.0001 and **P < 0.0001. L, palate, *P < 0.0003 and **P < 0.0002. W, palate, *P < 0.0107 and **P < 0.0083. L/W, palate, *P < 0.0002 and **P < 0.0017. ns: non-significant. Scale bars: 500 μm (A–C, E–H and J–M) and 100 μm (D, I and N).
capzb mRNA injection rescues capzb mutants but causes morphologic defects in wild-type
To determine functionally whether the observed phenotypes were specific to the capzb LOF, full-length wild-type capzb mRNA was injected into capzb+/− intercrossed embryos. The micrognathia and cleft phenotypes were partially rescued in injected capzb−/− embryos (Fig. 3K–N and P, Table 2). To quantitatively compare the size of the lower jaw and palate, the length (L, μm), width (W, μm) and length/width ratio (L/W) of both the lower jaw and the palate were measured in wild-type, capzb−/− and rescued capzb−/− embryos (Fig. 3Q). While the L/W ratio ± SD (standard deviation) for the wild-type lower jaw was determined to be 1.06 ± 0.03 (n = 6), the lower jaw of capzb−/− embryos was significantly hypoplastic with a L/W ratio ± SD of 0.78 ± 0.04 (n = 6) (Fig. 3Q). The L/W ratio ± SD for the lower jaw of the rescued embryos was determined to be 1.03 ± 0.03 (n = 6), which was significantly higher from the capzb−/− embryos and comparable with the wild-type lower jaw (Fig. 3Q). Similarly, the L/W ratio ± SD for the palate of the rescued embryos was determined to be 1.09 ± 0.02 (n = 6), which was significantly higher from the capzb−/− embryos (L/W ratio ± SD = 1.02 ± 0.03, n = 6) and comparable with the wild-type palate (L/W ratio ± SD = 1.11 ± 0.02, n = 6) (Fig. 3Q).
Table 2.
Efficiency of phenotypic rescue in capzb mutants and lethality due to overexpression observed with injection of full-length capzb mRNA into capzbhi1858bTg/+ intercross and wild-type embryos, respectively
| Genotype Injections | Wild-type | +/− | −/− | Rescued −/− | Dead at 24 hpi | Rescue efficiency | % dead/inj. |
|---|---|---|---|---|---|---|---|
|
capzbhi1858bTg/+ intercross |
4a | 139 | 11 | 53 | 94 | 82.8 | 31.2 |
| Wild-type | 17 | NA | NA | NA | 220 | NA | 92.8b |
The efficiency of phenotypic rescue of capzb mutants is calculated as follows: [% (rescued −/−)/{(rescued −/−) + (−/−)}].
aDenotes very low number of wild-type survivors at 24 hpi.
bDenotes high lethality observed at 24 hpi with injection of capzb mRNA into wild-type embryos.
Interestingly, during the capzb mRNA rescue experiments, a high percentage of lethality in wild-type embryos was observed at 24 h post-injection (hpi) in the injected capzb+/− intercrosses (Fig. 3P, Table 2). Furthermore, when wild-type clutches were injected with capzb mRNA, only ∼8% of injected embryos survived past 24 hpi (Fig. 3P, Table 2). To control for mRNA toxicity, equal amounts of GFP mRNA were injected into capzb+/− intercrosses and wild-type embryos, and no excess lethality was observed (data not shown). Lower amounts of capzb mRNA injected into capzb+/− intercrosses did not rescue the micrognathia and cleft phenotypes in the injected capzb−/− embryos (data not shown).
Defective muscle development in capzb mutants
Analyses of craniofacial skeletal muscles at 4.5 dpf revealed severe malformations, that were efficiently rescued by injection of full-length capzb mRNA in capzb+/− intercross embryos (Fig. 3E, J and O). The trunk skeletal muscles were examined using Tg(acta1a:lifeact-GFP) reporter and were disorganized in capzb−/− mutants (Fig. 4A and D). Ultrastructure analysis using transmission electron microscopy (TEM) revealed extensive loss of muscle fibers in the capzb−/− mutants. Transverse cross-sections through the mutant trunk skeletal muscles showed the presence of fascicles (bundle of muscle fibers). However, the number of muscle fibers within each fascicle was highly reduced in the mutants compared with wild-type (Fig. 4B and E). Moreover, the space between two fascicles, known as the perimysium, was larger in capzb mutants (Fig. 4B and E). Longitudinal cross-sections of trunk muscles further revealed loss of the sarcomeric structure in the mutants, where the myofibrils rarely lay apposed to each other compared with wild-type (Fig. 4C and F). The loss of capzb thus leads to a developmental loss of structural integrity of muscle fibers, which correlates with the hypotonia phenotype in the human subject.
Figure 4.

capzb mutants show muscle disorganization. Confocal images of somites using Tg(acta1a:lifeact-GFP) expressing GFP in skeletal muscles under the control of an α-actin promoter reveal disorganization of the muscles in capzb mutants (D, asterisk, arrows), but not in wild-type embryos (A). Ultrastructure examination by TEM reveals extensive loss of muscle fibers (E, arrowheads) within the fascicles (bundle of muscle fibers) with a large perimysial space (E, asterisk) in mutants compared with the wild-type (B), in transverse cross-sections. Examination of longitudinal sections of trunk skeletal muscles reveals loss of structural integrity and disorganization of the sarcomeres in capzb mutants (C, arrowheads) compared with wild-type embryos (F). Pax7 immunohistochemistry on 65 hpf wild-type (n = 3) and capzb mutants (n = 3) (G–L). Somite number 13–15 (marked 1, 2, 3) was imaged in all samples, in blue (Hoechst) and green (Pax7) channels. Insets in each image show the region-of-interest (white boxes) in higher magnification. Arrowheads in the green and merge images depict both Pax7+ and Hoechst+ cells, which were counted for quantification. (M). The average number of Pax7+ and Hoechst+ cells/somite in 65 hpf capzb mutants (n = 9) is increased compared with the wild-type (n = 9). Somite number 13–15 (marked 1, 2, 3) was counted. *P < 0.0001. Scale bars: 20 μm (A, D, G–L), 2 μm (B and E), 500 nm (C and F), 5 μm (insets, G–L).
Regulation of muscle and neural crest differentiation
The muscle progenitor field as indicated by expression of the zebrafish homolog pax7a was expanded in capzb mutants (Fig. 4J–L) compared with wild-type (Fig. 4G–I). The average number of Pax7+ cells per somite (n = 9) in capzb mutants was determined to be 11 which was significantly higher than observed in the wild-type (6, n = 9). Simultaneously, qRT-PCR analysis showed that the expression of pax7a and its paralog pax3a was expanded in capzb mutants compared with wild-type (Supplementary Material, Fig. S5A). Concomitantly, transcript levels of myf5 and myogenin, markers of differentiated muscle cells, were reduced in mutants (Supplementary Material, Fig. S5A). To investigate whether pax3a and pax7a are also up-regulated in neural crest cells (NCCs), we sorted sox10+ (NCC-specific marker) cells by fluorescence-activated cell sorting and performed expression analysis of pax3a and pax7a. Transcript levels of both pax3a and pax7a were higher in NCCs of the capzb mutants (Supplementary Material, Fig. S5B).
Cellular F-actin localization and morphology are modulated by capzb
Lifeact is a versatile marker that stains F-actin structures in cells and tissues (37). We examined F-actin localization in the edge of the fin epidermis in a Tg(acta1a:lifeact-GFP) background at 60 and 72 hpf in capzb+/− intercrosses and in wild-type (Fig. 5A and B). At 60 hpf, F-actin was distributed evenly inside the fin epidermis cells in both capzb−/− mutants and wild-type (Fig. 5A and B, top panel). However, at 72 hpf, a distinct defect in the distribution of F-actin was observed in capzb−/− mutants compared with the wild-type (Fig. 5A and B, bottom panel), with the F-actin forming large foci in the mutants which was not observed in the wild-type.
Figure 5.
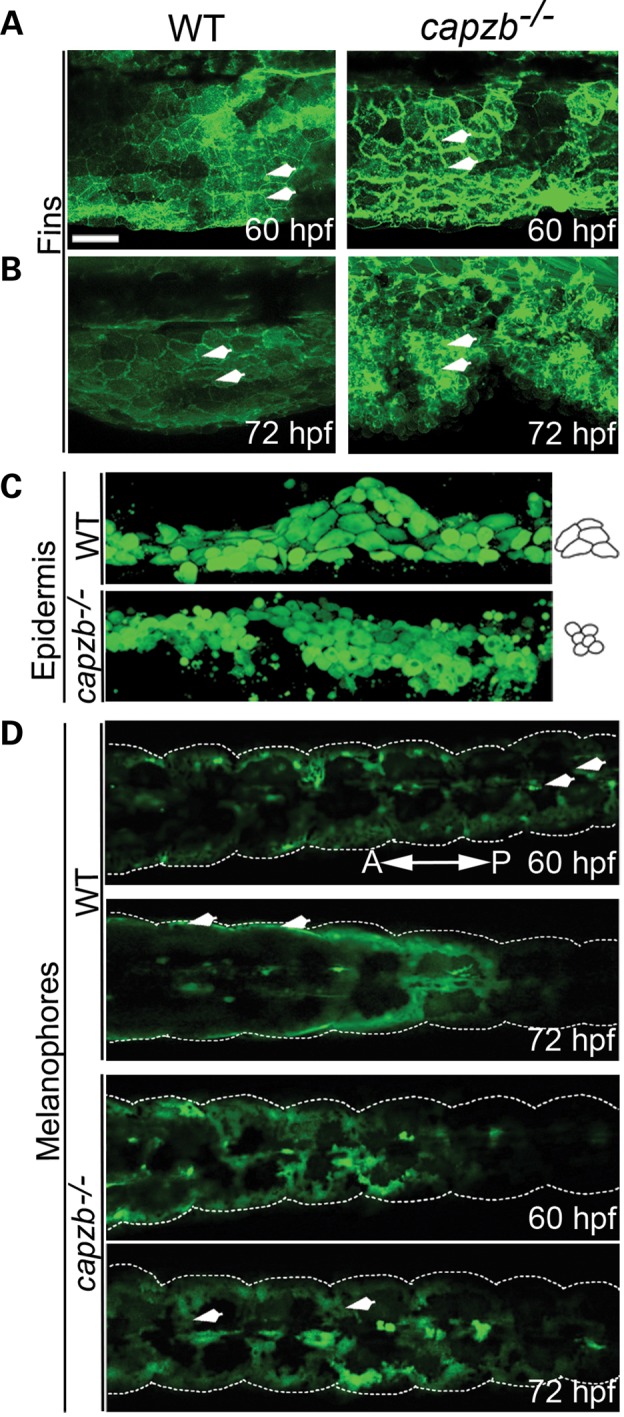
(A and B). Confocal images of fin epidermal cells of capzb−/− and wild-type embryos at 60 and 72 hpf, using a F-actin reporter transgenic line, Tg(acta1a:lifeact-GFP) reveals progressively excess F-actin deposition (arrowheads) in capzb mutants, but not in wild-type embryos. (C). Confocal images of epidermal cells (skin) using Tg(krt8:GFP) expressing GFP in the skin under the control of a skin-specific krt8 promoter reveal loss of cell morphology in capzb mutants, but not in wild-type embryos. Diagram on the right of the panel shows loss of cell shape in the mutants. (D). Confocal images taken in Tg(mitfa:GFP) reporter to observe melanocyte migration in mutants compared with the wild-type. At 60 hpf, the melanocytes in both the mutants and the wild-type are migrating comparably with slight defects observed in migration of the posterior stream of melanocytes (arrowheads). However, at 72 hpf, the migration of melanocytes is progressively defective. While the melanocytes in the wild-type have migrated laterally (arrowheads), they have failed to do so in the capzb mutants (arrowheads). Scale bars: 10 μm (A and B) and 20 μm (C and D).
The effect of capzb LOF on epidermal cell morphology was examined using the transgenic line Tg(krt8:GFP). Fluorescence imaging revealed that epidermal cells in capzb mutants are smaller and more rounded, unlike larger wild-type epidermal cells that maintain a defined, columnar shape (Fig. 5C).
Cell migration is defective in capzb−/− mutants
The migration of trunk neural crest cells (TNCCs) was examined using the Tg(mitfa:GFP) and Tg(ubi:Zebrabow;sox10:CreERt2) lines. mitfa is expressed in melanoblasts which are derivatives of TNCCs (38). We examined migration of the melanocytes in a Tg(mitfa:GFP) background at 60 and 72 hpf in capzb+/− intercrosses and in wild-type (Fig. 5D). At 60 hpf, migration of the melanocytes in the capzb−/− mutants and wild-type was comparable (Fig. 5D, 60 hpf). However, at 72 hpf, the normal patterning of melanocytes migration was observed to be aberrant in capzb mutants (Fig. 5D, 72 hpf). Instead of migrating in ‘streams’ medial to the middle of each somite, as in the wild-type, melanocytes in capzb−/− mutants were clustered at the edges of somites and failed to migrate to their correct lateral positions. This aberrant migration resulted in an altered larval pigment stripe pattern of melanocytes in capzb mutants. These observations were validated using the Tg(ubi:Zebrabow;sox10:CreERt2) reporter, where the NCCs are labeled as yellow or cyan after Cre-mediated recombination at 10-somites (39). The distribution of TNCCs appeared disorganized in capzb−/− mutants when compared with the wild-type (Supplementary Material, Fig. S5C). Given the broad expression domains of capzb during embryogenesis, these observations are consistent with requirement for capzb in muscle, neural crest and epithelial cells.
capzb deficiency does not affect cell proliferation or apoptosis during palatal morphogenesis
Cell proliferation during palatal morphogenesis was examined using pulse-chase cell labeling in the Tg(sox10:kaede) reporter (Fig. 6A) in capzb−/− mutants and wild-type controls. No difference in cell proliferation was detected in capzb−/− mutants compared with wild-type controls (Fig. 6B–E). Terminal deoxynucleotidyl transferase-dUTP nick end labeling (TUNEL) assays in capzb−/− mutants and wild-type controls, in the Tg(sox10:mcherry) background with the palate labeled red and apoptotic cells in green, revealed no increase in cell apoptosis in capzb−/− mutants compared with wild-type (Fig. 6F).
Figure 6.

(A) Diagram depicts pulse-chase assay using Tg(sox10:kaede) to investigate palatal cell proliferation. The distal tip of the palate is photoconverted from green to red at 65 hpf (pulse) with the contralateral side as control. Confocal images are obtained at 72 hpf after a chase of ∼7 h. Green cells added onto the distal part of the palate during the chase depict the proliferative front (marked). Both capzb−/− and wild-type embryos are pulsed at 65 hpf (D and B), chased and imaged again at 72 hpf (E and C). Palate is imaged in the green and the red channels (arrows) after both pulse and chase. No cell proliferation defects are observed in the mutant palate. (F). TUNEL assay performed in Tg(sox10:mcherry) shows no cell death (green) in mutant and wild-type palate. Scale bars: 20 μm (palate, B–F) and 250 μm (head, F).
Defective frontonasal process migration in capzb−/− mutants
Lineage analysis of migrating cranial neural crest cells (CNCCs), which eventually give rise to craniofacial structures, was performed from 24 to 72 hpf in capzb+/− intercrosses and in wild-type, using the Tg(sox10:kaede) reporter (Fig. 7A and D). At 60 hpf, labeled cells of the FNP migrated equivalently in capzb−/− mutants and in wild-type (Fig. 7B and E). However, at 72 hpf in capzb−/− mutants, labeled cells failed to migrate fully to the palate structure to contribute to the FNP (Fig. 7F), unlike wild-type in which FNP cells reached the forming palate structure and fused with the lateral maxillary prominences (Fig. 7C).
Figure 7.

Lineage tracing of cells constituting the FNP in the palate using Tg(sox10:kaede). CNCCs located anterior to the eyes (eyes outlined in white) are photoconverted at 14-somites and followed through crucial time points of palate morphogenesis, from 24 to 72 hpf in capzb−/− (D) and wild-type (A) embryos. Confocal images of the growing palate in mutants and wild-type obtained at 60 hpf (E and B) and 72 hpf (F and C) in both green and red channels. Green channel shows maxillary prominences while red channel shows photoconverted FNP, which fuses with the maxillary prominences to form the palate. At 60 hpf, both mutant and wild-type show the presence of migrating FNP cells in the palate (E and B, red channel). However, by 72 hpf, cells constituting the FNP fail to migrate in the palate of capzb−/− mutants (F, red channel) while they migrate correctly in wild-type controls (C, red channel). Diagrams in B, C, E and F depict this schematically. The migrating, photoconverted region is shown by white arrows. Scale bars: 250 μm (A and D) and 20 μm (B, C, E and F).
Discussion
Loss of function of CAPZB contributes to orofacial clefting
In this study, a human subject (DGAP198) was identified with a de novo, balanced chromosomal rearrangement, which led to a LOF of CAPZB, a gene encoding an F-actin capping protein. The subject exhibited craniofacial anomalies including cleft palate, micrognathia and hypotonia. The next-gen cytogenetic nomenclature (40) to describe the rearrangement at the nucleotide level is 46,XX,t(1;13)(p36.1;q12.1)dn.seq[GRCh37/hg19] t(1;13)(13qter->13q12.11(22 059 427)::GTAATGGGAACC::1p36.13(19 734 491)->1qter;13pter->13q12.11(22 056 27{5-1})::1p36.13(19 731 46{4-0})->1pter)dn. CAPZB maps to 1p36 in humans, where it is ∼19 Mb proximal to the 1p telomere. It is included in the 1p36 syndrome, one of the most common deletion syndromes known to have distinct craniofacial features, including orofacial clefts in 20–40% of cases (41). Moreover, CAPZB is highly expressed in PA1 during the fourth to fifth week of human development, when craniofacial structures are being formed (28), making it an excellent candidate gene for craniofacial malformations.
Additional genetic support for LOF of CAPZB as the cause of DGAP198's phenotypes is provided through four additional cases from the DECIPHER database and from published literature of subjects with deletions including CAPZB. Although these cases do not exhibit cleft palate, they do include a range of craniofacial abnormalities. The variable penetrance of human cleft palate in the context of CAPZB LOF may thus relate to the presence of specific modifier alleles in certain individuals, or reflect environmental or other factors. Moreover, all these cases harbor small chromosomal deletions, where CAPZB is not the only gene deleted, and where other loci may also contribute to the observed phenotypes. The multiple lines of genetic evidence suggest that deficiency of CAPZB is likely associated with the observed phenotypes, and we thus sought to perform biological validation in the zebrafish to confirm the impact of LOF of CAPZB and potentially provide insight into the pathogenic mechanism in DGAP198.
capzb is critical during zebrafish embryogenesis
Zebrafish capzb shares strong homology with human CAPZB, with 87.7% similarity at the protein sequence level. capzb is transmitted maternally and expressed ubiquitously throughout embryogenesis. Homozygous capzb−/− embryos are initially indistinguishable (under a light microscope) from wild-type or heterozygous siblings until ∼65 hpf. Previous studies in zebrafish show that maternal gene products also contribute to early embryonic development and patterning (42–44). It is likely that requirement for capzb is critical during zebrafish embryogenesis in all tissues. However, the ability of capzb−/− mutants to complete embryogenesis and live until 4.5 dpf presumably reflects the maternal contribution of the protein, which likely masks the effects of capzb deficiency at earlier stages of embryonic development. We posit that once the maternal contribution degrades, is diluted by cell division, or becomes insufficient to support development, in this case at ∼65 hpf, the mutant phenotypes in capzb−/− embryos begin to manifest, becoming progressively more severe over time.
Zebrafish model of capzb LOF
The capzbhi1858bTg allele is a genetic LOF, similar to the human subject's CAPZB BCA allele. Cartilage staining of capzb mutants shows that the loss of capzb results in a cleft phenotype and micrognathia. Craniofacial and trunk muscles in capzb−/− are malformed with a loss of sarcomere integrity, suggesting that inhibition of the barbed-end ABP, capzb, results in delayed organization of actin and loss of sarcomere structure. Taken together, these studies show that capzb mutants exhibit phenotypes analogous to those of DGAP198, and support the identification of CAPZB as the causal gene. The specificity of the phenotypes observed due to capzb LOF is confirmed by successful phenotypic rescue of homozygous mutants by injection of full-length capzb mRNA.
capzb regulates cell differentiation and morphology
Because capzb RNA is robustly expressed in somites throughout embryogenesis and the muscles are highly malformed in capzb mutants, we examined whether muscle progenitor fields were altered in the mutants. Myogenesis proceeds with correct specification of muscle progenitor cells by myogenic transcription factors (such as PAX3, PAX7, Myf5, MyoD and myogenin) (45). Myogenic progenitor fields are indeed altered in the mutants, where the loss of capzb maintains the muscle cells in an undifferentiated progenitor state and inhibits cell differentiation during myogenesis. Apart from the somatic mesoderm, Pax3 and Pax7 are also expressed in NCCs (46–48). These Pax genes are major regulators of neural crest development and differentiation and are generally down-regulated during terminal differentiation (48,49). Both pax3 and pax7 are up-regulated in the NCCs of capzb−/− mutants, suggesting that capzb also regulates the process of cell differentiation in NCCs during development. It is interesting to note that even though capzb seems to plays a structural role in the cells by modulating the cytoskeleton, it may also affect the process of cell differentiation by modulating intracellular signaling cues. The capping protein is known to modulate the evolutionary conserved Hippo signaling network in Drosophila where depletion of the capping protein results in tissue outgrowth (50,51). The Hippo network and its target genes, which includes pax3 and pax7, is known to regulate the processes of cell differentiation and cell migration and plays a role in myogenesis by modifying the actin cytoskeleton through the capping protein (52–54). However, the mechanism behind the regulation of cellular processes via interaction between genes in the Hippo network and the cytoskeleton remains largely unknown and would be a potential direction of future research.
Cells are subject to mechanical forces produced from within the cell and by external stimuli. They respond to these mechanical cues by adjusting the tension and overall organization of their actin cytoskeleton by engaging a plethora of ABPs like capzb (55,56). These mechanical cues also affect cell morphology during tissue morphogenesis. capzb regulates the length of actin filaments by capping growing F-actin filaments, thus modulating the F/G-actin ratio. capzb deficiency modulates actin cytoskeleton and affects the cell shape in capzb−/− epidermal cells. Increased deposition of F-actin within mutant epidermal cells suggests improper localization of F-actin in the absence of capzb. capzb−/− epidermal cells are more rounded and dysmorphic than wild-type, which could reflect increased internal stress.
Defective cell migration affects palate morphogenesis in capzb mutants
NCCs are highly migratory cells that give rise to various structures including craniofacial cartilage and melanocytes. The palate in zebrafish, which is analogous to the human primary palate, is formed by a subset of NCCs known as CNCCs (19,57). CNCCs undergo migration; proliferation and convergent-extension to form the facial prominences that give rise to the embryonic craniofacial cartilage, including the palate and lower jaw that prefigure the adult craniofacial skeleton (57). Each of the processes involved in morphogenesis of craniofacial cartilage requires extensive actin cytoskeletal remodeling. Any defect in regulation of the actin cytoskeleton can affect one or more of these processes and disturb palatal morphogenesis.
In capzb−/− mutants, no changes in cell proliferation or cell death were observed during palate morphogenesis. However, migration of the anterior-most stream of CNCCs, which gives rise to the FNP in the palate, is defective. This stream of migratory CNCCs travel a longer distance than the more caudal streams that contribute to the maxillary and mandibular prominences, and may therefore be more sensitive to perturbations of cell migration, as with capzb deficiency. We suggest that cessation of CNCC migration occurs concomitant with the depletion of the maternal capzb transcripts, at which time the CNCCs fail to reach their median palate destination to fuse with the maxillary prominences to form the complete palate, resulting in midline cleft of the palate in zebrafish.
Similarly, migration of TNCCs is disrupted by capzb LOF. In capzb mutants, while TNCCs initially start migration, upon capzb transcript depletion, they soon show aberrant cell migration as observed using the mitfa:GFP and Zebrabow reporter lines.
capzb gene dosage is crucial during morphogenesis
It has been shown that transgenic mice that overexpress capzb show myofibrillar disarray, cardiac hypertrophy and early death (29). capzb overexpression by mRNA injection into zebrafish embryos also leads to early lethality in wild-type embryos, suggesting that capzb gain of function affects embryogenesis. While deficiency of capzb is detrimental to morphogenesis due to excessive F-actin polymerization, we predict that excess capzb is also harmful due to less F-actin polymerization and consequent actin cytoskeletal dysregulation. Over-expression of CAPZB may also be detrimental to embryonic development.
The zebrafish LOF model recapitulates the three major LOF phenotypes of CAPZB in DGAP198, viz. cleft palate, micrognathia and hypotonia. Although we are cautious about elaborating findings from a single subject (DGAP198), our combined findings of similar subjects coupled with phenotypic, genetic and functional data from the zebrafish suggest that CAPZB dysfunction and actin cytoskeletal dysregulation cause defective morphogenesis. We have also identified the functional consequences of capzb mutation in vertebrate development, specifically in craniofacial morphogenesis. We propose that the wide spectrum of morphological phenotypes that result from capzb deficiency correlate with its role in modulating the actin cytoskeleton in cells. Overall, the capzb LOF studies indicate that capzb is essential for viability in zebrafish and that its activity is required to maintain the correct intracellular F-actin localization, thus maintaining cell morphology, differentiation and migration. Because these processes are related, defects in these cellular behaviors translate to defects in tissue morphogenesis. Herein, we show that these defects affect the palate, muscle formation and lower jaw extension.
Materials and Methods
Subject recruitment
Informed consent, medical records and blood samples were obtained through an Institutional Review Board approved protocol of Partners HealthCare System titled DGAP.
Chromosome analysis
GTG-banded chromosomes were prepared from a peripheral blood sample using standard laboratory protocols. The chromosome analysis was performed at the Cytogenetics Laboratory of National Children's Hospital (Columbus, OH, USA).
Large-insert jumping library sequencing
DNA extracted from peripheral blood was sequenced using customized whole-genome large insert jumping library methods, as previously described (16,58). Briefly, DNA was sheared and size-selected to ∼3000 bp. Linear DNA fragments were circularized with adapters containing an EcoP15I recognition site and a biotinylated thymine. Circularized DNA was restriction enzyme digested and the biotinylated thymine was bound to streptavidin beads to retain the circularization junction of each molecule. The resulting libraries consisted of DNA fragments with ends separated by a genomic distance equal to the size of the circularized fragments. Paired-end sequencing was performed on an Illumina Hi-seq 2000 (Illumina, Inc.), generating 204 073 173 million read pairs with a median average insert of 3.8 kb and an average physical coverage of 150× genome-wide (16,58–60). Analyses were performed by integrating three algorithms: LUMPY (61), cn.MOPS (62) and structural variation (SV) classifier (60), as previously described (59). These computational methods detect both anomalous read pairs that cluster in proximity to SV breakpoints and genomic intervals with aberrant sequencing depth indicating copy gain or loss.
Generation of lymphoblastoid cell line
Lymphocyte cell transformation was performed at the Massachusetts General Hospital Genomics Core Facility in the Center for Human Genetic Research (Boston, MA, USA). DGAP198 and age-matched control lymphoblastoid cells were grown in RPMI 1640 media (Life Technologies, Carlsbad, CA, USA) supplemented with 10% fetal bovine serum.
Zebrafish husbandry and strains
The zebrafish line capzbhi1858bTg/+ was obtained from Zebrafish International Resource Center. Wild-type (Tü), Tg(acta1a:lifeact-GFP) (63), Tg(krt8:GFP) (64), Tg(mitfa:GFP) (gift from L. Zon, Boston's Children Hospital, Boston, MA, USA), Tg(sox10:kaede) (57,65), Tg(sox10:-4.9eGFP) (66), Tg(sox10:mcherry) (65), Tg(col2a:GFP) (19) and Tg(mylz2:mcherry) (67) transgenic lines were used. Embryos were obtained by natural spawning and staged (68). All embryos and fish were raised and cared (69), using established protocols in accordance with the Subcommittee on Research Animal Care, MGH.
Tail-clip for preparation of genomic DNA
Adult zebrafish were anesthetized in 0.2%Tricaine/1× E3. A small part of the tail fin was cut with a fresh razor and put in 50 μl of fresh lysis buffer (10 mm Tris–HCl, pH-8.3, 50 mm KCl, 1.5 mm MgCl2, 3% NP-40, 3% Tween-20). The sample was heated at 95°C for 10 min and incubated overnight at 55°C with 2.5 μl of proteinase K (20 mg/ml). Following incubation at 95°C for 10 min the sample was used for PCR amplification. Genomic DNA was extracted from heads/tails of embryos using 20 μl of fresh lysis buffer and 1 μl of 20 mg/ml Proteinase K.
RT-polymerase chain reaction
DGAP198 and age-matched control lymphoblastoid cell lines were pelleted, by spinning at 1100 rpm for 10 min at room temperature. Pellets were resuspended in 1× phosphate buffered saline (PBS) and pelleted again. The supernatant was discarded and the pellets were resuspended in 200 μl TRIzol (Life Technologies). Embryos at 65 hpf were washed in 1× E3, resuspended in 1 ml TRIzol and homogenized with an electric motor and pestle (VWR, Atlanta, GA, USA). Total RNA was isolated by standard protocols of TRIzol extraction and treated with DNase using a DNA-free kit (Life Technologies) according to the manufacturer's recommendations. cDNA was synthesized using oligo (dT)20 primers in iScript™ Select cDNA Synthesis Kit (Bio-Rad Labs, Hercules, CA, USA). For qRT-PCR, 480 ng of the total RNA was used per 40 μl reverse transcription reaction.
Quantitative RT-polymerase chain reaction
CAPZB transcripts were quantified in DGAP198 lymphoblastoid cells by qRT-PCR and normalized with respect to GAPDH expression. capzb transcripts were quantified in whole capzb−/− mutants and wild-type embryos collected at 65 hpf, by qRT-PCR and normalized with respect to ef1α expression. Oligonucleotides used as primers are presented in Supplementary Material, Table S1. The qRT-PCR was carried out using Platinum SYBR green qPCR supermix-UDG with ROX (Life Technologies) using the following conditions: 50°C for 2 min; 95°C for 2 min; 40 cycles of 95°C for 15 s, 60°C for 30 s and a melt curve stage of 95°C for 15 s, 60°C for 1 min and 95°C for 15 s. Copy number was determined with the comparative Ct method (70).
Cloning of the zebrafish capzb ortholog
The zebrafish ortholog of CAPZB was identified using the human CAPZB mRNA and protein sequences, respectively (NCBI Reference Sequence: NM_001282162.1, NP_001269091.1) in the NCBI BLAST tool. The full-length 822 bp coding region of capzb (NCBI Reference Sequence: NM_199935.1, NP_956229.1) was PCR amplified from total cDNA (described above) using forward primer 5′-GAAGCAGGATCCATGAATGAGC-3′ and reverse primer 5′-GTATTCTCGAGCTAGCTCTGC-3′. The amplified fragment was cloned into pGEM T-Easy Vector System (Promega) and the resulting clone was verified by sequencing. pGEM T-Easy-capzb plasmid was digested with BamHI and XhoI (New England Biolabs, Ipswich, MA, USA) and subcloned into pCS2+ expression vector for subsequent capped mRNA synthesis.
Whole-mount RNA in situ hybridization
SpeI-linearized pGEM T-Easy-capzb and KpnI-linearized pCS2+-capzb (described above) were used to synthesize DIG-labeled anti-sense and sense riboprobes, using the T7 mMESSAGE mMACHINE and the SP6 mMESSAGE mMACHINE RNA Synthesis Kit (Ambion, Foster City, CA, USA), respectively, according to the manufacturer's instructions. Whole-mount RNA in situ hybridization was performed with staged Tü embryos as previously described (71). Embryos were mounted in 95% glycerol in 1× phosphate buffered saline with tween 20 (PBST) and images were obtained at 10× using a Nikon AZ100 microscope (Nikon Instruments, Inc., Melville, NY, USA).
Cartilage staining
Alcian blue staining was performed at 4.5 dpf to analyze the craniofacial skeleton as described previously (72). Embryos were mounted in 95% glycerol in 1× PBST and images were obtained at 10× and 40× on Nikon 80i compound microscope (Nikon Instruments).
Immunohistochemistry
For whole-mount fluorescence immunohistochemistry, 65 hpf capzb−/− and wild-type embryos were fixed in 4% paraformaldehyde (PFA) overnight at 4°C. Embryos were washed several times in 1× PBST, incubated with Proteinase K (10 μg/ml) for 20 min at room temperature, washed with 1× PBST and incubated overnight in 1× PBS with 5% goat serum, 20% dimethyl sulfoxide (DMSO) and primary antibody. Anti-myosin heavy chain (A4.1025) and anti-Pax7 (Developmental Studies Hybridoma Bank, University of Iowa) antibodies were used at 1:100 and 1:10 respectively. Embryos were washed again in 1× PBST, incubated in 1× PBS with 5% goat serum, 20% DMSO and secondary antibody overnight and washed in 1× PBST. Secondary antibodies Alexa Fluor 488-labeled goat anti-mouse IgG2A and Alexa Fluor 488-labeled goat anti-mouse IgG (Invitrogen, Carlsbad, CA, USA) were used at 1:200 for anti-myosin heavy chain and anti-Pax7 antibody staining, respectively. Embryos stained with anti-myosin heavy chain antibody were mounted in 95% glycerol in 1× PBST and images were obtained at 10× on the Nikon 80i compound microscope (Nikon Instruments). Embryos stained with anti-Pax7 antibody were counterstained with Hoechst 33342 (Life Technologies) at 1:2000, by incubating for 30 min at room temperature. Heads were resected and trunks flat-mounted in 3% methylcellulose and imaged at 20× using confocal microscopy (Nikon A1R Si Confocal Eclipse Ti series).
mRNA rescue microinjections
In rescue assays, capped zebrafish capzb and GFP mRNAs were prepared using pCS2+-capzb (described above) and pCS2+-GFP as templates, respectively, with the SP6 mMESSAGE mMACHINE RNA synthesis kit (Ambion) following the manufacturer's instructions. mRNAs were cleaned using RNeasy Mini Kit (Qiagen, Valencia, CA, USA). Approximately 198pg of capped RNAs were injected into one-cell stage embryos from capzbhi1858bTg/+ intercross and wild-type as per requirement. Injected embryos were grown for 4.5 days post-injection (dpi) at 28°C, fixed in 4% PFA and stored in 4°C for further analysis. Tails of all 4.5 dpi embryos were genotyped separately in the capzbhi1858bTg/+ intercross.
Visualization of trunk muscles, edge of fin epidermis and epidermal cells
Tg(acta1a:lifeact-GFP) was used to image trunk skeletal muscles and the edge of the fin epidermis while Tg(krt8:GFP) was used to image the epidermal cells. capzb−/−;acta1a:lifeact-GFP and wild-type;acta1a:lifeact-GFP embryos were collected at 65 hpf for imaging trunk skeletal muscles. Heads were resected and trunks flat-mounted in 95% glycerol in 1× PBST and imaged at 20× using confocal microscopy (Nikon A1R Si Confocal Eclipse Ti series). capzbhi1858bTg/+; acta1a:lifeact-GFP and wild-type; acta1a:lifeact-GFP intercross embryos were collected at 60 hpf for imaging change in F-actin localization. Embryos were mounted in 3% methylcellulose and imaged at 20× on the confocal microscope (Nikon A1R Si Confocal Eclipse Ti series). They were immediately removed from methylcellulose and raised in 1× E3 in the dark for imaging at 72 hpf. At 72 hpf, heads were resected and trunks flat-mounted in 3% methylcellulose and imaged at 20× using confocal microscopy (Nikon A1R Si Confocal Eclipse Ti series). capzb−/−;krt8:GFP and wild-type;krt8:GFP embryos were collected at 4.5 dpf. Heads were resected and trunks flat-mounted in 95% glycerol in 1× PBST and imaged at 20× using confocal microscopy (Nikon A1R Si Confocal Eclipse Ti series).
Transmission electron microscopy
Wild-type and capzb−/− embryos at 4.5 dpf were fixed in primary fixative containing 1% PFA/1.5% glutaraldehyde in 3% sucrose in 0.1 M sodium cacodylate buffer, pH 7.4 (Electron Microscopy Sciences, Hatfield, PA, USA) for at least 2 h at room temperature , then for a further 24 h at 4°C. Embryos were rinsed in sodium cacodylate buffer and secondary fixation performed in 1% osmium tetroxide in sodium cacodylate buffer for 1 h at room temperature. Subsequent steps were at room temperature. Embryos were rinsed again in cacodylate buffer, dehydrated through a graded series of ethanols to 100% for 20 min each, dehydrated briefly in 100% propylene oxide (PO) and allowed to pre-infiltrate in a 1:1 PO to Eponate resin (Ted Pella, Redding, CA, USA) mixture overnight on a gentle rotator. The following day, embryos were infiltrated with fresh Eponate resin for several hours, embedded in a flat molded tray with fresh Eponate and cured in an oven at 60°C overnight. Thin sections were cut using a Leica EM UC7 ultramicrotome, collected onto formvar-coated grids, stained with uranyl acetate and lead citrate for contrast. Sections were imaged on a JEOL JEM 1011 TEM at 80 kV, using an AMT digital imaging system (Advanced Microscopy Techniques, Danvers, MA, USA) at the Microscopy Core at the Program of Membrane Biology at MGH (Boston, MA, USA).
Melanocyte migration analysis by mitfa:GFP transgenic line
capzbhi1858bTg/+;mitfa:GFP and wild-type;mitfa:GFP intercross embryos were collected at 60 hpf for imaging changes in melanocyte migration. Embryos were mounted in 3% methylcellulose and imaged at 20× on the confocal microscope (Nikon A1R Si Confocal Eclipse Ti series). They were immediately removed, washed in 1× E3 and grown until 72 hpf. They were again mounted in 3% methylcellulose and imaged at 20× on the confocal microscope (Nikon A1R Si Confocal Eclipse Ti series).
Cell proliferation detection
Pulse-chase photoconversion assay
capzb−/−;sox10:kaede and wild-type;sox10:kaede embryos at 65 hpf were mounted in 3% methylcellulose. The distal end of the palate (sox10+ chondrocytes) was photoconverted unilaterally (pulse) using UV light (404.3 nm). Embryos were washed in 1× E3 without methylene blue and grown until 72–80 hpf (chase). They were then mounted in 3% methylcellulose and imaged at 20× on the confocal microscope (Nikon A1R Si Confocal Eclipse Ti series).
Cell apoptosis detection
TUNEL
Apoptosis assay was performed with Click-iT® TUNEL Alexa Fluor® 488 Imaging Assay, for microscopy and high-content screening (Life Technologies). capzb−/−;sox10:mcherry and wild-type;sox10:mcherry embryos were collected at 72 hpf and fixed overnight in 4% PFA at 4°C, followed by permeabilization with 0.25% Triton®X-100 in 1× PBS for 2 h at room temperature. Embryos were washed three times with 1× PBST for 5 min and incubated with 500 μl of terminal deoxynucleotidyl transferase (TdT) reaction buffer (according to the manufacturer's recommendations) for 10 min at room temperature. The TdT reaction buffer was replaced with fresh TdT reaction cocktail (according to the manufacturer's recommendations) and the embryos were incubated for 1 h at 37°C. Embryos were then washed twice with 3% bovine serum albumin (BSA) in 1× PBST for 2 min. Fresh Click-iT® reaction cocktail (100 µl made according to the manufacturer's recommendations) was added and the embryos were incubated for 30 min at 37°C in dark. The reaction cocktail was removed by washing with 1 ml of 3% BSA in 1× PBST for 5 min. Embryos were imaged at 20× on the confocal microscope (Nikon A1R Si Confocal Eclipse Ti series).
Cell migration assay and lineage analysis
Kaede is irreversibly photoconverted from green to red by exposure to UV light, which allows specific groups of CNCCs to be labeled (57,73). CNCCs located anterior to the eyes at 14-somites stage that migrate to form the FNP were photoconverted in capzbhi1858bTg/+;sox10:kaede and wild-type;sox10:kaede intercross embryos. Photoconversion of kaede was performed by mounting in 3% methylcellulose and exposing kaede to UV light (404.3 nm) on the confocal microscope (Nikon A1R Si Confocal Eclipse Ti series) using the 20× objective until all the green fluorescence was quenched. Embryos were immediately imaged, removed from methylcellulose and raised in 1× E3 in the dark for imaging at 12 h intervals until 72 hpf. At each time point, they were mounted in 3% methylcellulose and imaged at 20× on the confocal microscope (Nikon A1R Si Confocal Eclipse Ti series).
Imaging and data processing
All images were processed with an NIS-Elements advanced research image acquisition and analysis system (Nikon Instruments), using the maximum intensity projection feature applied to z-stacks for greater depth of clarity. Image files were exported as TIFF files. Figures were composed with Adobe Photoshop CS4 (Adobe, USA). The ideogram for the BCA of the subject was obtained using the software package Cytogenetic Data Analysis System (https://www.cydas.org/).
Statistical analysis
Two-tailed Student's t-test analysis was performed to quantify the L, W and the L/W ratio of the lower jaw and palate in the wild-type, capzb−/− and rescued capzb−/− embryos, using the GraphPad software (https://graphpad.com/quickcalcs/). A threshold of P ≤ 0.05 was considered significant in all cases. All results are represented as mean ± SD.
Supplementary Material
Authors’ contributions
E.C.L. and K.M. developed the concepts and analyzed the data. K.M. and K.I. performed experiments and collected the data. V.P., M.E.T. and J.F.G performed whole-genome sequencing and analysis of DGAP198. K.M., Q.J.X., R.L.M. and C.C.M. analyzed DGAP198 cell line. T.K. collected the clinical information. J.F.A. and S.E.H. were the clinical investigators on DGAP198. K.M. and E.C.L. prepared the manuscript and figures. All authors edited the manuscript.
Funding
This work was supported by the National Institute of General Medical Sciences (NIGMS) P01GM061354, the National Institute of Mental Health (NIMH) R00MH095867, the March of Dimes, the Charles Hood Foundation, and the National Institute of Dental and Craniofacial Research (NIDCR) U01DE024443.
Supplementary Material
Acknowledgements
We are grateful to the patient and her family for participating in the research of DGAP and for their support and consent of our work. We acknowledge Jenna Galloway for sharing reagents and advice; the Cytogenetics Laboratory of National Children's Hospital, Columbus, OH, the Cytogenetics Core of Dana Farber Harvard Cancer Center, (P30 CA006516), Mary Anne Anderson at Massachusetts General Hospital Genomic Core Facility in the Center for Human Genetic Research, Harvard Stem Cell Institute and Massachusetts General Hospital Flow Cytometry Core Facility and the Zebrafish International Resource Center. We thank our lab colleagues for discussions and for providing valuable feedback in the review of this manuscript and Renee Daigle for excellent care of our aquatics facility. Electron microscopy was performed in the Microscopy Core of the Center for Systems Biology/Program in Membrane Biology, which is partially supported by an Inflammatory Bowel Disease Grant DK43351 and a Boston Area Diabetes and Endocrinology Research Center (BADERC) Award DK5752. The monoclonal antibodies A4.1025 and PAX7, deposited by Helen M. Blau and Atsushi Kawakami, was obtained from the Developmental Studies Hybridoma Bank, created by the NICHD of the NIH and maintained at The University of Iowa, Department of Biology, Iowa City, IA 52242. This study makes use of data generated by the DECIPHER community. A full list of centers who contributed to the generation of the data is available from https://decipher.sanger.ac.uk and via email from decipher@sanger.ac.uk.
Conflict of Interest statement. None declared.
References
- 1.Casella J.F., Maack D.J., Lin S. (1986) Purification and initial characterization of a protein from skeletal muscle that caps the barbed ends of actin filaments. J. Biol. Chem., 261, 10915–10921. [PubMed] [Google Scholar]
- 2.Korn E.D. (1982) Actin polymerization and its regulation by proteins from nonmuscle cells. Physiol. Rev., 62, 672–737. [DOI] [PubMed] [Google Scholar]
- 3.Hunter G.L., Crawford J.M., Genkins J.Z., Kiehart D.P. (2014) Ion channels contribute to the regulation of cell sheet forces during Drosophila dorsal closure. Development, 141, 325–334. [DOI] [PMC free article] [PubMed] [Google Scholar]
- 4.Riviere J.B., van Bon B.W., Hoischen A., Kholmanskikh S.S., O'Roak B.J., Gilissen C., Gijsen S., Sullivan C.T., Christian S.L., Abdul-Rahman O.A. et al. (2012) De novo mutations in the actin genes ACTB and ACTG1 cause Baraitser-Winter syndrome. Nat. Genet., 44, 440–444, S441–442. [DOI] [PMC free article] [PubMed] [Google Scholar]
- 5.Keays D.A., Tian G., Poirier K., Huang G.J., Siebold C., Cleak J., Oliver P.L., Fray M., Harvey R.J., Molnar Z. et al. (2007) Mutations in alpha-tubulin cause abnormal neuronal migration in mice and lissencephaly in humans. Cell, 128, 45–57. [DOI] [PMC free article] [PubMed] [Google Scholar]
- 6.Jaglin X.H., Poirier K., Saillour Y., Buhler E., Tian G., Bahi-Buisson N., Fallet-Bianco C., Phan-Dinh-Tuy F., Kong X.P., Bomont P. et al. (2009) Mutations in the beta-tubulin gene TUBB2B result in asymmetrical polymicrogyria. Nat. Genet., 41, 746–752. [DOI] [PMC free article] [PubMed] [Google Scholar]
- 7.Stanier P., Moore G.E. (2004) Genetics of cleft lip and palate: syndromic genes contribute to the incidence of non-syndromic clefts. Hum. Mol. Genet., 13(Spec no. 1), R73–R81. [DOI] [PubMed] [Google Scholar]
- 8.Dixon M.J., Marazita M.L., Beaty T.H., Murray J.C. (2011) Cleft lip and palate: understanding genetic and environmental influences. Nat. Rev. Genet., 12, 167–178. [DOI] [PMC free article] [PubMed] [Google Scholar]
- 9.Rahimov F., Jugessur A., Murray J.C. (2012) Genetics of nonsyndromic orofacial clefts. Cleft Palate Craniofac. J., 49, 73–91. [DOI] [PMC free article] [PubMed] [Google Scholar]
- 10.Higgins A.W., Alkuraya F.S., Bosco A.F., Brown K.K., Bruns G.A., Donovan D.J., Eisenman R., Fan Y., Farra C.G., Ferguson H.L. et al. (2008) Characterization of apparently balanced chromosomal rearrangements from the developmental genome anatomy project. Am. J. Hum. Genet., 82, 712–722. [DOI] [PMC free article] [PubMed] [Google Scholar]
- 11.Beaty T.H., Murray J.C., Marazita M.L., Munger R.G., Ruczinski I., Hetmanski J.B., Liang K.Y., Wu T., Murray T., Fallin M.D. et al. (2010) A genome-wide association study of cleft lip with and without cleft palate identifies risk variants near MAFB and ABCA4. Nat. Genet., 42, 525–529. [DOI] [PMC free article] [PubMed] [Google Scholar]
- 12.Birnbaum S., Ludwig K.U., Reutter H., Herms S., de Assis N.A., Diaz-Lacava A., Barth S., Lauster C., Schmidt G., Scheer M. et al. (2009) IRF6 gene variants in Central European patients with non-syndromic cleft lip with or without cleft palate. Eur. J. Oral Sci., 117, 766–769. [DOI] [PubMed] [Google Scholar]
- 13.Mangold E., Ludwig K.U., Birnbaum S., Baluardo C., Ferrian M., Herms S., Reutter H., de Assis N.A., Chawa T.A., Mattheisen M. et al. (2010) Genome-wide association study identifies two susceptibility loci for nonsyndromic cleft lip with or without cleft palate. Nat. Genet., 42, 24–26. [DOI] [PubMed] [Google Scholar]
- 14.Lindgren A.M., Hoyos T., Talkowski M.E., Hanscom C., Blumenthal I., Chiang C., Ernst C., Pereira S., Ordulu Z., Clericuzio C. et al. (2013) Haploinsufficiency of KDM6A is associated with severe psychomotor retardation, global growth restriction, seizures and cleft palate. Hum. Genet., 132, 537–552. [DOI] [PMC free article] [PubMed] [Google Scholar]
- 15.Boycott K.M., Vanstone M.R., Bulman D.E., Mackenzie A.E. (2013) Rare-disease genetics in the era of next-generation sequencing: discovery to translation. Nat. Rev. Genet., 14, 681–691. [DOI] [PubMed] [Google Scholar]
- 16.Talkowski M.E., Ernst C., Heilbut A., Chiang C., Hanscom C., Lindgren A., Kirby A., Liu S., Muddukrishna B., Ohsumi T.K. et al. (2011) Next-generation sequencing strategies enable routine detection of balanced chromosome rearrangements for clinical diagnostics and genetic research. Am. J. Hum. Genet., 88, 469–481. [DOI] [PMC free article] [PubMed] [Google Scholar]
- 17.Talkowski M.E., Ordulu Z., Pillalamarri V., Benson C.B., Blumenthal I., Connolly S., Hanscom C., Hussain N., Pereira S., Picker J. et al. (2012) Clinical diagnosis by whole-genome sequencing of a prenatal sample. N. Engl. J. Med., 367, 2226–2232. [DOI] [PMC free article] [PubMed] [Google Scholar]
- 18.Talkowski M.E., Rosenfeld J.A., Blumenthal I., Pillalamarri V., Chiang C., Heilbut A., Ernst C., Hanscom C., Rossin E., Lindgren A.M. et al. (2012) Sequencing chromosomal abnormalities reveals neurodevelopmental loci that confer risk across diagnostic boundaries. Cell, 149, 525–537. [DOI] [PMC free article] [PubMed] [Google Scholar]
- 19.Dougherty M., Kamel G., Grimaldi M., Gfrerer L., Shubinets V., Ethier R., Hickey G., Cornell R.A., Liao E.C. (2013) Distinct requirements for wnt9a and irf6 in extension and integration mechanisms during zebrafish palate morphogenesis. Development, 140, 76–81. [DOI] [PMC free article] [PubMed] [Google Scholar]
- 20.McCarthy N., Wetherill L., Lovely C.B., Swartz M.E., Foroud T.M., Eberhart J.K. (2013) Pdgfra protects against ethanol-induced craniofacial defects in a zebrafish model of FASD. Development, 140, 3254–3265. [DOI] [PMC free article] [PubMed] [Google Scholar]
- 21.Swartz M.E., Wells M.B., Griffin M., McCarthy N., Lovely C.B., McGurk P., Rozacky J., Eberhart J.K. (2014) A screen of zebrafish mutants identifies ethanol-sensitive genetic loci. Alcohol Clin. Exp. Res., 38, 694–703. [DOI] [PMC free article] [PubMed] [Google Scholar]
- 22.Swartz M.E., Sheehan-Rooney K., Dixon M.J., Eberhart J.K. (2011) Examination of a palatogenic gene program in zebrafish. Dev. Dyn., 240, 2204–2220. [DOI] [PMC free article] [PubMed] [Google Scholar]
- 23.dos Remedios C.G., Chhabra D., Kekic M., Dedova I.V., Tsubakihara M., Berry D.A., Nosworthy N.J. (2003) Actin binding proteins: regulation of cytoskeletal microfilaments. Physiol. Rev., 83, 433–473. [DOI] [PubMed] [Google Scholar]
- 24.Hartman T.J., Martin J.L., Solaro R.J., Samarel A.M., Russell B. (2009) CapZ dynamics are altered by endothelin-1 and phenylephrine via PIP2- and PKC-dependent mechanisms. Am. J. Physiol. Cell Physiol., 296, C1034–C1039. [DOI] [PMC free article] [PubMed] [Google Scholar]
- 25.Cooper J.A., Sept D. (2008) New insights into mechanism and regulation of actin capping protein. Int. Rev. Cell Mol. Biol., 267, 183–206. [DOI] [PMC free article] [PubMed] [Google Scholar]
- 26.Schafer D.A., Cooper J.A. (1995) Control of actin assembly at filament ends. Annu. Rev. Cell Dev. Biol., 11, 497–518. [DOI] [PubMed] [Google Scholar]
- 27.Schafer D.A., Hug C., Cooper J.A. (1995) Inhibition of CapZ during myofibrillogenesis alters assembly of actin filaments. J. Cell Biol., 128, 61–70. [DOI] [PMC free article] [PubMed] [Google Scholar]
- 28.Cai J., Ash D., Kotch L.E., Jabs E.W., Attie-Bitach T., Auge J., Mattei G., Etchevers H., Vekemans M., Korshunova Y. et al. (2005) Gene expression in pharyngeal arch 1 during human embryonic development. Hum. Mol. Genet., 14, 903–912. [DOI] [PubMed] [Google Scholar]
- 29.Hart M.C., Cooper J.A. (1999) Vertebrate isoforms of actin capping protein beta have distinct functions In vivo. J. Cell Biol., 147, 1287–1298. [DOI] [PMC free article] [PubMed] [Google Scholar]
- 30.Hopmann R., Cooper J.A., Miller K.G. (1996) Actin organization, bristle morphology, and viability are affected by actin capping protein mutations in Drosophila. J. Cell Biol., 133, 1293–1305. [DOI] [PMC free article] [PubMed] [Google Scholar]
- 31.Delalle I., Pfleger C.M., Buff E., Lueras P., Hariharan I.K. (2005) Mutations in the Drosophila orthologs of the F-actin capping protein alpha- and beta-subunits cause actin accumulation and subsequent retinal degeneration. Genetics, 171, 1757–1765. [DOI] [PMC free article] [PubMed] [Google Scholar]
- 32.Dixon J.R., Selvaraj S., Yue F., Kim A., Li Y., Shen Y., Hu M., Liu J.S., Ren B. (2012) Topological domains in mammalian genomes identified by analysis of chromatin interactions. Nature, 485, 376–380. [DOI] [PMC free article] [PubMed] [Google Scholar]
- 33.Kang S.H., Scheffer A., Ou Z., Li J., Scaglia F., Belmont J., Lalani S.R., Roeder E., Enciso V., Braddock S. et al. (2007) Identification of proximal 1p36 deletions using array-CGH: a possible new syndrome. Clin. Genet., 72, 329–338. [DOI] [PubMed] [Google Scholar]
- 34.Amsterdam A., Nissen R.M., Sun Z., Swindell E.C., Farrington S., Hopkins N. (2004) Identification of 315 genes essential for early zebrafish development. Proc. Natl Acad. Sci. USA, 101, 12792–12797. [DOI] [PMC free article] [PubMed] [Google Scholar]
- 35.Amsterdam A., Burgess S., Golling G., Chen W., Sun Z., Townsend K., Farrington S., Haldi M., Hopkins N. (1999) A large-scale insertional mutagenesis screen in zebrafish. Genes Dev., 13, 2713–2724. [DOI] [PMC free article] [PubMed] [Google Scholar]
- 36.Golling G., Amsterdam A., Sun Z., Antonelli M., Maldonado E., Chen W., Burgess S., Haldi M., Artzt K., Farrington S. et al. (2002) Insertional mutagenesis in zebrafish rapidly identifies genes essential for early vertebrate development. Nat. Genet., 31, 135–140. [DOI] [PubMed] [Google Scholar]
- 37.Riedl J., Crevenna A.H., Kessenbrock K., Yu J.H., Neukirchen D., Bista M., Bradke F., Jenne D., Holak T.A., Werb Z. et al. (2008) Lifeact: a versatile marker to visualize F-actin. Nat. Methods, 5, 605–607. [DOI] [PMC free article] [PubMed] [Google Scholar]
- 38.Lister J.A., Robertson C.P., Lepage T., Johnson S.L., Raible D.W. (1999) nacre encodes a zebrafish microphthalmia-related protein that regulates neural-crest-derived pigment cell fate. Development, 126, 3757–3767. [DOI] [PubMed] [Google Scholar]
- 39.Pan Y.A., Freundlich T., Weissman T.A., Schoppik D., Wang X.C., Zimmerman S., Ciruna B., Sanes J.R., Lichtman J.W., Schier A.F. (2013) Zebrabow: multispectral cell labeling for cell tracing and lineage analysis in zebrafish. Development, 140, 2835–2846. [DOI] [PMC free article] [PubMed] [Google Scholar]
- 40.Ordulu Z., Wong K.E., Currall B.B., Ivanov A.R., Pereira S., Althari S., Gusella J.F., Talkowski M.E., Morton C.C. (2014) Describing sequencing results of structural chromosome rearrangements with a suggested next-generation cytogenetic nomenclature. Am. J. Hum. Genet., 94, 695–709. [DOI] [PMC free article] [PubMed] [Google Scholar]
- 41.Slavotinek A., Shaffer L.G., Shapira S.K. (1999) Monosomy 1p36. J. Med. Genet., 36, 657–663. [PMC free article] [PubMed] [Google Scholar]
- 42.Abdelilah S., Solnica-Krezel L., Stainier D.Y., Driever W. (1994) Implications for dorsoventral axis determination from the zebrafish mutation janus. Nature, 370, 468–471. [DOI] [PubMed] [Google Scholar]
- 43.Kelly C., Chin A.J., Leatherman J.L., Kozlowski D.J., Weinberg E.S. (2000) Maternally controlled (beta)-catenin-mediated signaling is required for organizer formation in the zebrafish. Development, 127, 3899–3911. [DOI] [PubMed] [Google Scholar]
- 44.Pelegri F., Knaut H., Maischein H.M., Schulte-Merker S., Nusslein-Volhard C. (1999) A mutation in the zebrafish maternal-effect gene nebel affects furrow formation and vasa RNA localization. Curr. Biol., 9, 1431–1440. [DOI] [PubMed] [Google Scholar]
- 45.Hettmer S., Wagers A.J. (2010) Muscling in: Uncovering the origins of rhabdomyosarcoma. Nat. Med., 16, 171–173. [DOI] [PubMed] [Google Scholar]
- 46.Goulding M.D., Chalepakis G., Deutsch U., Erselius J.R., Gruss P. (1991) Pax-3, a novel murine DNA binding protein expressed during early neurogenesis. EMBO J., 10, 1135–1147. [DOI] [PMC free article] [PubMed] [Google Scholar]
- 47.Murdoch B., DelConte C., Garcia-Castro M.I. (2012) Pax7 lineage contributions to the mammalian neural crest. PLoS One, 7, e41089. [DOI] [PMC free article] [PubMed] [Google Scholar]
- 48.Maczkowiak F., Mateos S., Wang E., Roche D., Harland R., Monsoro-Burq A.H. (2010) The Pax3 and Pax7 paralogs cooperate in neural and neural crest patterning using distinct molecular mechanisms, in Xenopus laevis embryos. Dev. Biol., 340, 381–396. [DOI] [PMC free article] [PubMed] [Google Scholar]
- 49.Wu M., Li J., Engleka K.A., Zhou B., Lu M.M., Plotkin J.B., Epstein J.A. (2008) Persistent expression of Pax3 in the neural crest causes cleft palate and defective osteogenesis in mice. J. Clin. Invest., 118, 2076–2087. [DOI] [PMC free article] [PubMed] [Google Scholar]
- 50.Fernandez B.G., Gaspar P., Bras-Pereira C., Jezowska B., Rebelo S.R., Janody F. (2011) Actin-capping protein and the Hippo pathway regulate F-actin and tissue growth in Drosophila. Development, 138, 2337–2346. [DOI] [PubMed] [Google Scholar]
- 51.Sansores-Garcia L., Bossuyt W., Wada K., Yonemura S., Tao C., Sasaki H., Halder G. (2011) Modulating F-actin organization induces organ growth by affecting the Hippo pathway. EMBO J., 30, 2325–2335. [DOI] [PMC free article] [PubMed] [Google Scholar]
- 52.Qin H., Blaschke K., Wei G., Ohi Y., Blouin L., Qi Z., Yu J., Yeh R.F., Hebrok M., Ramalho-Santos M. (2012) Transcriptional analysis of pluripotency reveals the Hippo pathway as a barrier to reprogramming. Hum. Mol. Genet., 21, 2054–2067. [DOI] [PMC free article] [PubMed] [Google Scholar]
- 53.Lucas E.P., Khanal I., Gaspar P., Fletcher G.C., Polesello C., Tapon N., Thompson B.J. (2013) The Hippo pathway polarizes the actin cytoskeleton during collective migration of Drosophila border cells. J. Cell Biol., 201, 875–885. [DOI] [PMC free article] [PubMed] [Google Scholar]
- 54.Judson R.N., Tremblay A.M., Knopp P., White R.B., Urcia R., De Bari C., Zammit P.S., Camargo F.D., Wackerhage H. (2012) The Hippo pathway member Yap plays a key role in influencing fate decisions in muscle satellite cells. J. Cell Sci., 125, 6009–6019. [DOI] [PMC free article] [PubMed] [Google Scholar]
- 55.Yan J., Yao M., Goult B.T., Sheetz M.P. (2015) Talin dependent mechanosensitivity of cell focal adhesions. Cell Mol. Bioeng., 8, 151–159. [DOI] [PMC free article] [PubMed] [Google Scholar]
- 56.Berrier A.L., Yamada K.M. (2007) Cell-matrix adhesion. J. Cell Physiol., 213, 565–573. [DOI] [PubMed] [Google Scholar]
- 57.Dougherty M., Kamel G., Shubinets V., Hickey G., Grimaldi M., Liao E.C. (2012) Embryonic fate map of first pharyngeal arch structures in the sox10: kaede zebrafish transgenic model. J. Craniofac. Surg., 23, 1333–1337. [DOI] [PubMed] [Google Scholar]
- 58.Hanscom C., Talkowski M. (2014) Design of large-insert jumping libraries for structural variant detection using illumina sequencing. Curr. Protoc. Hum. Genet., 80, 7.22.21–29. [DOI] [PMC free article] [PubMed] [Google Scholar]
- 59.Brand H., Collins R.L., Hanscom C., Rosenfeld J.A., Pillalamarri V., Stone M.R., Kelley F., Mason T., Margolin L., Eggert S. et al. (2015) Paired-duplication signatures mark cryptic inversions and other complex structural variation. Am. J. Hum. Genet., 97, 170–176. [DOI] [PMC free article] [PubMed] [Google Scholar]
- 60.Brand H., Pillalamarri V., Collins R.L., Eggert S., O'Dushlaine C., Braaten E.B., Stone M.R., Chambert K., Doty N.D., Hanscom C. et al. (2014) Cryptic and complex chromosomal aberrations in early-onset neuropsychiatric disorders. Am. J. Hum. Genet., 95, 454–461. [DOI] [PMC free article] [PubMed] [Google Scholar]
- 61.Layer R.M., Chiang C., Quinlan A.R., Hall I.M. (2014) LUMPY: a probabilistic framework for structural variant discovery. Genome Biol., 15, R84. [DOI] [PMC free article] [PubMed] [Google Scholar]
- 62.Klambauer G., Schwarzbauer K., Mayr A., Clevert D.A., Mitterecker A., Bodenhofer U., Hochreiter S. (2012) cn.MOPS: mixture of Poissons for discovering copy number variations in next-generation sequencing data with a low false discovery rate. Nucleic Acids Res., 40, e69. [DOI] [PMC free article] [PubMed] [Google Scholar]
- 63.Berger J., Tarakci H., Berger S., Li M., Hall T.E., Arner A., Currie P.D. (2014) Loss of Tropomodulin4 in the zebrafish mutant trage causes cytoplasmic rod formation and muscle weakness reminiscent of nemaline myopathy. Dis. Model Mech., 7, 1407–1415. [DOI] [PMC free article] [PubMed] [Google Scholar]
- 64.Gong Z., Ju B., Wang X., He J., Wan H., Sudha P.M., Yan T. (2002) Green fluorescent protein expression in germ-line transmitted transgenic zebrafish under a stratified epithelial promoter from keratin8. Dev. Dyn., 223, 204–215. [DOI] [PubMed] [Google Scholar]
- 65.Kamel G., Hoyos T., Rochard L., Dougherty M., Kong Y., Tse W., Shubinets V., Grimaldi M., Liao E.C. (2013) Requirement for frzb and fzd7a in cranial neural crest convergence and extension mechanisms during zebrafish palate and jaw morphogenesis. Dev. Biol., 381, 423–433. [DOI] [PubMed] [Google Scholar]
- 66.Carney T.J., Dutton K.A., Greenhill E., Delfino-Machin M., Dufourcq P., Blader P., Kelsh R.N. (2006) A direct role for Sox10 in specification of neural crest-derived sensory neurons. Development, 133, 4619–4630. [DOI] [PubMed] [Google Scholar]
- 67.Storer N.Y., White R.M., Uong A., Price E., Nielsen G.P., Langenau D.M., Zon L.I. (2013) Zebrafish rhabdomyosarcoma reflects the developmental stage of oncogene expression during myogenesis. Development, 140, 3040–3050. [DOI] [PMC free article] [PubMed] [Google Scholar]
- 68.Kimmel C.B., Ballard W.W., Kimmel S.R., Ullmann B., Schilling T.F. (1995) Stages of embryonic development of the zebrafish. Dev. Dyn., 203, 253–310. [DOI] [PubMed] [Google Scholar]
- 69.Westerfield M., Doerry E., Douglas S. (1999) Zebrafish in the Net. Trends Genet., 15, 248–249. [DOI] [PubMed] [Google Scholar]
- 70.Tesson L., Remy S., Menoret S., Usal C., Anegon I. (2010) Analysis by quantitative PCR of zygosity in genetically modified organisms. Methods Mol. Biol., 597, 277–285. [DOI] [PubMed] [Google Scholar]
- 71.Thisse C., Thisse B. (2008) High-resolution in situ hybridization to whole-mount zebrafish embryos. Nat. Protoc., 3, 59–69. [DOI] [PubMed] [Google Scholar]
- 72.Walker M.B., Kimmel C.B. (2007) A two-color acid-free cartilage and bone stain for zebrafish larvae. Biotech. Histochem., 82, 23–28. [DOI] [PubMed] [Google Scholar]
- 73.Hatta K., Tsujii H., Omura T. (2006) Cell tracking using a photoconvertible fluorescent protein. Nat. Protoc., 1, 960–967. [DOI] [PubMed] [Google Scholar]
Associated Data
This section collects any data citations, data availability statements, or supplementary materials included in this article.