

Abstract
Cockayne syndrome (CS) is a rare genetic disorder in which 80% of cases are caused by mutations in the Excision Repair Cross-Complementation group 6 gene (ERCC6). The encoded ERCC6 protein is more commonly referred to as Cockayne Syndrome B protein (CSB). Classical symptoms of CS patients include failure to thrive and a severe neuropathology characterized by microcephaly, hypomyelination, calcification and neuronal loss. Modeling the neurological aspect of this disease has proven difficult since murine models fail to mirror classical neurological symptoms. Therefore, a robust human in vitro cellular model would advance our fundamental understanding of the disease and reveal potential therapeutic targets. Herein, we successfully derived functional CS neural networks from human CS induced pluripotent stem cells (iPSCs) providing a new tool to facilitate studying this devastating disease. We identified dysregulation of the Growth Hormone/Insulin-like Growth Factor-1 (GH/IGF-1) pathway as well as pathways related to synapse formation, maintenance and neuronal differentiation in CSB neurons using unbiased RNA-seq gene expression analyses. Moreover, when compared to unaffected controls, CSB-deficient neural networks displayed altered electrophysiological activity, including decreased synchrony, and reduced synapse density. Collectively, our work reveals that CSB is required for normal neuronal function and we have established an alternative to previously available models to further study neural-specific aspects of CS.
Introduction
Cockayne syndrome (CS) was initially characterized by sunken eyes and a bird-like face, impaired hearing, retinal atrophy, erythematous dermatitis in sun-exposed skin, growth failure and mental retardation (1). Subsequent reports evinced a severe and multifaceted neuropathology involving not only developmental deficiencies of the central nervous system (CNS), but also neuronal loss, calcification, spasticity, tremors, vasculopathy and hypomyelination (2–4). Clinical indicators appear during the first years of life in classic manifestations of CS (5). Approximately 80% of CS cases are caused by mutations in the Excision Repair Cross-Complementation group 6 gene (ERCC6) which encodes the Cockayne Syndrome B protein (CSB). CSB is a key component of the transcription-coupled nucleotide excision repair pathway (6,7), acts as a component of RNA polymerase I (8), enhances elongation of RNA polymerase II (9), prevents accumulation of oxidative damage in both mitochondrial (10) and nuclear DNA (11), and promotes autophagy-mediated quality control of mitochondria (12). More recently, a CSB defect was associated with an imbalance in POLG1/POLG2 subunits of mitochondrial polymerase gamma (13).
In this work, we sought to generate a new in vitro model to study live human neurons derived from individuals with classical neurological manifestations of CS. We reprogrammed fibroblasts from two individuals with CS to generate induced pluripotent stem cell (iPSC) lines. We differentiated these cell lines into expandable neural progenitor cells (NPCs) and further into neurons. We employed unbiased next generation sequencing to analyze RNA transcription in neurons derived from CS and unaffected control iPSC lines. Comparative gene expression analysis revealed dysregulation of several cellular pathways related to synapse formation and maintenance including the Growth Hormone/Insulin-like Growth Factor-1 (GH/IGF-1) signaling pathway, previously implicated in synaptogenesis (14,15). Accordingly, we noticed that CSB neurons displayed reduced neuronal activity, altered network synchrony and reduced synapse density when compared to neurons derived from unaffected individuals. Our data suggest that CSB plays a previously unappreciated role in the homeostasis and function of human neurons.
Results
CSB iPSC characterization
We previously reported successful reprograming of CSB-mutated GM10903 fibroblasts (NIGMS Human Genetic Cell Repository) into iPSCs using retrovirus vectors (16). Here, by using non-integrative Sendai virus vectors (Life Technologies), we reprogrammed fibroblasts derived from the individuals GM00969 (Control-1), 5461 (Control-2), GM00739 (CSB-1) and GM10903 (CSB-2) into iPSCs. Immunofluorescence analysis showed that all iPSC clones described in this manuscript express Oct4, SSEA4 and Lin28 markers (representative images of Control-1 iPSCs are shown in Fig. 1A). Expression of OCT4 and SOX2 genes was also detected by PCR in control and CSB iPSCs [Fig. 1B, human embryonic stem cell line (ESC) H1 (WiCell) and GM00739 primary human fibroblasts were used as a positive and negative control, respectively]. Upon differentiation of iPSCs into embryoid bodies (EBs) in suspension culture with 10% FBS, we detected expression of the endo-, meso- and ectodermal markers AFP, MSX1 and PAX6, respectively, confirming the pluripotent potential of these cells (Fig. 1C). Cell karyotyping was performed in all iPSC clones, and no detectable gross chromosomal abnormalities were observed (Fig. 1D). Transcriptional profiles of the new iPSC lines were evaluated through microarray, and compared to controls. All iPSC clones showed a gene expression pattern similar to ESCs and distinct from skin fibroblasts [Fig. 1E, ESC lines H1 and Hues6 (Harvard HUES Cell Facility) and primary human fibroblasts were used as positive and negative controls, respectively]. The analyses of pluripotency-related genes showed a strong association between the iPSCs and ESCs, in comparison to fibroblasts (Fig. 1F), confirming successful reprogramming.
Figure 1.

Generation and characterization of CSB-iPSCs. (A) Immunofluorescence analysis of Oct4, SSEA4 and Lin28 expression in iPSCs (representative images of clone 1 of Control-1-derived cells; scale bar = 100 µm). (B) Expression of OCT4, SOX2 and GAPDH in fibroblasts (Fibro), H1 Embryonic Stem cells (ESCs) and two clones of Control-1, Control-2 and CSB-1-derived iPSCs, as measured by RT-PCR. (Ctl: Control). (C) Expression of OCT4, AFP, MSX1, Pax6 and GAPDH in iPSCs and in the iPSC-derived embryoid bodies (EBs) of control and CSB cells. (D) Karyotype of clone 1 of each indicated iPSC line. Correlation distances (microarray) between fibroblast, ES cell and iPSC samples, based on global gene expression profile (E) or on pluripotency-associated genes (F).
Transcriptional dysregulation of GH/IGF-1 pathway in CSB neurons
Next, we aimed to differentiate CSB and control iPSCs into neural cultures as previously described (14,17). Briefly, we initially differentiated iPSCs into EBs in suspension cultures followed by dual SMAD inhibition (18). Next, adhered EBs gave rise to neural rosettes which were then dissociated to generate NPCs (Supplementary Material, Fig. S1A and methods section below). All iPSC clones used in this study generated NPCs expressing Sox2, Musashi and Nestin (representative images of Control-1 NPCs are shown in Supplementary Material, Fig. S1B and C). NPCs were further differentiated into neural cells by ongoing culture in the absence of bFGF for 5 weeks. Control and CSB neural cultures gave rise to neurons and astrocytes as evidenced by MAP2/TUJ1 and GFAP staining, respectively (representative images for Control-1 and CSB-1 neural cultures are shown in Fig. 2A). PCR analysis confirmed expression of MAP2 and NEUN [a marker for late stage neuronal maturation (19)] for control and CSB neural cultures, in contrast to fibroblasts (Fig. 2B). By immunofluorescence, we also noticed that the percentage of NeuN-positive nuclei (co-localized with DAPI) was similar between control and CSB neural populations, except for CSB-2 C1, for which the values were lower (Fig. 2C).
Figure 2.

Characterization of CSB neurons. (A) Representative images of clones 1 of both Control-1 and CSB-1-derived neurons, respectively, showing expression of TUJ1, MAP2 and GFAP. Bars: 100 µm. (B) Expression of MAP2, NEUN and GAPDH in fibroblasts, clones 1 of Control-1, Control-2 and Control-3, and clones 1 and 2 of CSB-1 and CSB-2 neuronal cell cultures by end point PCR. (C) Percentage of NEUN-positive nuclei (DAPI) as evidenced by immunofluorescence in 5-weeks old neuronal culture (at least 1000 nuclei were analyzed in two independent experiments for each clone).
Since CSB plays an important role in mRNA and rRNA synthesis (7–9), we investigated unbiased gene expression in neurons derived from the CSB-1 patient iPSC line using RNAseq. RNA was obtained from FACS-sorted cells expressing eGFP under the control of the neuron-specific SYN1 promoter (Fig. 3A and B, Supplementary Material, Fig. S2) (14). We compared gene expression of the CSB-1 neurons with Control-1 and Control-2 neurons (two clones for each cell line) and identified 4930 differentially expressed transcripts in the CSB neurons, in which 1924 were upregulated, and 3006 were downregulated (P-value < 0.05, online supplementary Material). Protein coding transcripts represent 1123 and 1914, respectively. This observation is striking considering that the level of gene dysregulation in CSB neural cultures is greater than three times higher than previously observed for CSB skin fibroblasts (20,21). It is possible that the use of a relevant cell type (neuronal) characteristic of a severely affected tissue contributed to these differences. A correlation distance using a dendrogram and a PCA map is presented in Supplementary Material, Figure S3. RNAseq validation by quantitative RT-PCR of selected genes is shown in Supplementary Material, Figure S4. Next, using the Ingenuity Pathway Analysis software, we report that ‘Nervous System Development and Function’ is the most representative category within ‘Physiological System Development and Function’ (Fig. 3C). Within this category, we found several dysregulated pathways related to neuronal function, such as morphology of the nervous system (P-value = 4.85 × 10−36), axonogenesis (P-value = 5.73 × 10⁻¹⁵), action potential of neurons (P-value = 1.97 × 10⁻⁷), long term potentiation (P-value = 3.7 × 10⁻¹⁵) and neurotransmission (P-value = 1.75 × 10⁻¹⁷) (Supplementary Material, Table S1 lists 30 of these altered pathways). From the top-altered canonical pathways, the ‘Axonal Guidance Signaling’ pathway was the second most altered, with a P-value of 4.33 × 10⁻¹³, showing 36% of its molecules dysregulated (Supplementary Material, Table S2). Supplementary Material, Table S3 describes a list of molecules corresponding to upstream transcriptional regulators that may relate to the expression alterations found by RNA-seq analysis. These transcriptional regulators include miRNA and the TGFB1 gene (downregulated in CSB neurons), which is involved in differentiation and maintenance of neurons, conversion of NPCs into active neurons and synaptogenesis (22–24). Although the implication of miRNA dysregulation in CS needs to be clarified, this is the first time, to our knowledge, that a robust bioinformatics analysis suggests miRNA as potential candidate contributing to transcriptional dysregulation in CS cells.
Figure 3.
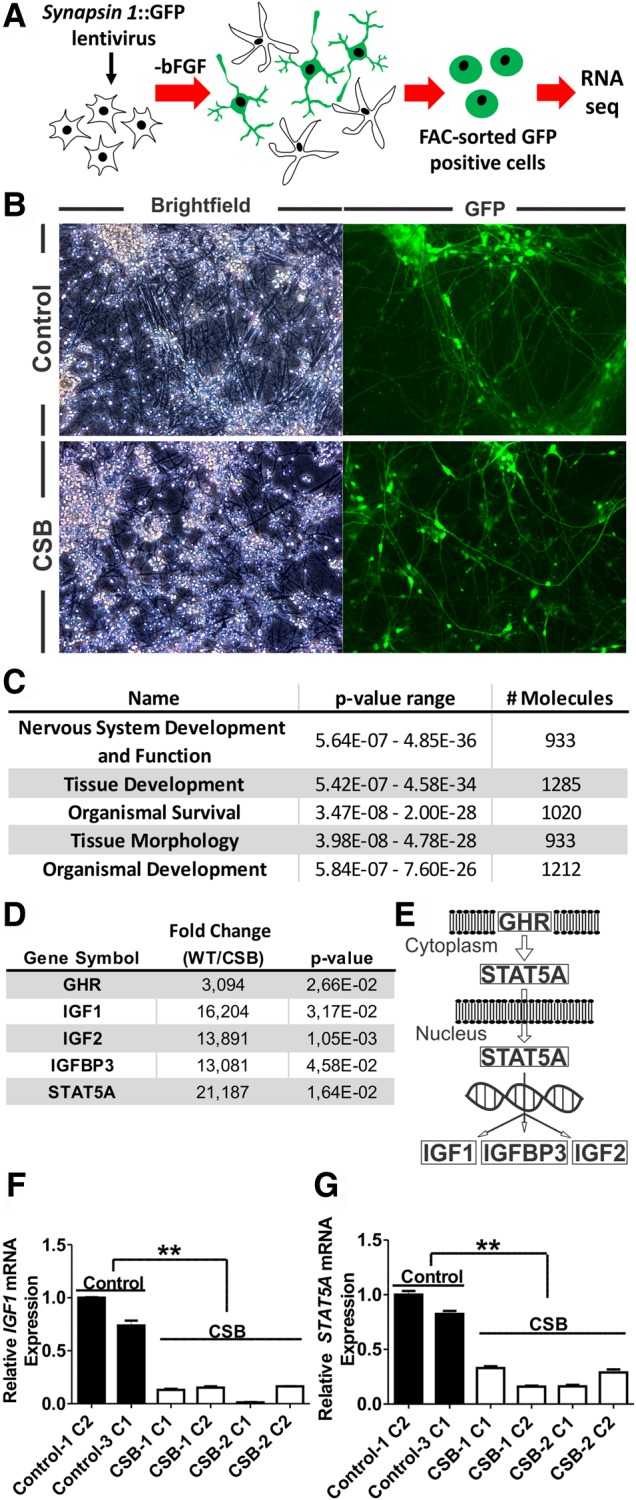
Transcriptional dysregulation of the GH/IGF-1 pathway in CSB neurons. (A) Scheme of the methodology employed to isolate neurons and extract RNA for sequencing. (B) Brightfield and GFP-channel images of clone 1 of both Control-1 and CSB-1-derived neurons expressing GFP under the control of the neuron-specific SYN1 promoter. (C) Top significant ‘Physiological System Development and Function’ categories evidenced by the Ingenuity Pathway Analysis software. (D) Expression of GH/IGF-1 pathway-related genes. Results are expressed as fold change of controls (WT) to affected (CSB). Key components of this pathway are shown in (E). Relative expression of IGF1 and STAT5A as measured by qPCR (F and G). Statistical analysis (unpaired t-test) expresses mean ± SEM of clones 1 of both Control-1 and Control-2 versus two clones of CSB-1 and CSB-2 neurons (**P < 0.01).
We show that the GH/IGF-1 signaling pathway was dysregulated in CSB neurons (P-value of 1.35 × 10⁻², Z-score of 1.964, Fig. 3D and E). Specifically, we reveal key components of this pathway (IGF1, IGF2, IGFBP3 and STAT5A) showed an expression greater than 13 times higher in the control cells than in the CSB neurons (Fig. 3D). These genes regulate brain size and neuronal differentiation and survival (15,25–28), suggesting a correlation with CS clinical characteristics. By qPCR, we confirm that expression of IGF1 and STAT5A was downregulated in CSB neurons derived from both CS patient iPSC lines (Fig. 3F and G).
CSB-deficient neurons have reduced synapse density
Unbiased gene expression analyses revealed several downregulated pathways in CSB neurons implicated in synaptic activity such as synaptic transmission (P-value = 5.83 × 10⁻¹⁵), synaptogenesis (P-value = 3.47 × 10⁻¹³) and density of synapses (P-value = 1.63 × 10⁻⁷, Supplementary Material, Table S1). Thus, we next quantified synapse density via immunofluorescence by co-immunostaining Synapsin I (pre-synaptic marker) and PSD-95 (post-synaptic marker) on Map2-positive processes (neuron filament marker, Fig. 4A and B). Our data showed that CSB neurons have significantly reduced synapse density when compared to control cells (Fig. 4C), suggesting that CSB is important for synapse formation, maintenance, or a combination of both in human neurons.
Figure 4.
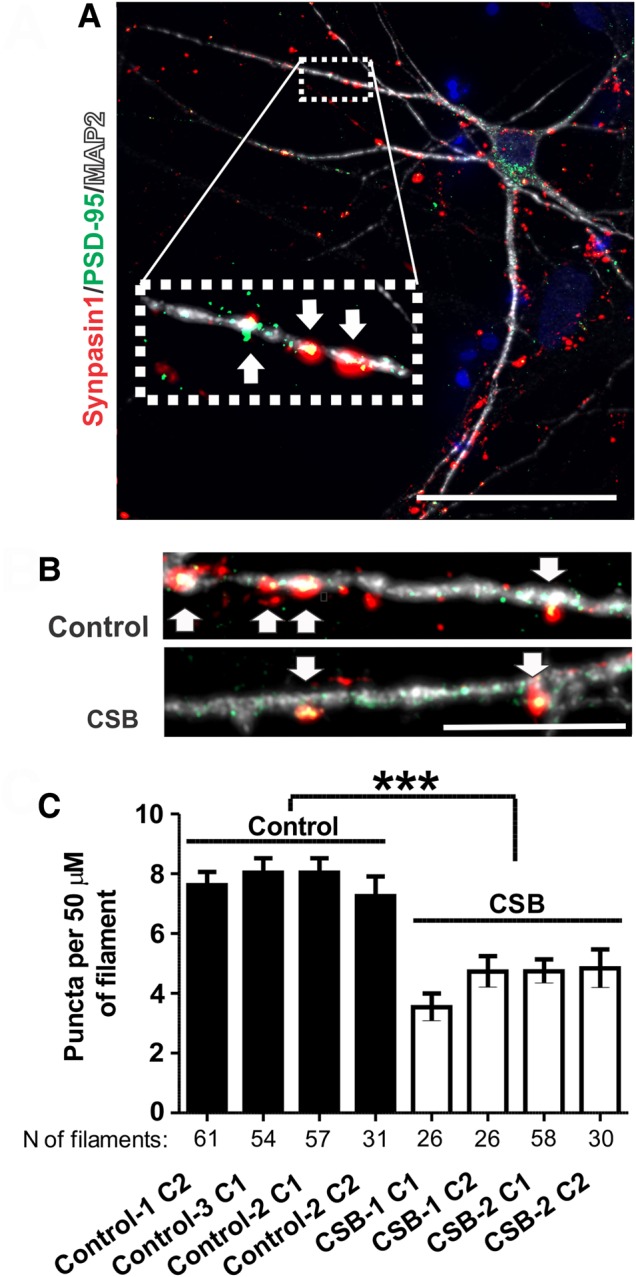
CSB neurons have reduced synapse density. (A) Illustrative picture of co-localization of synapsin I to PSD-95 on neuronal filaments (Map2), as evidenced by fluorescence microscopy; scale bar: 50 µm. (B) Illustrative images of puncta in clones 1 of Control-1 and CSB-1 neurons; scale bar: 10 µm. (C) Number of synapse per 50 µm of filament for each clone analyzed [two independent experiments and total number (N) of filaments analyzed are indicated). Statistical analysis (unpaired t-test) expresses mean ± SEM of the four unaffected clones (clones 1 and 2 of Control-1, clones 1 of Control-2 and Control-3 neurons) versus the four affected clones (clones 1 and 2 of CSB-1 and CSB-2) (***P < 0.001).
CSB neurons are functional, but display reduced network synchrony
The reduced synapse density observed in CSB neurons prompted us to investigate electrophysiological network connectivity. Thus, we analyzed neuronal activity of CSB neural networks on multi-electrode arrays (MEAs), which allow mapping of action potentials (spikes) through detection of field potential changes (an illustrative scheme is presented in Fig. 5A). We differentiated the following NPCs directly on MEA plates for 5 weeks: two clones for Control-1, one clone each for Control-2 and Control-3, and two clones each for CSB-1 and CSB-2 lines. Representative temporal raster plots illustrating timestamps of spikes over 3 min of continuous recording and overlaid representative wave forms are shown in Figure 5B and C, respectively, for both control and CSB neurons. Results show that iPSC-derived neurons spontaneously generated action potentials, confirming successful differentiation of both CS and control NPCs into functional neurons. However, comparing CSB to controls revealed overall spike number was significantly lower (P < 0.05) in CSB neurons (Fig. 5D). Aligned raster plots of independent electrodes show that both CSB and control neural cultures displayed varying degrees of synchronized neural network activity, measured by overlapping spike burst from different channels (pink rectangles in Fig. 5B). Synchronized activity spreading through multiple electrodes indicates information flow in the neuronal network via synaptic signaling. Interestingly, overlapping the spike activity histogram from different channels reveals a distinct frequency of synchronized activity for CSB neuronal networks, with significantly less synchronized events compared to controls (P < 0.05, Fig. 5E). These results suggest that although CSB iPSCs generate functional neurons, their coordinated activity at the network level is diminished when compared to control cells.
Figure 5.

CSB neuronal cultures exhibit reduced number of spikes and network synchrony. (A) Illustrative representation of a neuron plated on top of an electrode and the generation of field potential changes (spikes). (B) Representative temporal raster plots of unaffected (Control-3 clone 1) or CSB (CSB-1 clone 1) neurons over a 3-min recording from the MEA. Vertical rectangles spanning the graphs indicate synchronized spikes/bursts. (C) Overlay of representative successive wave forms of spikes in one electrode of each unaffected (W83) or CSB (GM00739) neuronal cultures. Total number of spikes (D) and synchrony index (E). At least three independent experiments in quadruplicate were carried out for all clones. Statistical analysis (unpaired t-test) expresses mean ± SEM of the four unaffected clones (clones 1 and 2 of Control-1, clones 1 of Control-2 and Control-3 neurons) versus the four affected clones (clones 1 and 2 of CSB-1 and CSB-2) (*P < 0.05).
Discussion
CS is a genetic disease in which human subjects display neurodevelopmental dysfunction and degeneration. A majority of CS patients are affected by mutations in the ERCC6 (CSB) gene that codes for a protein that functions in transcription-coupled repair of damaged DNA (29,30), RNA synthesis (3,31) and mitochondrial metabolism (32,33). However, understanding the impact of CSB deficiency on neurons has historically been hampered by limitations of available disease models.
As previously reported (16), we successfully generated iPSCs from CSB fibroblasts, revealing that the gene is not essential for reprogramming. Here, we were further able to differentiate CS iPSCs into NPCs and functional neurons. These cells expressed classical neuronal markers (MAP2, Tuj1 and NeuN), formed synapses (co-localization of Synapsin I to PSD-95 on neuronal filaments) and generated action potentials (as measured by field potential changes in a MEA). However, we observed reduced connectivity in CSB neural networks, confirmed by reduced synapse density and reinforced by decreased synchronized firing, when compared to neural networks derived from unaffected individuals. These results are in agreement with the reduction of dendritic spines (which are critical structures for synaptic activities) observed in CSB-KO mice (34), suggesting that CSB is critical for synapse formation and neural networking.
A reduction in synapse density can be a result of diminished synaptogenesis, increased synaptic degeneration, or a combination of both (14,15,35,36). With regards to observed developmental deficiency and neurodegeneration in CS, a leading cause for reduced synapse density is still unknown. However, NeuN-positive cell numbers in the CSB-1 neural cultures were similar to control cells, suggesting that other factors may play a critical role. Transcriptome sequencing of CSB neurons revealed that several pathways related to neuronal function and communication were dysregulated in CSB neurons, suggesting cell-autonomous transcriptional dysregulation as a key contributor to reduced synapse density, in accordance with CSB playing a critical role in RNA synthesis (8,37). In agreement, Wang and collaborators found that neuron-associated genes were among the most altered classes of molecules through microarray-based analysis of RNA obtained from CSB-deficient fibroblasts (20).
Notably, we discovered impaired transcription of the GH/IGF-1 signaling pathway in CSB neurons, further confirmed by qPCR for IGF1 and STAT5 genes in neurons of two unrelated CS patients (Fig. 4). IGF1 disruption results in reduction of brain size, hypomyelination and loss of granule cells (25). Reduced IGF1 expression also compromises survival of Purkinje cells in neonatal cerebella (28). All of these features are commonly observed in classical CS cases (2). STAT5 was also shown to regulate IGF1 expression (38). Finally, reduced IGF-1 serum levels were reported in one CS patient (39). It is noteworthy that although CSBm/m mice fail to display several human neurological phenotypes (12), a double-deficient (XPA−/− CSBm/m) murine model that recapitulates growth retardation, progressive cachexia and neurodegeneration also displays reduced GH/IGF-1 axis transcription (40). The Ercc1 KO murine model (deficient in nucleotide excision repair) also shows a decline in the GH/IGF-1 axis, in parallel with signs of neurodegeneration and premature aging (41). Therefore, the identification, for the first time, of transcriptional downregulation of key components of the GH/IGF-1 pathways in CS donor-derived neurons constitutes evidence that it may play a key role in the neuropathology of CS. Remarkably, IGF-1 administration to iPSC-derived neuronal models of Rett Syndrome (14) and of Phelan-McDermid syndrome (15) rescued synapse density, and is currently in clinical trials for Rett Syndrome (ClinicalTrials.gov identifiers: NCT01253317 and NCT01777542). Now that we have established a human CSB neuronal model and revealed dysregulation in the GH/IGF-1 pathway, investigating the potential effects of IGF-1 treatment on iPSC-derived CSB neurons may be of compelling clinical interest.
Recently, Ciaffardini and coworkers reported that ERCC6 knockdown severely compromised differentiation of v-Myc immortalized NPCs (ReNcell VM) into neurons (42). Wang and collaborators reported that SV40-transformed CSB-null fibroblasts failed to transdifferentiate into neurons (20), providing additional rationale for our successful iPSC platform. Since classical CS patients are born with apparently normal brains (2,43), we expected a cell model that relies on differentiation from pluripotent cells (therefore mimicking embryonic development) would facilitate neural development. The iPSC-derived neurons recapitulate not only the pathogenic mutation, but also the genetic background of the CS donor in karyotypically stable cells (contrary to SV40-transformed cells). It is worth noting that CS patients with identical mutations and contrasting phenotypes were described (44). Therefore, the ability of our iPSC model to recapitulate the genetic background of each individual patient (in contrast to knockdown models) makes it an attractive new alternative for CS studies.
In summary, we provide an alternative to current in vitro and in vivo CS models by generating human neurons and complex neural cultures from human CS donor-derived iPSCs. These neurons show transcriptional dysregulation of several pathways including the GH/IGF-1 pathway, reduced network synchrony and reduced synapse density. Our results prove feasibility and demonstrate utility of this new in vitro human model of CS neuropathology; further, our discovery of GH/IGF-1 dysregulation in disease-appropriate neural tissue provides a specific potential therapeutic target.
Materials and Methods
Cell culture
Skin-derived human fibroblasts GM00969, GM00739 and GM10903 were purchased from CORIELL Cell Repositories. The fibroblasts 5461 and W83 belong to Dr Alysson Muotri's laboratory cell repository and were obtained from skin biopsies of a teenage female and a 38-year-old male, respectively, both of whom are Caucasian non-affected donors. Clinical features of the donors and genetic mutations are shown in Supplementary Material, Table S4. Fibroblasts were routinely grown in DMEM (Cell Gro, Corning, NY, USA) supplemented with 10% fetal bovine serum (FBS, Gibco, Life Technologies, Carlsbad, CA, USA). iPSCs were grown on Matrigel-coated plates (BD Biosciences, San Jose, CA, USA) in mTeSR1 (Stemcell Technologies, Vancouver, BC, Canada). NPCs were grown on poly-l-ornithine (PO, 10 µg/ml) and laminin (2.5 µg/ml)-coated plates, in the presence of DMEM/F12 1:1 with L-glutamine (Cell Gro) supplemented with 0.5 X N2 Neuroplex (Gemini, West Sacramento, CA, USA), 0.5 X Gem21 Neuroplex (Gemini), 1% penicillin/streptomycin (Life Technologies) and 20 ng/ml of bFGF (Life Technologies). Neurons were differentiated and maintained under the same conditions as NPCs, except in the absence of bFGF. All cells were maintained at 37°C in a humidified atmosphere of 5% CO2. iPSCs were passaged every 8–10 days under an EVOS microscope (AMG, Life Technologies) by mechanically detaching fragments of colonies with the aid of a P1000 tip. NPCs were enzymatically dissociated with Accutase (Sigma-Aldrich, St. Louis, MO, USA), and resulting single cell suspensions were sub-cultured. This work was approved by the UCSD human research protection program committee meeting under the IRB/ESCRO protocol #141223ZF.
Cell reprogramming
Fibroblasts were reprogrammed by Sendai virus vector-mediated expression of Oct4, Sox2, Klf-4 and c-myc (CytoTune®-iPS Kit, Life Technologies) according to manufacturer's protocol, with minor modifications. Briefly, 2 × 10⁵ cells were seeded on 35-mm plates (Corning). The next day, medium was replaced by DMEM supplemented with 5% FBS containing 1/5 of the mix of the viral vectors aliquot. The next day vectors were removed and replaced with fresh medium. The next day, cells were moved to a feeder layer (MEFs, Globalstem, Miami Lakes, FL, USA). Medium was changed daily (DMEM/F12 1:1 with L-glutamine (Cell Gro) supplemented with 20% knockout serum replacement, 1% non-essential amino acids, 0.2% β-mercaptoethanol and 30 ng/ml bFGF (Life Technologies). During the first 5 days, medium was further supplemented with 100 µm of valproic acid (Sigma-Aldrich). Two clonally derived iPSCs colonies for each cell type were isolated and re-plated on Matrigel-coated plates (feeder-free) approximately 4 weeks after initial viral transduction.
Neuronal differentiation
Neuronal differentiation was performed in two stages: NPC generation and neural differentiation. Briefly, iPSCs colonies were cultured for 2 days in the presence of DMEM/F12 1:1 containing 1 X N2 (Life Technologies), 1 µm dorsomorphin (Tocris Biosciences, Bristol, UK) and 10 µm SB431542. Then, colonies were detached with the aid of a cell lifter and in the presence of 5 µm Y-27632 (ROCK inhibitor, R&D Systems, Minneapolis, MN, USA), and maintained in suspension at 90 RPM for 5 days in an incubator (medium was exchanged every other day) in order to form embryoid bodies (EBs). EBs were gently mechanically disrupted, plated on Matrigel-coated plates and cultured in NPC medium for 5 days. Then rosettes were manually collected under an EVOs microscope inside a biological laminar flow cabinet, dissociated with Accutase, and NPCs were re-plated on poly-L-ornithine/laminin-coated plates. At this stage, NPCs could be expanded and cryopreserved in NPC medium with 10% DMSO. For neural differentiation, NPCs were grown to approximately 80% confluence before bFGF withdrawal. ROCK inhibitor was added at 5 µm for the first 2 days. After that, cells were allowed to differentiate for 5 weeks, and the medium exchanged twice per week.
RNA isolation, microarray, RNAseq and PCR analysis
For microarray analysis, 1 μg of total RNA (Trizol, Life Technologies) was biotinylated (Affymetrix, Santa Clara, CA, USA), fragmented and hybridized to the GeneChip Human 1.0 ST microarray at University of California DNA Core Facility (Biogen). Arrays were analyzed by the R-based bioconductor software package Affy (Affymetrix pre-processing) (45). After data normalization by the robust multichip averaging method, samples were clustered based on Euclidean distance between the transcripts over a pair of samples representing a variation between two samples. The dendrogram and heatmap were created using sample expression similarities.
For RNA sequencing sample preparation, NPCs were transduced with a lentivirus expressing GFP under the control of the Synapsin I gene promoter (14). After 5 weeks of neuronal differentiation, total RNA of neurons (BD Influx FAC-sorted GFP-positive cells, BD Biosciences) was obtained using Trizol. cDNA was then synthesized and subjected to multiplexed RNA-seq on an Illumina HiSeq 2000 at UCSD/Biogen sequencing facility and stored at NCBI BioProject (# PRJNA297108). Poly-A transcript sequencing produced more than 40 million 150 bp paired-end reads per sample. Filtered high-quality reads [NGS QC Toolkit (46)] were mapped to human reference genome Hg19 [Star software (47)]. In-house scripts were used to obtain the absolute number of aligned reads per transcript (Ensembl Hg19 transcriptome annotation as reference). Count data were normalized using a model based on negative binomial distribution for differential expression (DE) analysis [DESeq (48)] (DE transcripts defined as P-value <0.05). Count data were also used to calculate Euclidian distance between each pair of samples, including biological replicates, which were clustered based on shorter distances. Additionally, count data were used to create a heatmap and a two component-based Principal Component Analysis (PCA) to show relative relationships between each sample in a 2-D coordinate space.
For PCR reactions, cDNA (SuperScript III) was amplified using Accuprime Taq DNA polymerase (Life Technologies).SYBR Green was used to perform quantitative PCR (qPCR) in a 7500 Real Time PCR (Life Technologies), and relative expression levels were calculated according to the 2−ΔΔCt method (49). Primers used are listed in Supplementary Material, Table S5.
Immunofluorescence and synaptic puncta analysis
Cells plated on glass coverslips pre-coated with matrigel (iPSCs) or 100 µg/ml of PO and 10 µg/ml of laminin (NPCs/neurons) were fixed with 4% paraformaldehyde for 10 min at room temperature. After permeabilization (0.1% TritonX in PBS) and blocking (2% BSA on PBS), cells were incubated with primary antibodies (see list below), followed by Alexa Fluor-conjugated secondary antibodies (Life Technologies). Cell nuclei were treated with DAPI, and imaging was performed on a Zeiss Apotome epifluorescent microscope (Carl Zeiss, Oberkochen, Germany). Primary antibodies used were: Oct4 (ab19857), Lin28 (ab46020), Musashi (EP1302), Map2 (ab5392, Abcam); Sox2 (2748S, Cell Signalling): GFAP (Z0344, DAKO); SSEA4 (MAB4304), NeuN (MAB377), Synapsin I (AB1543p, Millipore); PSD-95 (75–028, Neuromab); Nestin (MA1-46100, Thermo Scientific); Tuj-1 (01409, StemCell). For puncta analysis, 1.25 × 10⁵ NPCs were plated on 12 mm cover glass, and after 2 days neuronal differentiation was started. After 5 weeks of differentiation, cells were fixed, stained for Synapsin I, PSD-95, and MAP2 and imaged on the Zeiss Apotome under a 100× oil-immersion objective in the Apotome Z-stack mode (nine slices with 0.56 µm interval). The number of synapses (Synapsin I co-localizing to PSD-95) over 50 µm of neuron filament (MAP2) was evaluated. Synapses were scored when they were within 5 µm from the MAP2 filament center, in agreement with previous work (50).
Multi-electrode array analysis
Neuronal activity was recorded using a multi-well MEA system (Maestro, Axion BioSystems, Atlanta, GA, USA). Briefly, 5 × 10⁴ NPCs (re-suspended in a 5 µl droplet of NPCs media) were plated on top of 16-electrode arrays inside wells of a 48-well pre-coated plate. The day after, neuronal differentiation was initiated. In the second week of differentiation, neuronal medium was switched to Neurobasal medium supplemented with 1 X B-27 and 2 mm Glutamax (Life Technologies). Neuronal activity was continuously recorded for 3 min, 24 h after media exchange during the fifth week of differentiation, and action potentials (measured as field potential changes) were recorded and analyzed using Axis 2.0 software (Axion Biosystems). The parameters used for data acquisition and processing were: Neuronal Broad Band filter frequency = 10–5000 Hz; referencing method = Fpga Median. Spike detection was performed by adaptive threshold crossing at 5.5 X Std Dev, and Poisson surprise algorithm (Surprise factor = 3) was used to detect bursts. Temporal raster plots were generated in the MATLAB-based Neural Metric Tool software (Axion BioSystems).
Supplementary Material
Funding
This work was supported by a grant from the California Institute for Regenerative Medicine (CIRM) TR4-06747, the National Institutes of Health through the NIH Director's New Innovator Award Program (DP2-OD006495-01), R01MH094753, R01MH103134, U19MH107367, a NARSAD Independent Investigator Grant to A.R.M., and from Fundação de Amparo à Pesquisa do Estado de São Paulo (FAPESP, São Paulo, Brazil) and Coordenação de Aperfeiçoamento de Pessoal de Nível Superior (CAPES, Brasilia, Brazil).
Supplementary Material
Acknowledgements
Authors want to thank Cassiano Carromeu and Brian Lee for helping with cell reprogramming and neuronal differentiation.
Conflict of Interest statement. None declared.
References
- 1.Cockayne E. (1936) Dwarfism with retinal atrophy and deafness. Arch. Dis. Child., 21, 52–54. [PubMed] [Google Scholar]
- 2.Weidenheim K., Dickson D., Rapin I. (2009) Neuropathology of Cockayne syndrome: evidence for impaired development, premature aging, and neurodegeneration. Mech. Ageing Dev., 130, 619–636. [DOI] [PubMed] [Google Scholar]
- 3.Brooks P. (2013) Blinded by the UV light: how the focus on transcription-coupled NER has distracted from understanding the mechanisms of Cockayne syndrome neurologic disease. DNA Repair (Amst), 12, 656–671. [DOI] [PMC free article] [PubMed] [Google Scholar]
- 4.Koob M., Laugel V., Durand M., Fothergill H., Dalloz C., Sauvanaud F., Dollfus H., Namer I.J., Dietemann J.L. (2010) Neuroimaging in Cockayne syndrome. AJNR Am. J. Neuroradiol., 31, 1623–1630. [DOI] [PMC free article] [PubMed] [Google Scholar]
- 5.Natale V. (2011) A comprehensive description of the severity groups in Cockayne syndrome. Am. J. Med. Genet. A, 155, 1081–1095. [DOI] [PubMed] [Google Scholar]
- 6.Hanawalt P., Spivak G. (2008) Transcription-coupled DNA repair: two decades of progress and surprises. Nat. Rev. Mol. Cell Biol., 9, 958–970. [DOI] [PubMed] [Google Scholar]
- 7.Venema J., Mullenders L.H., Natarajan A.T., van Zeeland A.A., Mayne L.V. (1990) The genetic defect in Cockayne syndrome is associated with a defect in repair of UV-induced DNA damage in transcriptionally active DNA. Proc. Natl Acad. Sci. USA, 87, 4707–4711. [DOI] [PMC free article] [PubMed] [Google Scholar]
- 8.Bradsher J., Auriol J., De Santis L., Iben S., Vonesch J., Grummt I., Egly J. (2002) CSB is a component of RNA pol I transcription. Mol. Cell, 10, 819–829. [DOI] [PubMed] [Google Scholar]
- 9.Selby C., Sancar A. (1997) Cockayne syndrome group B protein enhances elongation by RNA polymerase II. Proc. Natl Acad. Sci. USA, 94, 11205–11209. [DOI] [PMC free article] [PubMed] [Google Scholar]
- 10.Kamenisch Y., Fousteri M., Knoch J., von Thaler A., Fehrenbacher B., Kato H., Becker T., Dollé M., Kuiper R., Majora M. et al. (2010) Proteins of nucleotide and base excision repair pathways interact in mitochondria to protect from loss of subcutaneous fat, a hallmark of aging. J. Exp. Med., 207, 379–390. [DOI] [PMC free article] [PubMed] [Google Scholar]
- 11.Pascucci B., Lemma T., Iorio E., Giovannini S., Vaz B., Iavarone I., Calcagnile A., Narciso L., Degan P., Podo F. et al. (2012) An altered redox balance mediates the hypersensitivity of Cockayne syndrome primary fibroblasts to oxidative stress. Aging Cell, 11, 520–529. [DOI] [PubMed] [Google Scholar]
- 12.Scheibye-Knudsen M., Ramamoorthy M., Sykora P., Maynard S., Lin P., Minor R., Wilson D., Cooper M., Spencer R., de Cabo R. et al. (2012) Cockayne syndrome group B protein prevents the accumulation of damaged mitochondria by promoting mitochondrial autophagy. J. Exp. Med., 209, 855–869. [DOI] [PMC free article] [PubMed] [Google Scholar]
- 13.Chatre L., Biard D.S.F., Sarasin A., Ricchetti M. (2015) Reversal of mitochondrial defects with CSB-dependent serine protease inhibitors in patient cells of the progeroid Cockayne syndrome. Proc. Natl Acad. Sci. USA. doi:10.1073/pnas.1422264112. [DOI] [PMC free article] [PubMed] [Google Scholar]
- 14.Marchetto M., Carromeu C., Acab A., Yu D., Yeo G., Mu Y., Chen G., Gage F., Muotri A. (2010) A model for neural development and treatment of Rett syndrome using human induced pluripotent stem cells. Cell, 143, 527–539. [DOI] [PMC free article] [PubMed] [Google Scholar]
- 15.Shcheglovitov A., Shcheglovitova O., Yazawa M., Portmann T., Shu R., Sebastiano V., Krawisz A., Froehlich W., Bernstein J.A., Hallmayer J.F. et al. (2013) SHANK3 and IGF1 restore synaptic deficits in neurons from 22q13 deletion syndrome patients. Nature, 503, 267–271. [DOI] [PMC free article] [PubMed] [Google Scholar]
- 16.Andrade L., Nathanson J., Yeo G., Menck C., Muotri A. (2012) Evidence for premature aging due to oxidative stress in iPSCs from Cockayne syndrome. Hum. Mol. Genet., 21, 3825–3834. [DOI] [PMC free article] [PubMed] [Google Scholar]
- 17.Griesi-Oliveira K., Acab A., Gupta A.R., Sunaga D.Y., Chailangkarn T., Nicol X., Nunez Y., Walker M.F., Murdoch J.D., Sanders S.J. et al. (2015) Modeling non-syndromic autism and the impact of TRPC6 disruption in human neurons. Mol. Psychiatry, 20, 1350–1365. [DOI] [PMC free article] [PubMed] [Google Scholar]
- 18.Chambers S.M., Fasano C.A., Papapetrou E.P., Tomishima M., Sadelain M., Studer L. (2009) Highly efficient neural conversion of human ES and iPS cells by dual inhibition of SMAD signaling. Nat. Biotechnol., 27, 275–280. [DOI] [PMC free article] [PubMed] [Google Scholar]
- 19.Sarnat H.B., Nochlin D., Born D.E. (1998) Neuronal nuclear antigen (NeuN): a marker of neuronal maturation in the early human fetal nervous system. Brain Dev., 20, 88–94. [DOI] [PubMed] [Google Scholar]
- 20.Wang Y., Chakravarty P., Ranes M., Kelly G., Brooks P., Neilan E., Stewart A., Schiavo G., Svejstrup J. (2014) Dysregulation of gene expression as a cause of Cockayne syndrome neurological disease. Proc. Natl Acad. Sci. USA, 111, 14454–14459. [DOI] [PMC free article] [PubMed] [Google Scholar]
- 21.Newman J.C., Bailey A.D., Weiner A.M. (2006) Cockayne syndrome group B protein (CSB) plays a general role in chromatin maintenance and remodeling. Proc. Natl Acad. Sci. USA, 103, 9613–9618. [DOI] [PMC free article] [PubMed] [Google Scholar]
- 22.Walshe T.E., Leach L.L., D'Amore P.A. (2011) TGF-β signaling is required for maintenance of retinal ganglion cell differentiation and survival. Neuroscience, 189, 123–131. [DOI] [PMC free article] [PubMed] [Google Scholar]
- 23.Kraus S., Lehner B., Reichhart N., Couillard-Despres S., Wagner K., Bogdahn U., Aigner L., Strauß O. (2013) Transforming growth factor-β1 primes proliferating adult neural progenitor cells to electrophysiological functionality. Glia, 61, 1767–1783. [DOI] [PubMed] [Google Scholar]
- 24.Misumi S., Kim T.S., Jung C.G., Masuda T., Urakawa S., Isobe Y., Furuyama F., Nishino H., Hida H. (2008) Enhanced neurogenesis from neural progenitor cells with G1/S-phase cell cycle arrest is mediated by transforming growth factor ??1. Eur. J. Neurosci., 28, 1049–1059. [DOI] [PubMed] [Google Scholar]
- 25.Beck K.D., Powell-Braxton L., Widmer H.R., Valverde J., Hefti F. (1995) Igf1 gene disruption results in reduced brain size, CNS hypomyelination, and loss of hippocampal granule and striatal parvalbumin-containing neurons. Neuron, 14, 717–730. [DOI] [PubMed] [Google Scholar]
- 26.Tao X., Jin G., Zou L., Li H., Qin J. (2015) IGF2 regulates neuronal differentiation of hippocampal radial glial cells in vitro. J. Cytol. Histol., 6, 1–5. [Google Scholar]
- 27.Markham K., Schuurmans C., Weiss S. (2007) STAT5A/B activity is required in the developing forebrain and spinal cord. Mol. Cell. Neurosci., 35, 272–282. [DOI] [PubMed] [Google Scholar]
- 28.Croci L., Barili V., Chia D., Massimino L., van Vugt R., Masserdotti G., Longhi R., Rotwein P., Consalez G.G. (2011) Local insulin-like growth factor I expression is essential for Purkinje neuron survival at birth. Cell Death Differ., 18, 48–59. [DOI] [PMC free article] [PubMed] [Google Scholar]
- 29.Lehmann A.R. (2003) DNA repair-deficient diseases, xeroderma pigmentosum, Cockayne syndrome and trichothiodystrophy. Biochimie, 85, 1101–1111. [DOI] [PubMed] [Google Scholar]
- 30.Menck C., Munford V. (2014) DNA repair diseases: what do they tell us about cancer and aging? Genet. Mol. Biol., 37, 220–233. [DOI] [PMC free article] [PubMed] [Google Scholar]
- 31.Vélez-Cruz R., Egly J. (2013) Cockayne syndrome group B (CSB) protein: at the crossroads of transcriptional networks. Mech. Ageing Dev., 134, 234–242. [DOI] [PubMed] [Google Scholar]
- 32.Cleaver J.E., Bezrookove V., Revet I., Huang E.J. (2013) Conceptual developments in the causes of Cockayne syndrome. Mech. Ageing Dev., 134, 284–290. [DOI] [PubMed] [Google Scholar]
- 33.Scheibye-knudsen M., Croteau D.L., Bohr V.A. (2013) Mitochondrial deficiency in Cockayne syndrome. Mech. Ageing Dev., 134, 275–283. [DOI] [PMC free article] [PubMed] [Google Scholar]
- 34.Wong J., Visanji N., Dabek M., Laposa R., Hazrati L. (2013) Dendritic spine density is altered in a mouse model of Cockayne syndrome. Neuropathol. Appl. Neurobiol. doi:10.1111/j.1365-2990.2012.01305.x. [DOI] [PubMed] [Google Scholar]
- 35.Buttini M., Masliah E., Barbour R., Grajeda H., Motter R., Johnson-Wood K., Khan K., Seubert P., Freedman S., Schenk D. et al. (2005) Beta-amyloid immunotherapy prevents synaptic degeneration in a mouse model of Alzheimer's disease. J. Neurosci., 25, 9096–9101. [DOI] [PMC free article] [PubMed] [Google Scholar]
- 36.Conforti L., Adalbert R., Coleman M. (2007) Neuronal death: where does the end begin? Trends Neurosci., 30, 159–166. [DOI] [PubMed] [Google Scholar]
- 37.Dianov G., Houle J., Iyer N., Bohr V., Friedberg E. (1997) Reduced RNA polymerase II transcription in extracts of Cockayne syndrome and xeroderma pigmentosum/Cockayne syndrome cells. Nucleic Acids Res., 25, 3636–3642. [DOI] [PMC free article] [PubMed] [Google Scholar]
- 38.Baik M., Yu J., Hennighausen L. (2011) Growth hormone-STAT5 regulation of growth, hepatocellular carcinoma, and liver metabolism. Ann. N. Y. Acad. Sci., 1229, 29–37. [DOI] [PMC free article] [PubMed] [Google Scholar]
- 39.Park S., Chang S., Cho S., Baek H., Lee D. (1994) Cockayne syndrome: a case with hyperinsulinemia and growth hormone deficiency. J. Korean Med. Sci., 9, 74–77. [DOI] [PMC free article] [PubMed] [Google Scholar]
- 40.Van Der Pluijm I., Garinis G.A., Brandt R.M.C., Gorgels T.G.M.F., Wijnhoven S.W., Diderich K.E.M., De Wit J., Mitchell J.R., Van Oostrom C., Beems R. et al. (2007) Impaired genome maintenance suppresses the growth hormone-insulin-like growth factor 1 axis in mice with cockayne syndrome. PLoS Biol., 5, 0023–0038. [DOI] [PMC free article] [PubMed] [Google Scholar]
- 41.Niedernhofer L.J., Garinis G.A., Raams A., Lalai A.S., Robinson A.R., Appeldoorn E., Odijk H., Oostendorp R., Ahmad A., Van Leeuwen W. et al. (2006) A new progeroid syndrome reveals that genotoxic stress suppresses the somatotroph axis. Nature, 444, 1038–1043. [DOI] [PubMed] [Google Scholar]
- 42.Ciaffardini F., Nicolai S., Caputo M., Canu G., Paccosi E., Costantino M., Frontini M., Balajee A.S., Proietti-De-Santis L. (2014) The cockayne syndrome B protein is essential for neuronal differentiation and neuritogenesis. Cell Death Dis., 5, e1268. [DOI] [PMC free article] [PubMed] [Google Scholar]
- 43.Rapin I., Weidenheim K., Lindebbaum Y., Rosenbaum P., Merchant S., Krishna S., Dickson D. (2006) Cockayne syndrome in adults: review with clinical and pathologic study of a new case. Changes, 21, 991–1006. [DOI] [PMC free article] [PubMed] [Google Scholar]
- 44.Colella S., Nardo T., Botta E., Lehmann A.R., Stefanini M. (2000) Identical mutations in the CSB gene associated with either Cockayne syndrome or the DeSanctis-cacchione variant of xeroderma pigmentosum. Hum. Mol. Genet., 9, 1171–1175. [DOI] [PubMed] [Google Scholar]
- 45.Gautier L., Cope L., Bolstad B.M., Irizarry R.A. (2004) Affy—analysis of Affymetrix GeneChip data at the probe level. Bioinformatics, 20, 307–315. [DOI] [PubMed] [Google Scholar]
- 46.Patel R.K., Jain M. (2012) NGS QC Toolkit: a toolkit for quality control of next generation sequencing data. PLoS One, 7, e30619. [DOI] [PMC free article] [PubMed] [Google Scholar]
- 47.Dobin A., Davis C.A., Schlesinger F., Drenkow J., Zaleski C., Jha S., Batut P., Chaisson M., Gingeras T.R. (2013) STAR: ultrafast universal RNA-seq aligner. Bioinformatics, 29, 15–21. [DOI] [PMC free article] [PubMed] [Google Scholar]
- 48.Benjamini Y., Hochberg Y. (1995) Controlling the false discovery rate: a practical and powerful approach to multiple testing. J. R. Stat. Soc. Ser. B, 57, 289–300. [Google Scholar]
- 49.Schmittgen T.D., Livak K.J. (2008) Analyzing real-time PCR data by the comparative C(T) method. Nat. Protoc., 3, 1101–1108. [DOI] [PubMed] [Google Scholar]
- 50.Benavides-Piccione R., Ballesteros-Yáñez I., DeFelipe J., Yuste R. (2002) Cortical area and species differences in dendritic spine morphology. J. Neurocytol., 31, 337–346. [DOI] [PubMed] [Google Scholar]
Associated Data
This section collects any data citations, data availability statements, or supplementary materials included in this article.