Abstract
Purpose
To understand how hydrodynamic and morphologic changes in the aqueous humor outflow pathway contribute to decreased aqueous humor outflow facility after acute elevation of intraocular pressure (IOP) in bovine eyes.
Methods
Enucleated bovine eyes were perfused at 1 of 4 different pressures (7, 15, 30, 45 mm Hg) while outflow facility was continuously recorded. Dulbecco PBS + 5.5 mM glucose containing fluorescent microspheres (0.5 μm, 0.002% vol/vol) was perfused to outline aqueous outflow patterns, followed by perfusion-fixation. Confocal images were taken along the inner wall (IW) of the aqueous plexus (AP) in radial and frontal sections. Percentage effective filtration length (PEFL; IW length exhibiting tracer labeling/total length of IW) was measured. Herniations of IW into collector channel (CC) ostia were examined and graded for each eye by light microscopy.
Results
Increasing IOP from 7 to 45 mm Hg coincided with a twofold decrease in outflow facility (P < 0.0001), a 33% to 57% decrease in PEFL with tracer confined more to the vicinity of CC ostia, progressive collapse of the AP, and increasing percentage of CC ostia exhibiting herniations (from 15.6% ± 6.5% at 7 mm Hg to 95% ± 2.3% at 30 mm Hg [P < 10−4], reaching 100% at 45 mm Hg).
Conclusions
Decreasing outflow facility during acute IOP elevation coincides with a reduction in available area for aqueous humor outflow and the confinement of outflow to the vicinity of CC ostia. These hydrodynamic changes are likely driven by morphologic changes associated with AP collapse and herniation of IW of AP into CC ostia.
Primary open-angle glaucoma (POAG) affects more than 70 million people worldwide.1 A primary risk factor associated with POAG is the elevation of intraocular pressure (IOP), which is caused by increased resistance to aqueous humor outflow.2,3 Despite more than 100 years of investigation, the source of outflow resistance in normal and POAG eyes remains elusive. Because of our lack of knowledge concerning the source(s) of trabecular outflow resistance, virtually all medical therapy for POAG is directed toward reducing aqueous production or augmenting uveoscleral outflow rather than increasing trabecular outflow.4 Several investigators have localized the primary site of outflow resistance to a thin region of tissue that includes the inner wall (IW) endothelium of Schlemm canal (SC) and the underlying juxtacanalicular connective tissue (JCT).3,5–7 The elevated outflow resistance in POAG may be attributed to these same tissues.5 However, after complete trabeculotomy, only 50% of outflow resistance was eliminated at normal IOP in enucleated human eyes (7 mm Hg), and 75% of outflow resistance was eliminated at higher IOP (25 mm Hg),5,8 suggesting that the change in outflow resistance with increasing IOP is likely associated with pressure-dependent changes in the trabecular meshwork (TM) and SC and that additional sources of resistance distal to the inner wall of SC likely exist and may contribute to increased outflow resistance with increasing IOP. Hydrodynamic details of aqueous humor outflow, including specifically how outflow patterns change with increasing IOP and how this relates to outflow resistance, remain poorly understood.
Previous tracer studies suggest that the available area for aqueous humor filtration may vary with different perfusion pressures and structural configurations within the IW and JCT.9–11 A nonuniform or “segmental” outflow pattern has been reported when perfusing cationic ferritin at 15 mm Hg in enucleated human eyes,10,11 such that only a fraction of the total area of the outflow pathway is actively involved in aqueous humor filtration at any given instant. This area is termed the effective filtration area.12 However, by perfusing the same tracer, cationic ferritin, at lower IOP (9 mm Hg), de Kater et al.13 reported a more homogeneous tracer distribution in the JCT of human eyes, suggesting that a larger area was labeled by the tracer at a lower IOP. Sabanay et al.9 reported that after perfusing H7, a compound known to inhibit cell contractility and to increase outflow facility reversibly in monkey eyes in vivo, the outflow pattern labeled by colloidal gold particles changed from punctuate in control eyes to a uniform distribution along the inner wall of SC in experimental eyes. This flow pattern change was associated with expanded intercellular spaces in the JCT and highly extended inner wall cells of SC, indicating a close relationship between the outflow pattern and structural changes of the inner wall and JCT. However, there are some limitations to these tracer studies. Only a small region of the TM tissue was examined in radial sections by electron microscopy, leaving the location of the examined tissue unknown with regard to the collector channel (CC) ostia, where preferential flow was reported.14 These limitations made it difficult to unravel the hydrodynamic details of aqueous outflow over the entire TM region and motivated us to develop a technique involving the use of fluorescent tracers viewed by confocal microscopy, allowing for direct comparison between outflow facility and hydrodynamic patterns of aqueous humor outflow on a larger scale and for observation of microscopic structural changes within the same tissue.
We hypothesize that a decrease in outflow facility is associated with a reduction in the effective filtration area of aqueous outflow, which may be regulated by structural changes in the aqueous outflow pathway. To investigate this hypothesis, we used our recently developed technique15 with which to label aqueous outflow with fluorescent microspheres and to examine tissue by confocal microscopy to study the relationship between the changes in outflow facility and the pattern of aqueous outflow as a function of IOP. Subsequently, these same tissues can be processed and examined by light microscopy so that morphologic changes in the bovine aqueous outflow pathway can be correlated with changes in outflow facility and hydrodynamic patterns of aqueous outflow after acute elevations of IOP.
Materials and Methods
Materials
Thirty-four enucleated bovine eyes were obtained from a local abattoir (Arena and Sons, Hopkinton, MA) and delivered on ice within 6 hours of death. Eyes with any discernible damage or accumulated blood in the limbus or anterior chamber were excluded. The perfusion fluid was Dulbecco PBS (Invitrogen, Grand Island, NY) containing 5.5 mM d-glucose (collectively referred to as DBG) that was passed through a 0.2-μm cellulose acetate filter before use.
Carboxylate-coated fluorescent microspheres (0.5 μm; Molecular Probes FluoSpheres, Carlsbad, CA) with emission/excitation wavelengths (Red 580/605 nm) suspended in DBG (0.002% vol/vol) were used in this study to trace changes in aqueous outflow patterns in the JCT and inner wall of the aqueous plexus (AP; the equivalent of SC in human eyes16) in bovine eyes. The size and concentration of fluorescent microspheres used in this study were based on a previous study by Johnson et al.,17 who showed significant capturing for 0.46-μm particles and not impeding outflow.
Perfusion Procedure
The mechanical setup of the perfusion system has been described.18,19 Briefly, the perfusion system consisted of a perfusion reservoir and a collection reservoir. The perfusion reservoir was linked to a pressure transducer connected electronically by a computer data-logging system (Macintosh G4; Apple Computers, Cupertino, CA). This perfusion system maintained a constant IOP. Outflow facility (C = Q/IOP) was measured at 10 Hz and averaged over a 10-second window, and it was electronically recorded every 10 seconds by graphical software (Lab-View, version 7.0; National Instrument, Austin, TX).
Bovine eyes were cleared of extraocular tissue and submerged to the limbus in PBS at 34°C. A 21-gauge infusion needle connected to a perfusion chamber was inserted intracamerally and was carefully threaded through the pupil with the needle tip positioned in the posterior chamber to prevent deepening of the anterior chamber, which could lead to an artificial increase in outflow facility.20 A second needle was inserted intracamerally and connected to the collection reservoir. During perfusion, the collection reservoir tube was clamped. Eyes were perfused at 1 of 4 different pressures (7 mm Hg [equivalent to 15 mm Hg in vivo when episcleral venous pressure was included], n = 9; 15 mm Hg, n = 8; 30 mm Hg, n = 11; 45 mm Hg, n = 6). A baseline outflow facility was recorded for each eye during perfusion with DBG for at least 30 minutes. A fixed volume (0.5 mL) of fluorescent microspheres (0.5-μm diameter, 0.002% vol/vol) in DBG was then exchanged (7 mL) into the anterior chamber, and the same solution was perfused to deliver a consistent amount of tracer to each eye while facility was continually recorded. The anterior chamber contents of all eyes were exchanged with 7 mL Karnovsky fixative (2.5% glutaraldehyde and 2% paraformaldehyde in PBS [pH 7.3]) and were perfused with an additional 0.5 mL of the same fixative. After fixation, a 1-cm cut was made in the equator of each eye to ensure better fixation. The eyes were immersed in Karnovsky fixative and refrigerated until further processing.
Confocal Microscopy
Fixed eyes were cut in half at the equator of the globe, and the vitreous body and lens were carefully removed. Anterior segments were divided into four quadrants (temporal, nasal, superior, inferior). Sections of TM (1–1.5-mm thick) were cut radially or tangentially to the corneoscleral limbus and perpendicularly to the ocular surface. The latter orientation was described as a frontal section in a previous study14; thus, for consistency in the literature, we use the same term in this study. Sections were counterstained (To-Pro3; Molecular Probes, Eugene, OR) for 30 minutes so that all cell nuclei could be visualized, followed by three successive 5-minute washes in PBS. The same washing procedure was used for all groups to eliminate the possibility of unequal removal of tracer. The sections were examined under a confocal microscope (510, Axiovert 100M Laser Scanning Microscope; Carl Zeiss, Heidelberg, Germany). A multitrack channel system was used to visualize the red fluorescent microspheres under 10× and 20× magnifications. Images were taken at random locations along the IW of the AP regardless of the presence of local tracer accumulation and were segregated into those with and those without an associated CC ostium so that the distribution of the tracers along the IW and the TM could be better analyzed.
Effective Filtration Length
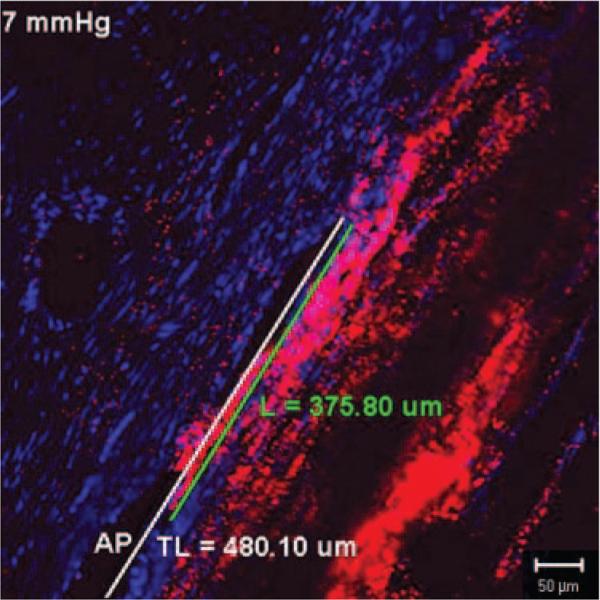
The ratio of the filtration length (L) of the IW exhibiting tracer labeling to the total length (TL) of the IW of the AP was measured on frontal sections using Zeiss software (LSM 510 version 3.2 PS2; Fig. 1). The percentage effective filtration length (PEFL = L/TL) was calculated in at least 15 images per eye (including all four quadrants).
Figure 1.
Measurement of effective filtration length. Effective filtration length was calculated as L/TL, the ratio of the length of the tracer labeling (L, green line) to the total length of the IW (TL, white line) of AP.
Light Microscopy
Sections viewed by confocal microscopy containing the AP or CCs were processed for light microscopy. They were postfixed in 2% osmium tetroxide and 1.5% potassium ferrocyanide for 2 hours, dehydrated in a graded series of ethanols, and embedded in Epon-Araldite. Semithin sections (3 μm) were cut and stained with 1% toluidine blue (Fisher Scientific, Pittsburgh, PA). Light micrographs were taken along the IW of the AP at magnifications of 10× and 20× to analyze the morphologic changes in the different IOP groups.
Herniation Analysis
At least eight ostia in each eye were examined and graded as open (Fig. 2A), partially obstructed (Fig. 2B), or completely obstructed (Fig. 2C) by IW and JCT tissue protruding into the CC ostium. We refer to these as herniations. The mean percentage of ostia partially and completely obstructed by herniations was calculated in each IOP group.
Figure 2.
Grading system for the CC ostia obstructed by herniated tissue. Light microscopic images with AP and CC ostia were graded as open (A), partially obstructed (B), or completely obstructed (C) by herniated tissue.
Statistical Methods
The two-tailed Student's t-test was applied with a required significance level of 0.05
Results
Outflow Facility
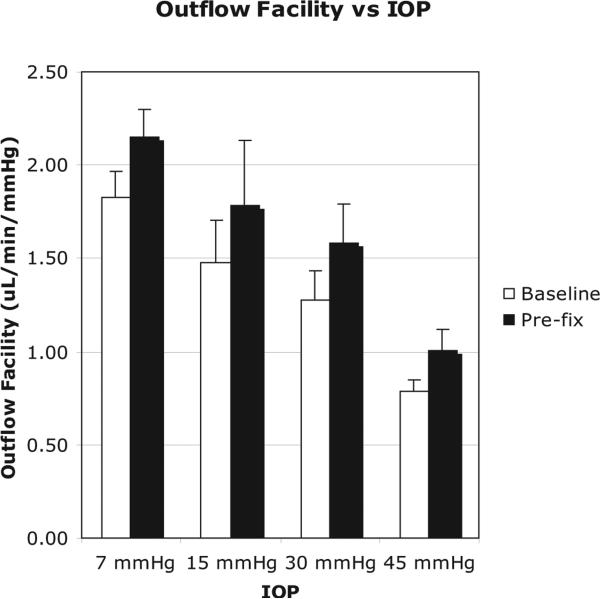
Outflow facility was found to decrease with increasing IOP (Fig. 3). The average baseline facility at 7 mm Hg was 1.83 ± 0.14 μL/min/mm Hg (mean ± SEM), which was significantly higher than the facility at 15 mm Hg (1.28 ± 0.24 μL/min/mm Hg; P = 0.0189), 30 mm Hg (1.27 ± 0.15 μL/min/mm Hg; P = 0.0156), and 45 mm Hg (0.79 ± 0.06 μL/min/mm Hg; P < 0.0001). Increasing IOP from 7 to 45 mm Hg coincided with a twofold decrease in baseline outflow facility (P < 0.0001). The average baseline facility decreased from 15 to 30 mm Hg, but was not statistically significant (P = 0.975). A significant average baseline facility decrease was found between 15 and 45 mm Hg (P = 0.015) and 30 and 45 mm Hg (P = 0.012). For all four IOP groups, the prefixation facility was higher than the measured baseline facility. Mean prefixation facility was between 18% and 27% higher than the baseline facility but lacked statistical significance in all groups (P > 0.05).
Figure 3.
Relationship between outflow facility (μL/min/mm Hg) and IOP (mm Hg). As IOP increased from 7 mm Hg to 45 mm Hg, the outflow facility decreased significantly (P = 0.0024).
Confocal Microscopy
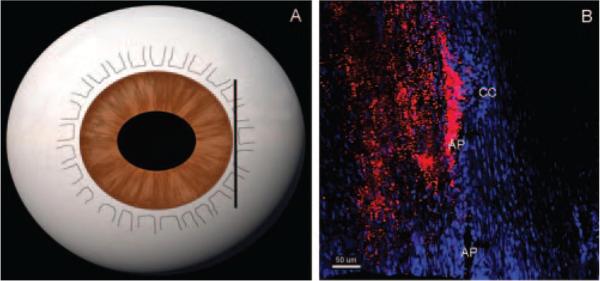
In radial sections of eyes perfused at 15 mm Hg, a nonhomogeneous distribution of microspheres was observed. Tracer distribution was dependent on proximity to the CC ostia. Microspheres were usually observed in sections that contained a CC ostium, but they tended to be absent in the sections lacking a CC ostium (Fig. 4). Although unappreciable in radial sections, in frontal sections, the decorated length along the AP, as labeled by fluorescent microspheres, decreased circumferentially and was increasingly confined near the CC ostia as pressure increased (Fig. 5).
Figure 4.
Tracer distribution in radial sections at 15 mm Hg. In radial sections (A), tracer distribution was dependent on proximity to the collector CC. Radial sections that do not contain a CC ostium (B) have less tracer or no tracer labeling compared with radial sections containing a CC ostium, which have more tracer labeling (red, C) along the AP. TM, trabecular meshwork.
Figure 5.
Tracer distribution in frontal sections at 15 mm Hg. In frontal sections, tangential to the corneoscleral limbus and perpendicular to the ocular surface (A), segmental tracer distribution concentrated near the CC ostium was observed (B). Less tracer labeling was seen along the AP away from CC ostium. Scale bar, 50 μm.
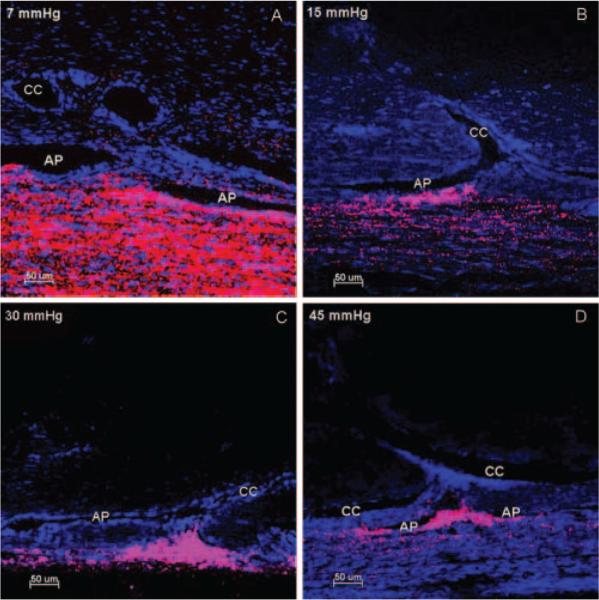
A segmental flow pattern was observed in all four IOP groups, with a greater concentration of microspheres in the TM near the CC ostia. With increasing IOP, the length of tracer labeling along the IW of the aqueous plexus decreased, and the outflow patterns across the JCT and IW transitioned from a less segmental pattern at 7 mm Hg (Fig. 6A) to an increasing segmental pattern at 15 to 45 mm Hg (Figs. 6A–D) near the CC ostia.
Figure 6.
Distribution of fluorescent microspheres near CC ostia at four IOPs. At 7 mm Hg (A), less segmental distribution of microspheres (red) was found along the inner wall of the AP. In contrast, at pressures of 15 mm Hg (B), 30 mm Hg (C), and 45 mm Hg (D), there was an increasing segmental pattern of microsphere distribution with a greater concentration of microspheres in the trabecular meshwork near the CC ostia. Triangular distribution of microspheres was seen when more trabecular meshwork tissue was herniated into CC ostia (C) compared with a more diffuse pattern when less trabecular mesh-work tissue (B, D) herniated into CC ostia. Collapse of AP was seen with increasing IOP. Scale bar, 50 μm.
Measurement of Effective Filtration Length
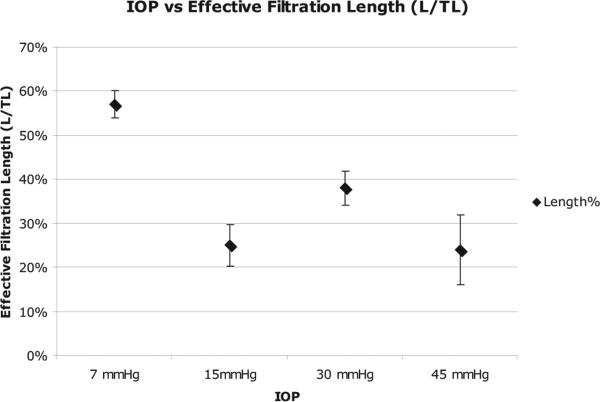
Changes in hydrodynamic outflow pattern were observed when the perfusion pressure was increased above 7 mm Hg, corresponding to a 33% to 57% reduction in effective filtration length (EFL; Fig. 7). The EFL at a perfusion pressure of 7 mm Hg (57% ± 3%) was significantly larger than the EFL of 15 mm Hg (25% ± 5%; P = 0.0009), 30 mm Hg (38% ± 4%; P = 0.0103), and 45 mm Hg (24% ± 8%; P = 0.0074). However, there was not a significant difference in filtration area between groups perfused at 15 mm Hg and higher (15 vs. 30 mm Hg, P = 0.084; 15 vs. 45 mm Hg, P = 0.986; 30 vs. 45 mm Hg, P = 0.167).
Figure 7.
Relationship between effective filtration length and IOP. Effective filtration length (%) measured as a function of IOP. As IOP increased, the percentage of effective filtration length decreased.
Light Microscopy
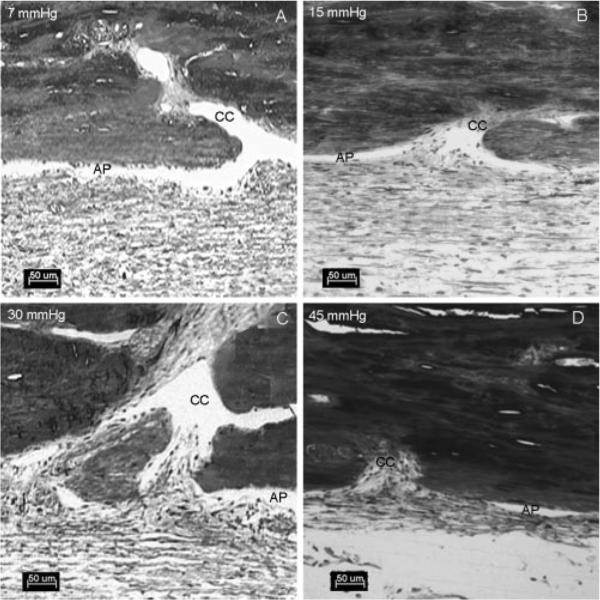
At 7 mm Hg, the lumen of the aqueous plexus was open (Fig. 8A) and had a few herniations that only partially obstructed the CC ostia. At 15 mm Hg, the number of focal herniations increased. Again, however, most of these herniations resulted in only partial obstruction, with most of the aqueous plexus remaining open (Fig. 8B). At 30 to 45 mm Hg, the number of herniations increased (Figs. 8C, 8D) and often fully obstructed the CC ostia. It was also observed that in the areas near the CC ostia, the diameter of the aqueous plexus became progressively narrowed or completely collapsed at higher perfusion pressures (Fig. 8).
Figure 8.
Light microscopy of the aqueous plexus and CCs at four different pressures. At 7 mm Hg (A), the aqueous plexus (AP) was open. At 15 mm Hg (B), the AP was open and the IW tissue and JCT tissue were partially herniated into the CC ostia. At 30 mm Hg (C) and 45 mm Hg (D), the AP was collapsed adjacent to the CC ostia. There was a more dramatic herniation of the IW and JCT into the CC ostia. Scale bar, 50 μm.
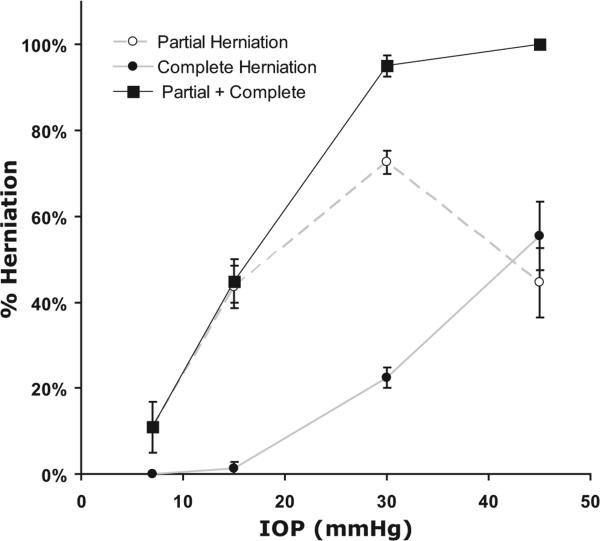
As IOP increased, the mean percentage of ostia obstructed by herniations (partially and completely) increased (Fig. 9). At 7 mm Hg, 15.6% ± 6.5% (mean ± SEM) of the total ostia analyzed (n = 59) exhibited at least some degree of herniations. At 15 mm Hg, 46.4% ± 3.9% of ostia exhibited herniation, and 2.8% ± 1.8% exhibited complete obstruction (P = 0.002, compared with 7 mm Hg). At 30 mm Hg, 95% ± 2.3% of ostia displayed some degree of herniation. This was significantly higher than in the 15-mm Hg group (P < 0.0001), in which 29.3% ± 3.0% of the ostia were completely obstructed. At 45 mm Hg, 100% of all ostia analyzed showed some degree of herniation. This was not significantly higher than in the 30-mm Hg group (P = 0.81), but the percentage of ostia that were completely obstructed was 55.5% ± 8.1%, which was significantly higher than in the 30-mm Hg group (P = 0.02).
Figure 9.
Percentage ostia obstructed by herniated tissue as a function of IOP. As IOP increased, the number and degree of CC ostia obstructed by herniated IW and JCT increased.
Discussion
In this study, a newly developed technique using fluorescent tracers, as viewed by confocal microscopy, was used to investigate the relationship between changes in outflow facility and pattern of aqueous outflow as a function of IOP. Subsequently, these same tissues were examined by light microscopy so that morphologic changes in the bovine aqueous outflow pathway could be correlated with changes in outflow facility and hydrodynamic patterns of outflow after acute elevation of IOP. The advantages of using fluorescent tracers with confocal microscopy are that it requires minimal tissue preparation and that the TM tissue can be visualized on a much larger scale compared with previous tracer studies using electron microscopy.13,21 Because segmental outflow patterns appear to vary with the spacing of CC ostia, tracers used at the electron microscopic level make it difficult to appreciate the patterns of aqueous humor outflow over the entire TM region. Another advantage of using fluorescent tracers with confocal microscopy was that the same tissue could be further processed for light microscopic examination after confocal images were acquired. With this technique, we found that decreasing outflow facility after acute IOP elevation coincided with a reduction in available area for aqueous outflow and confinement of outflow to the vicinity of CC ostia. These hydrodynamic changes were likely driven by morphologic changes associated with AP collapse and herniation of meshwork tissue into CC ostia. These data suggest a coupled interaction between tissue morphology and outflow hydrodynamics that together regulate outflow facility.
Our original protocol focused on analyzing traditional radial sections of the TM. The perfused tracers were found in some sections at varying densities but were completely absent in others (Fig. 4). To further investigate these heterogeneous distributions of tracers, we modified our protocol to include an additional plane of the section, tangential to the limbus and perpendicular to the ocular surface, referred to as frontal sections.14 Compared with radial sections, which provided only a cross-sectional view through the lumen of aqueous plexus with unknown proximity to the CC ostia, frontal sections gave a better representation of the outflow patterns circumferentially and of their relationship to CC ostia. We found more fluorescent tracer near CC ostia, which explained the heterogeneous distribution of tracer in the radial sections. This observation coincided with previous reports of a preferential flow route near CC ostia, where a greater density of giant vacuoles,14 inner wall pores (Evans AL, et al. IOVS 2004;45: ARVO E-Abstract 5024), and pigmentation were found (Tanchell NA, et al. IOVS 1984;25:ARVO Abstract 7). Our data also suggest that CC ostia may make an important contribution to outflow resistance by influencing the patterns of segmental outflow, possibly by affecting the pressure distribution within SC.22 Viewing frontal sections under the light microscope also allowed us to realize an increasing number of herniations of the IW and JCT into CCs as IOP was increased, an additional factor that may contribute to decreased outflow facility with acute IOP elevation. Our findings in bovine eyes suggest that the CC ostia region may represent a potentially important site of additional outflow resistance distal to the TM in POAG human eyes, in which further studies will be needed.
It has been well established that outflow facility decreases when perfusion pressure is increased.19,23–25 This pressure-induced decrease in outflow facility has been reported in enucleated human, monkey, bovine, and equine eyes and in living rabbit, cat, and monkey eyes.24,26,27 Several investigators have attributed this phenomenon to a pressure-induced collapse of SC.23–25 After correlating our confocal and light microscopic images, we observed that the AP collapse was not circumferentially uniform but tended to occur in areas near the CC ostia, which confined outflow to this region. Fewer tracers flowed through the area between CC ostia at elevated IOP, even where the AP was still open. This further confirms the proposed existence of a preferential flow route near CC ostia. Progressive herniations of the IW and JCT into the CC ostia may be an important additional factor contributing to a decrease in outflow facility at elevated IOP. Previous studies using mathematical models predicted that increased IOP could cause partial protrusion of the IW into the CC ostia, where the canal pressure is lowest.28 This prolapse of the IW and JCT in CC ostia has been observed in monkey eyes perfusion fixed at 50 mm Hg in vivo,29 but the potential functional significance was not discussed. Our data suggest that as IOP increases, the IW and JCT of the AP herniate into CC ostia, accompanied by the collapse of the AP adjacent to CC ostia. These changes appear to have confined the outflow to herniated sites, resulting in a decrease in effective filtration area for aqueous outflow.
We hypothesized that effective filtration length was one of the contributing factors in the determination of outflow resistance, regulated by morphologic changes. This has been supported by our previous study in which we demonstrated that the structural change, a separation between the JCT and the IW, correlated to the increase in outflow facility and effective filtration length after Rho-kinase inhibitor Y27632 treatment.15 In the present study, we detected a trend of decreasing effective filtration length associated with decreased outflow facility with elevated IOP. However, the bulk of the effective filtration length change occurred between 7 and 15 mm Hg; no statistically significant correlation was found above 15 mm Hg, whereas facility continued to decrease above 15 mm Hg. There were two possible explanations for this. First, at 15 mm Hg and above, the number of herniations was increased significantly and was associated with collapse of the aqueous plexus near the CC ostia. It has been documented that the further narrowing and eventual collapse of SC occurs at higher IOP and corresponds to a greater increase in outflow resistance.22 These morphologic changes are likely additive to the effect of decreasing outflow facility because the two resistances occur in series. Second, our one-dimensional linear measurement of effective filtration length may be limited in fully reflecting morphologic changes such as inner wall extension and herniations into CC ostia at higher IOP, whereas morphologic changes appear to have a better correlation with the decrease in outflow facility with increasing IOP. In addition, the possible variability in magnitude of fluorescent labeling may contribute to the lack of a statistically significant correlation between effective filtration length and outflow resistance above 15 mm Hg. The present experiments, however, were designed to detect changes in tracer patterns, not intensity. Our ongoing study in human eyes will further address this issue.
The result of this study provides a possible mechanism for changes in outflow facility with IOP variations. Our current model using enucleated bovine eyes has limitations that apply to open-angle glaucoma in humans because of the anatomic differences between bovine and human eyes and the lack of vital mechanisms occurring in vivo. However, the availability of bovine eyes allows a practical way to develop techniques and to test our working hypothesis. In addition, this study has formed the foundation for our subsequent study involving normal and glaucomatous human eyes.
Previous studies demonstrated a similar outflow resistance in vivo and in enucleated human eyes.5 In vivo, however, aqueous movement into the episcleral vein from SC is pulsatile.30,31 Blood pulsations with each heartbeat transmit waves that create transient, repetitive changes in IOP at a rate of approximately 2.7 mm Hg/s (ocular pulse).32 It is unknown how these cyclic changes in IOP contribute to the regulation of aqueous outflow resistance. Decreased outflow facility was recently reported in a cyclically pulsed anterior segment perfusion model in porcine and human eyes33 and was thought to be caused by an active response of the conventional outflow tissues to a biomechanical stimulus. Interestingly, despite the physiologic and anatomic differences known to exist among species, the porcine and human anterior segments showed similar behavior in response to cyclic biomechanical stress. Although similar herniations of the IW and JCT in CC ostia have been observed in monkey eyes perfusion fixed at 50 mm Hg in vivo,29 in immersion-fixed human glaucomatous eyes (Gong H, et al. IOVS 2007;48:E-Abstract 2079) and in normal human eyes after experimentally induced elevation of IOP (Zhu J, et al. IOVS 2008;49:E-Abstract 1639), whether ocular pulse has an influence on herniation formation in vivo remains to be determined.
Our studies suggest that a decrease in effective filtration area for aqueous humor and an increasing number of herniations into CC ostia may be additional factors that contribute to an increase in outflow resistance at experimentally induced acute IOP elevations. In our present study and a previous study,15 a link is established among changes in outflow facility, aqueous outflow pattern, and tissue architecture. Increasing pressure influences tissue structure (collapse of AP and CC ostia obstructed by herniations), resulting in a decrease in the effective filtration area that in turn influences outflow resistance. Therefore, our data suggest an intricate relationship between the hydrodynamics and the tissue structure that work together to regulate outflow resistance. A coupling effect occurs between pressure-induced changes in outflow patterns, tissue structures, and outflow resistance. Further studies are needed to confirm whether these changes could be reproduced in normal and glaucomatous human eyes. Such a study would give us a better understanding of the sources of outflow resistance distal to the trabecular meshwork and their possible contribution to the pathogenesis of POAG.
Acknowledgments
The authors thank Kristine Erickson for the generous use of her ocular perfusion system and Rozanne Richman for technical assistance.
Supported by National Institutes of Health Grant EY007149, National Glaucoma Research (HG, DRO), and Massachusetts Lions Eye Research Fund (Boston University).
Footnotes
Disclosure: S.A. Battista, None; Z. Lu, None; S. Hofmann, None; T. Freddo, None; D.R. Overby, None; H. Gong, None
The publication costs of this article were defrayed in part by page charge payment. This article must therefore be marked “advertisement” in accordance with 18 U.S.C. §1734 solely to indicate this fact.
References
- 1.Quigley HA. Number of people with glaucoma worldwide. Br J Ophthalmol. 1996;80:389–393. doi: 10.1136/bjo.80.5.389. [DOI] [PMC free article] [PubMed] [Google Scholar]
- 2.Grant WM. Clinical tonography. Trans Am Acad Ophthalmol Otolaryngol. 1951:774–781. [PubMed] [Google Scholar]
- 3.Grant WM. Further studies on facility of flow through the trabecular meshwork. AMA Arch Ophthalmol. 1958;60:523–533. doi: 10.1001/archopht.1958.00940080541001. [DOI] [PubMed] [Google Scholar]
- 4.AGIS Investigators The Advanced Glaucoma Intervention Study (AGIS), 7: the relationship between control of intraocular pressure and visual field deterioration. Am J Ophthalmol. 2000;130:429–440. doi: 10.1016/s0002-9394(00)00538-9. [DOI] [PubMed] [Google Scholar]
- 5.Grant WM. Experimental aqueous perfusion in enucleated human eyes. Arch Ophthalmol. 1963;69:783–801. doi: 10.1001/archopht.1963.00960040789022. [DOI] [PubMed] [Google Scholar]
- 6.Mäepea O, Bill A. The pressures in the episcleral veins, Schlemm's canal and the trabecular meshwork in monkeys: effects of changes in intraocular pressure. Exp Eye Res. 1989;49:645–663. doi: 10.1016/s0014-4835(89)80060-0. [DOI] [PubMed] [Google Scholar]
- 7.Mäepea O, Bill A. Pressures in the juxtacanalicular tissue and Schlemm's canal in monkeys. Exp Eye Res. 1992;54:879–883. doi: 10.1016/0014-4835(92)90151-h. [DOI] [PubMed] [Google Scholar]
- 8.Rosenquist R, Epstein D, Melamed S, Johnson M, Grant WM. Outflow resistance of enucleated human eyes at two different perfusion pressures and different extents of trabeculotomy. Curr Eye Res. 1989;8:1233–1240. doi: 10.3109/02713688909013902. [DOI] [PubMed] [Google Scholar]
- 9.Sabanay I, Gabelt BT, Tian B, Kaufman PL, Geiger B. H-7 effects on the structure and fluid conductance of monkey trabecular mesh-work. Arch Ophthalmol. 2000;118:955–962. [PubMed] [Google Scholar]
- 10.Hann CR, Bahler CK, Johnson DH. Cationic ferritin and segmental flow through the trabecular meshwork. Invest Ophthalmol Vis Sci. 2005;46:1–7. doi: 10.1167/iovs.04-0800. [DOI] [PubMed] [Google Scholar]
- 11.Ethier CR, Chan DW. Cationic ferritin changes outflow facility in human eyes whereas anionic ferritin does not. Invest Ophthalmol Vis Sci. 2001;42:1795–1802. [PubMed] [Google Scholar]
- 12.Barany EH. The immediate effect on outflow resistance of intravenous pilocarpine in the vervet monkey, Cercopithecus ethiops. Invest Ophthalmol Vis Sci. 1967;6:373–380. [Google Scholar]
- 13.de Kater AW, Melamed S, Epstein DL. Patterns of aqueous humor outflow in glaucomatous and nonglaucomatous human eyes: a tracer study using cationized ferritin. Arch Ophthalmol. 1989;107:572–576. doi: 10.1001/archopht.1989.01070010586035. [DOI] [PubMed] [Google Scholar]
- 14.Parc CE, Johnson DH, Brilakis HS. Giant vacuoles are found preferentially near collector channels. Invest Ophthalmol Vis Sci. 2000;41:2984–2990. [PubMed] [Google Scholar]
- 15.Lu Z, Overby DR, Scott PA, Freddo TF, Gong H. The mechanism of increasing outflow facility by rho-kinase inhibition with Y-27632 in bovine eyes. Exp Eye Re. 2008;86:271–281. doi: 10.1016/j.exer.2007.10.018. [DOI] [PMC free article] [PubMed] [Google Scholar]
- 16.Tripathi RC. Ultrastructure of the exit pathway of the aqueous in lower mammals: a preliminary report on the “angular aqueous plexus.”. Exp Eye Res. 1971;12:311–314. doi: 10.1016/0014-4835(71)90155-2. [DOI] [PubMed] [Google Scholar]
- 17.Johnson M, Johnson DH, Kamm RD, de Kater AW, Epstein DL. The filtration characteristics of the aqueous outflow system. Exp Eye Res. 1990;50:407–418. doi: 10.1016/0014-4835(90)90142-h. [DOI] [PubMed] [Google Scholar]
- 18.Erickson-Lamy K, Schroeder AM, Bassett-Chu S, Epstein DL. Absence of time-dependent facility increase (“washout”) in the per-fused enucleated human eye. Invest Ophthalmol Vis Sci. 1990;31:2384–2388. [PubMed] [Google Scholar]
- 19.Scott PA, Overby DR, Freddo TF, Gong H. Comparative studies between species that do and do not exhibit the washout effect. Exp Eye Res. 2007;84:435–443. doi: 10.1016/j.exer.2006.10.015. [DOI] [PMC free article] [PubMed] [Google Scholar]
- 20.Ellingsen BA, Grant WM. The relationship of pressure and aqueous outflow in enucleated human eyes. Invest Ophthalmol. 1971;10:430–437. [PubMed] [Google Scholar]
- 21.Overby DR. The Hydrodynamics of Aqueous Humor Outflow: Mechanical Engineering. Massachusetts Institute of Technology; Cambridge: 2002. p. 286. [Google Scholar]
- 22.Johnson MC, Kamm RD. The role of Schlemm's canal in aqueous outflow from the human eye. Invest Ophthalmol Vis Sci. 1983;24:320–325. [PubMed] [Google Scholar]
- 23.Ellingsen BA, Grant WM. Trabeculotomy and sinusotomy in enucleated human eyes. Invest Ophthalmol. 1972;11:21–28. [PubMed] [Google Scholar]
- 24.Moses RA. The effect of intraocular pressure on resistance to outflow. Surv Ophthalmol. 1977;22:88–100. doi: 10.1016/0039-6257(77)90088-1. [DOI] [PubMed] [Google Scholar]
- 25.Brubaker RF. The effect of intraocular pressure on conventional outflow resistance in the enucleated human eye. Invest Ophthalmol. 1975;14:286–292. [PubMed] [Google Scholar]
- 26.Ellingsen BA, Grant WM. Influence of intraocular pressure and trabeculotomy on aqueous outflow in enucleated monkey eyes. Invest Ophthalmol. 1971;10:705–709. [PubMed] [Google Scholar]
- 27.Hashimoto JM, Epstein DL. Influence of intraocular pressure on aqueous outflow facility in enucleated eyes of different mammals. Invest Ophthalmol Vis Sci. 1980;19:1483–1489. [PubMed] [Google Scholar]
- 28.Moses RA. The conventional outflow resistances. Am J Ophthalmol. 1981;92:804–810. doi: 10.1016/s0002-9394(14)75634-x. [DOI] [PubMed] [Google Scholar]
- 29.Grierson I, Lee WR. Changes in the monkey outflow apparatus at graded levels of intraocular pressure: a qualitative analysis by light microscopy and scanning electron microscopy. Exp Eye Res. 1974;19:21–33. doi: 10.1016/0014-4835(74)90068-2. [DOI] [PubMed] [Google Scholar]
- 30.Johnstone MA. The aqueous outflow system as a mechanical pump: evidence from examination of tissue and aqueous movement in human and non-human primates. J Glaucoma. 2004;13(5):421–438. doi: 10.1097/01.ijg.0000131757.63542.24. [DOI] [PubMed] [Google Scholar]
- 31.Johnstone MA. A new model describes an aqueous pump and causes of pump failure in glaucoma. In: Grehn F, Weinreb RN, editors. Essentials in Ophthalmology: Glaucoma. 1st ed. Springer; Berlin: 2006. [Google Scholar]
- 32.Kerr J, Nelson P, O'Brien C. Pulsatile ocular blood flow in primary open-angle glaucoma and ocular hypertension. Am J Ophthalmol. 2003;136:1106–1113. doi: 10.1016/s0002-9394(03)00717-7. [DOI] [PubMed] [Google Scholar]
- 33.Romas RF, Stamer WD. Effects of cyclic intraocular pressure on conventional outflow facility. Invest Ophthalmol Vis Sci. 2008;49:275–281. doi: 10.1167/iovs.07-0863. [DOI] [PMC free article] [PubMed] [Google Scholar]


