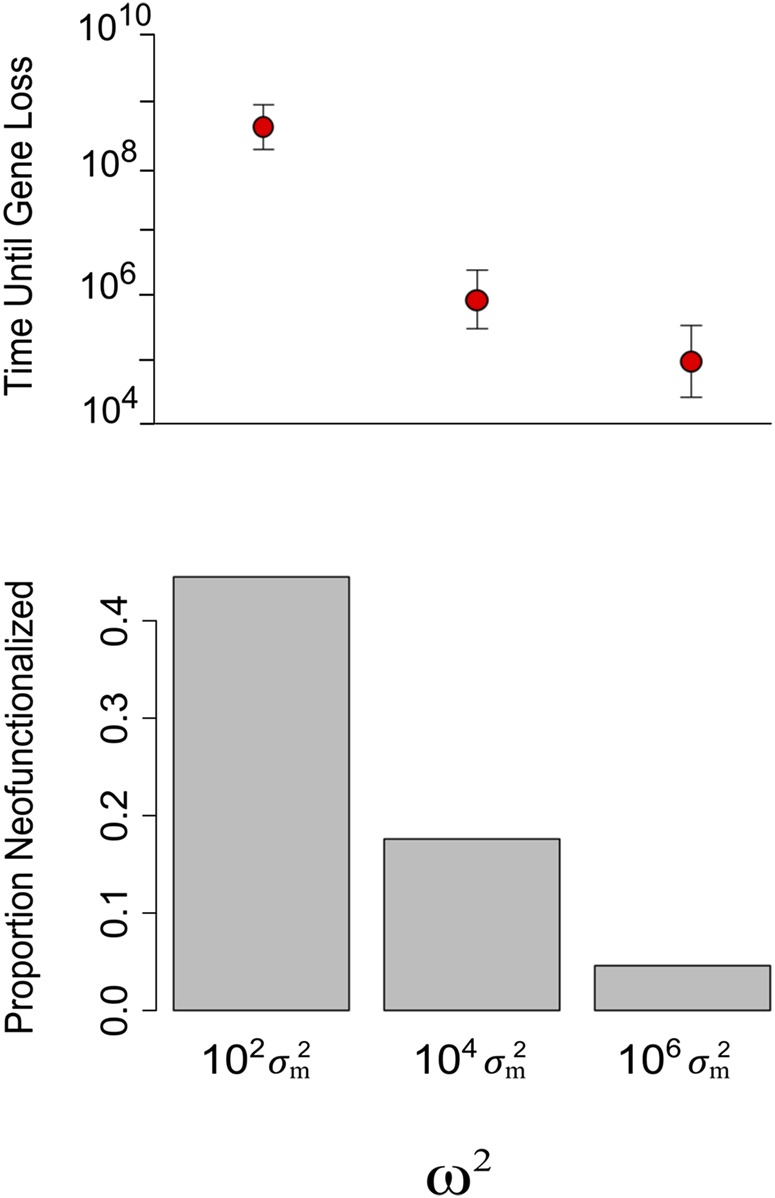
Figure 6.
Dosage-balance selection and the probability of neofunctionalization. The top panel shows the number of mutations (a proxy for time) that occur before one of the duplicates neofunctionalizes or pseudogenizes. Dots show the mean, and the whiskers show 1 SD. The bottom panel compares the frequency of neofunctionalization for three strengths of dosage-balance selection, from strong to very weak. Results are based on 103 simulations.

